


All Forum Posts by: Eric Fernwood
Eric Fernwood has started 64 posts and replied 778 times.
 Post: How/where to start owning rental properties?
- Realtor
- Las Vegas, NV
- Posts 809
- Votes 1,561
Hello Mark,
Real estate is the common person's path to financial independence. And, there is a safe and straightforward way to achieve financial independence, but it is not easy. There are five steps:

Goals
Define your goals. Your goals do not need to be anything detailed or complex, but your goals must contain at least the following three elements:
- Starting Point - How much capital and credit do you have or expect to have in a reasonable time frame? Unless you plan to pay cash for your properties, get pre-qualified for an investor loan, so you will know what you have to work with.
- End Goal - This is usually something like $10,000/Mo. income, in present value dollars.
- Time Frame - The shorter your time frame, the more initial capital and credit you will need.
Location
Location is the most important decision you will make, not the property. Why is location so important? Because you are looking for a long-term reliable income stream and that means that your rental income must keep pace or exceed the inflation rate. There are other location selection criteria, but price and rent growth is number one.
- Rent and Price Growth Rate - Inflation is constantly eroding buying power; each year, it costs more to buy the same set of goods and services. If you buy in a location where prices and rents rise faster than the inflation rate, your buying power will increase due to the increased rents. If you buy in a location where prices and rents are increasing below the inflation rate, your only option will be to decrease your standard of living over time. Also, do not rely on the rapid increases resulting from COVID; these increases are not sustainable. Evaluate locations based on the ten years preceding the COVID times compared to the current inflation rate (>5%).
- Population Size - Greater than 1 million. Small towns rely too much on a single business or market segment.
- Population Growth - If people are moving into a location, many things have to be right, including jobs and the cost of doing business. Do not invest in any location where the population is stagnant or declining.
- Crime - People and companies will not move to locations perceived as dangerous. One source of cities to avoid is Neighborhood Scout's 100 most dangerous cities.
- Disaster Risk - Some parts of the country suffer frequent natural disasters. The best indicator for natural disaster probability is the cost of homeowners insurance. Avoid states with high insurance rates. Note, even if insurance pays for all the damage your property suffers, you still lose. When a significant disaster occurs, businesses are destroyed so people and jobs move to locations where they can make money today. The location may take years to recover, or it may never recover. ValuePenguin is a good source for the relative cost of insurance by state.
If you select a location that meets all of the above goals, you have a good investment location.
Investment Team
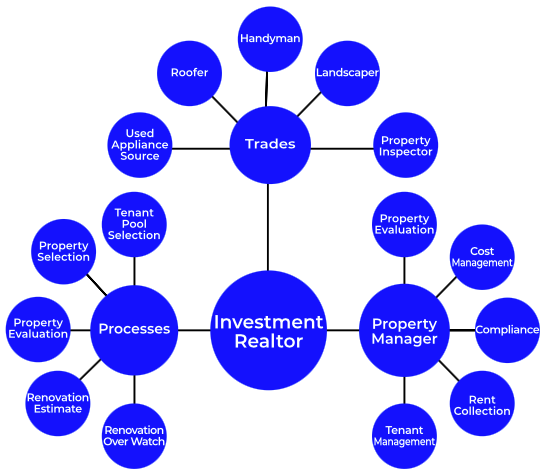
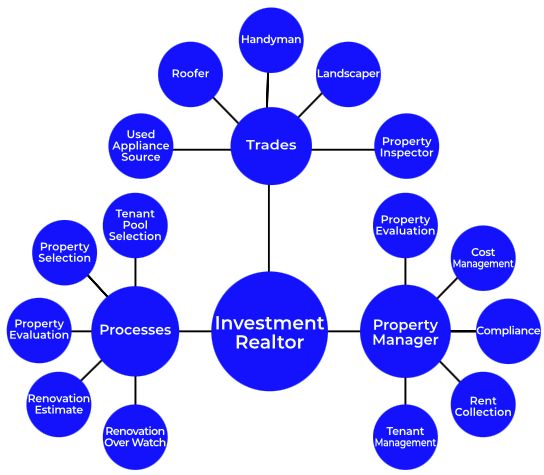
If you needed surgery, you would not start medical school. Also, not just any doctor will do. You want a surgeon that specializes in the kind of surgery you need, not a general practitioner. The same is true with real estate investing. You want to work with an investment team that already has the skills and a proven track record of finding, qualifying, renovating, and managing properties. A good investment team will minimize your risk and save you time and money. If you try to do everything yourself, it will cost you more, and the odds of success are much lower. The place to start is with an investment Realtor, not an investment "friendly" realtor. Below are the skills and experience an investment Realtor and their team members provide.
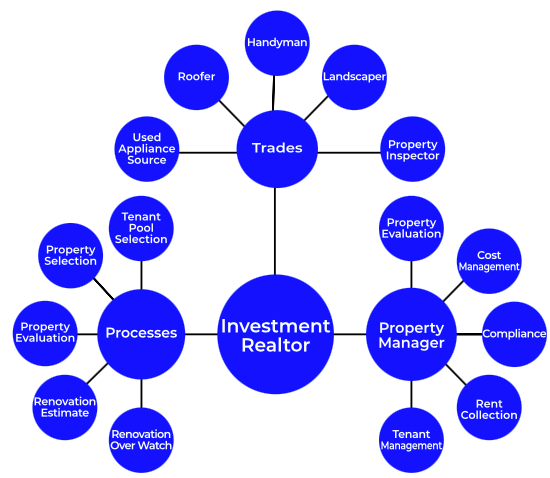
Finding an Investment Realtor may not be easy. Even in a large metro area, there is likely only one or at most two investment Realtors. To build a list of candidates, talk to property managers, cruise real estate investing sites, seek out local investors, etc. Once you have a list, follow the diagram below to determine if they have the skills and experience you need. Start at the top and ask each question, noting their answers. If they are unable to provide a satisfactory answer to any question, go to the next candidate.

If a candidate passes all of the above, you can be assured they know what they are doing.
Tenant Pool
The only way to consistently make money is to keep the property occupied by what I call a "good" tenant. A good tenant is someone who:
- Has stable employment in a market segment that is very likely to be stable or improve over time
- Has a credit history with which you can evaluate the likelihood that they will perform
- Pays all the rent on schedule
- Takes care of the property
- Does not cause problems with neighbors
- Does not engage in illegal activities while on the property
- Stays for many years
The right tenant pool is so important that I would interview multiple local property managers to validate the tenant pool selection. You will only want to buy properties that attract the tenant pool you want. Let me know if you would like more information about selecting the right tenant pool. I cannot stress enough the importance of targeting the right tenant pool.
Property
Only buy properties that your tenant pool is willing and able to rent. The property selection is based on the target tenant pool. See the image below.

The minimum property selection criteria:
- Reasonable maintenance cost
- Type: Condo, high rise, single-family, multi-family, etc.
- Price Range - You must be able to profitability rent the property within the target tenant pool's rent range.
- Location - Where the target tenant pool wants to live.
- Configuration: For example, >2,000SF, two bedrooms, three-car garage, large back yard, single-story, two stories, etc.
- Wants - Tenant pool specific property features. You largely implement tenant pool specific "wants" through renovation. For example, bars on the first-floor windows might be very important for one tenant pool. For another tenant pool, it might be granite kitchen counters.
In Conclusion
With sufficient initial cash and credit and following the above steps, your odds of achieving financial independence are very high.
Post: REI friendly Real Estate Agent in Las Vegas, Nevada
- Realtor
- Las Vegas, NV
- Posts 809
- Votes 1,561
Hello Darek,
If you needed surgery, you would not start medical school. Also, not just any doctor will do. You want a surgeon that specializes in the kind of surgery you need, not a general practitioner. The same is true with real estate investing. You want to work with an investment team that already has the skills and a proven track record of finding, qualifying, renovating, and managing properties. A good investment team will minimize your risk and save you time and money. If you try to do everything yourself, it will cost you more, and the odds of success are much lower. The place to start is with an investment Realtor, not an investment "friendly" realtor. Below are the skills and experience an investment Realtor and their team members provide.
Finding an Investment Realtor may not be easy. Even in a large metro area, there is likely only one or at most two investment Realtors. To build a list of candidates, talk to property managers, cruise real estate investing sites, and seek out local investors, etc. Once you have a list, follow the diagram below to determine if they have the skills and experience you need. Start at the top and ask each question, noting their answers. If they are unable to provide a satisfactory answer to any question, go to the next candidate.
If a candidate passes all of the above, you can be assured they know what they are doing.
Summary
Real estate investing is a business, not a hobby. You need the best team you can find. This article described the value an investment Realtor and their team provides and a method for qualifying the investment Realtor.
Post: Best places to invest around the country?
- Realtor
- Las Vegas, NV
- Posts 809
- Votes 1,561
Hello Jacob,
The most important decision you will make is the location, not the property. As long as you buy a property in a "good" location, all but the worst mistakes will be corrected over time through appreciation and rent increases. However, if you do not buy in a "good" location, you can do nothing to turn things around after the fact. Fortunately, selecting a "good" location is relatively easy if you use the right metrics.
- Rent and Price Growth Rate - Inflation is constantly eroding buying power; each year, it costs more to buy the same set of goods and services. If you buy in a location where prices and rents rise faster than the inflation rate, your buying power will increase due to the increased rents. If you buy in a location where prices and rents are increasing below the inflation rate, your only option will be to decrease your standard of living over time. Also, do not rely on the rapid increases resulting from COVID; these increases are not sustainable. Evaluate locations based on the ten years preceding the COVID times compared to the current inflation rate (>5%).
- Population Size - Greater than 1 million. Small towns rely too much on a single business or market segment.
- Population Growth - If people are moving into a location, many things have to be right, including jobs and the cost of doing business. Do not invest in any location where the population is stagnant or declining.
- Crime - People and companies will not move to locations perceived as dangerous. One source of cities to avoid is Neighborhood Scout's 100 most dangerous cities.
- Disaster Risk - Some parts of the country suffer frequent natural disasters. The best indicator for natural disaster probability is the cost of homeowners insurance. Avoid states with high insurance rates. Note, even if insurance pays for all the damage your property suffers, you still lose. When a significant disaster occurs, people and jobs move to locations where they can make money today. The location may take years to recover, or it may never recover. ValuePenguin is a good source for the relative cost of insurance by state.
I want to stress again that it is CRITICAL that you choose a location where pre-COVID appreciation is greater than the current inflation rate. If you choose a location where this is not the case, your first month's return will be the highest (inflation-adjusted) return you will ever receive from the property.
After location, the most important success factor is finding and working with a good investment team. If you needed surgery, you would not start medical school. Also, not just any doctor will do. You want a surgeon that specializes in the kind of surgery you need, not a general practitioner. The same is true with real estate investing. You want to work with an investment team that already has the skills and a proven track record of finding, qualifying, renovating, and managing properties. A good investment team will minimize your risk and save you time and money. If you try to do everything yourself, it will cost you more, and the odds of success are much lower. The place to start is with an investment Realtor, not an investment "friendly" realtor. Below are the skills and experience an investment Realtor and their team members provide at no cost to you.
However, it may be hard to find an investment Realtor. Even in a large metro area, there is likely only one or at most two investment Realtors. While finding an investment Realtor may take time, the cost, risk, and time savings will be worth it.
If you choose a good location and work with a good investment team, you should do well.
Post: Moving to Las Vegas - Housing market on fire
- Realtor
- Las Vegas, NV
- Posts 809
- Votes 1,561
Hello Christopher,
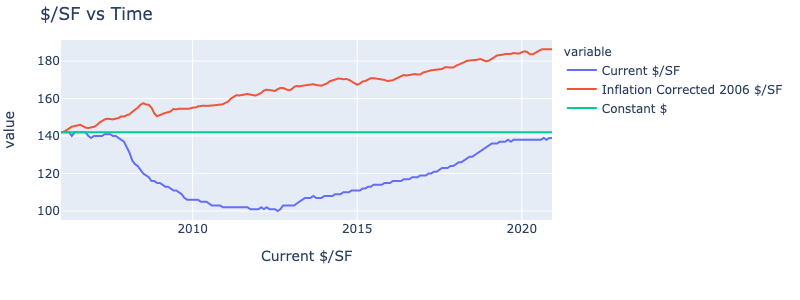
Prices have risen rapidly in Las Vegas, but the market is not a bubble, like in 2008. In 2008, prices were driven by speculation, not demand. Today, the increases are demand-driven, not speculation. Below is the data supporting my statement.
Where are prices today compared to peak prices in 2006?
As you can see from the chart below, if you adjust for inflation, prices are still about $40/SF below peak prices; the market has not recovered from the 2008 crash.
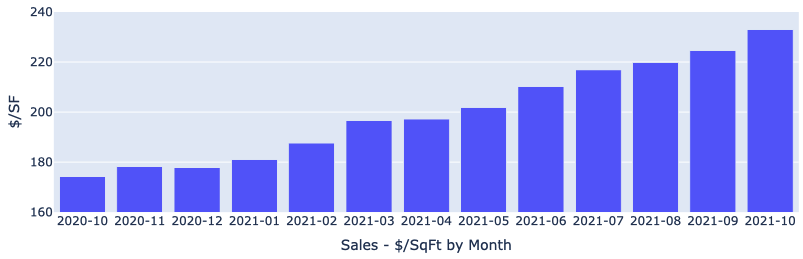
Below are two charts showing prices vs. inventory for the preceding 13 months. The data is for the single-family home segment we target (which includes the price range you mentioned), not the entire market.
Sales - Median $/SF by Month
Sales - Months of Supply
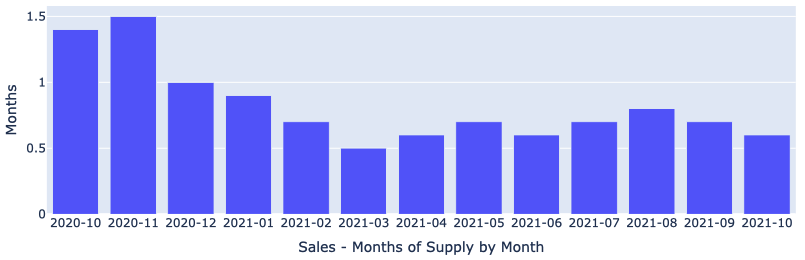
As you can see, inventory is symmetrical to median $/SF. This shows that price increases are driven by demand, not speculation.
Key Drivers of the Las Vegas Housing Market
What are the major market drivers for the Las Vegas housing market and economy?
Jobs
- Everywhere you look in Las Vegas, there is help wanted signs and job fairs. There are plenty of jobs available.
- What about new jobs? Approximately $10B in new construction was completed and came online in the last 3 or 4 months, creating thousands of new jobs. There is also about $22B of construction underway and another $7B announced. These projects will create even more jobs. More jobs bring more people to Las Vegas, which creates more demand for housing.
Land Shortage
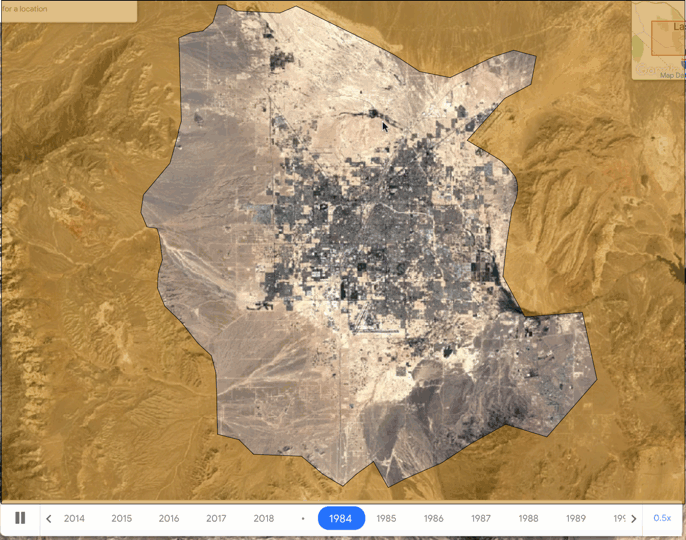
Las Vegas is an island surrounded by federal land. At the end of 2019, the amount of vacant buildable land in the Las Vegas Valley was less than 28,000 acres, of which 5,000 to 7,000 acres is not viable for residential development. (87.5% of Clark County is federally owned. 85% of the entire state is federally owned.) Consumption rate is about 5,000 acres/year. See the animated GIF below. The areas in brown are federal land. The time-lapse only goes through 2018, and there was a large amount of development in 2019, 2020, and 2021. The shortage of land combined with the increasing population almost guarantees property prices and rent will continue to increase.
California
California seems to be doing all it can to drive people and companies out of the state. And, with Newson surviving the recall, things look even better for Las Vegas. California can be relied upon to continue driving people and companies out of the state. The winner will be states like Nevada and Texas. However, Nevada has a huge advantage over Texas due to the nature of the business each is attracting.
- R&D is largely going to Austin. I've seen companies fire 10,000 engineers and programmers at one time. So, a downturn in R&D could seriously impact Austin property values.
- Infrastructure is largely coming to Las Vegas. For example, Google's 1.2B data center. I cannot envision a situation where Google decides to shutter such an investment and walk away. So, whether there is a downturn or not, jobs will remain and fairly well insulated from crashes due to the nature of the business Las Vegas attracts. This is especially true for the tenant pool we target.
What else attracts people and companies to Nevada and Las Vegas?
- Low commercial energy cost - California: $0.18/KwH, Nevada: $0.046/KwH. Also, Las Vegas is one of the few cities in the US with dual electric power sources, critical for servers and electricity-dependent industries like data centers and Internet switching.
- No state income tax
- Pro-business government
- Low property taxes - The average property tax rate is 0.55%. According to MortgageCalculator.org, Nevada has the 9th lowest property tax rate in the nation.
- Low-cost insurance - The cost of property insurance is a good indicator of major natural disaster risk probability. Nevada has the 10th lowest average insurance cost in the nation.
- Population growth - The population is growing at a very sustainable rate of about 2.5% to 3%.
- Internet backbone - The fiber optic bundle connecting Southern California to the East Coast runs under Las Vegas Boulevard. This is part of the reason Google is building a $1.2B data center here. Also, Google just announced that they will launch a "first-of-its-kind, next-generation" geothermal project in Las Vegas.
In summary, no one knows the future. But, until California becomes the go-to place for personal freedom, low crime rates, and low-cost business operations, Nevada and Las Vegas will continue to do well.
A home now and a rental property later
We deal with investment properties and have for the last 15 years. We've had several military clients do what you wish to do; buy a property to live in while you are in Las Vegas and then rent it as they rotate through various assignments. It is important that you buy a property that will be a good rental, not just a home that you will like. Please reach out if you would like more specifics.
Again, welcome to Las Vegas.
Post: Tips on Picking Your Market
- Realtor
- Las Vegas, NV
- Posts 809
- Votes 1,561
Hello Michael,
Rather than tell you "X" location is great, I will tell you how to select a good investment location.
The most important decision you will make is the location, not the property. As long as you buy a property in a "good" location, all but the worst mistakes will be corrected over time through appreciation and rent increases. However, if you do not buy in a "good" location, you can do nothing to turn things around after the fact. Fortunately, selecting a "good" location is relatively easy if you use the right metrics.
- Rent and Price Growth Rate - Inflation is constantly eroding buying power; each year, it costs more to buy the same set of goods and services. If you buy in a location where prices and rents rise faster than the inflation rate, your buying power will increase due to the increased rents. If you buy in a location where prices and rents are increasing below the inflation rate, your only option will be to decrease your standard of living over time. Also, do not rely on the rapid increases resulting from COVID; these increases are not sustainable. Evaluate locations based on the ten years preceding the COVID times compared to the current inflation rate (>5%).
- Population Size - Greater than 1 million. Small towns rely too much on a single business or market segment.
- Population Growth - If people are moving into a location, many things have to be right, including jobs and the cost of doing business. Do not invest in any location where the population is stagnant or declining.
- Crime - People and companies will not move to locations perceived as dangerous. One source of cities to avoid is Neighborhood Scout's 100 most dangerous cities.
- Disaster Risk - Some parts of the country suffer frequent natural disasters. The best indicator for natural disaster probability is the cost of homeowners insurance. Avoid states with high insurance rates. Note, even if insurance pays for all the damage your property suffers, you still lose. When a significant disaster occurs, people and jobs move to locations where they can make money today. The location may take years to recover, or it may never recover. ValuePenguin is a good source for the relative cost of insurance by state.
Investment Team
After location, the most important success factor is finding and working with a good investment team. If you needed surgery, you would not start medical school. Also, not just any doctor will do. You want a surgeon that specializes in the kind of surgery you need, not a general practitioner. The same is true with real estate investing. You want to work with an investment team that already has the skills and a proven track record of finding, qualifying, renovating, and managing properties. A good investment team will minimize your risk and save you time and money. If you try to do everything yourself, it will cost you more, and the odds of success are much lower. The place to start is with an investment Realtor, not an investment "friendly" realtor. Below are the skills and experience an investment Realtor and their team members provide at no cost to you.
However, it may be hard to find an investment Realtor. Even in a large metro area, there is likely only one or at most two investment Realtors. While finding an investment Realtor may take time, the cost, risk, and time savings will be worth it.
Michael, I hope this helps.
Post: Should I focus on finding my first investment out of state?
- Realtor
- Las Vegas, NV
- Posts 809
- Votes 1,561
Hello Kenneth,
I moved from New Jersey to Las Vegas. I know how expensive real estate is in NJ and how high the taxes and insurance are, plus the anti-landlord nature of NJ. If you want to make money, NJ is probably not the place to buy.
The most important decision you will make is the location, not the property. As long as you buy a property in a "good" location, all but the worst mistakes will be corrected over time through appreciation and rent increases. However, if you do not buy in a "good" location, you can do nothing to turn things around after the fact. Fortunately, selecting a "good" location is relatively easy if you use the right metrics.
- Rent and Price Growth Rate - Inflation is constantly eroding buying power; each year, it costs more to buy the same set of goods and services. If you buy in a location where prices and rents rise faster than the inflation rate, your buying power will increase due to the increased rents. If you buy in a location where prices and rents are increasing below the inflation rate, your only option will be to decrease your standard of living over time. Also, do not rely on the rapid increases resulting from COVID; these increases are not sustainable. Evaluate locations based on the ten years preceding the COVID times compared to the current inflation rate (>5%).
- Population Size - Greater than 1 million. Small towns rely too much on a single business or market segment.
- Population Growth - If people are moving into a location, many things have to be right, including jobs and the cost of doing business. Do not invest in any location where the population is stagnant or declining.
- Crime - People and companies will not move to locations perceived as dangerous. One source of cities to avoid is Neighborhood Scout's 100 most dangerous cities.
- Disaster Risk - Some parts of the country suffer frequent natural disasters. The best indicator for natural disaster probability is the cost of homeowners insurance. Avoid states with high insurance rates. Note, even if insurance pays for all the damage your property suffers, you still lose. When a significant disaster occurs, people and jobs move to locations where they can make money today. The location may take years to recover, or it may never recover. ValuePenguin is a good source for the relative cost of insurance by state.
Investment Team
After location, the most important success factor is finding and working with a good investment team. If you needed surgery, you would not start medical school. Also, not just any doctor will do. You want a surgeon that specializes in the kind of surgery you need, not a general practitioner. The same is true with real estate investing. You want to work with an investment team that already has the skills and a proven track record of finding, qualifying, renovating, and managing properties. A good investment team will minimize your risk and save you time and money. If you try to do everything yourself, it will cost you more, and the odds of success are much lower. The place to start is with an investment Realtor, not an investment "friendly" realtor. Below are the skills and experience an investment Realtor and their team members provide at no cost to you.
However, it may be hard to find an investment Realtor. Even in a large metro area, there is likely only one or at most two investment Realtors. While finding an investment Realtor may take time, the cost, risk, and time savings will be worth it.
Tenant Pool
The only way to consistently make money is to keep the property occupied by what I call a "good" tenant. A good tenant is someone who:
- Has stable employment in a market segment that is very likely to be stable or improve over time
- Has a credit history with which you can evaluate the likelihood that they will perform
- Pays all the rent on schedule
- Takes care of the property
- Does not cause problems with neighbors
- Does not engage in illegal activities while on the property
- Stays for many years
Good tenants are the exception, not the norm. Good tenants are the result of:
- Targeting the right tenant pool.
- Selecting properties that your target tenant pool is willing and able to rent.
- A skilled property manager.
How do you select a good tenant pool? Your investment team is your first stop. In addition, I would interview multiple property managers. I believe that the best tenant pool will be obvious once you go through the interviewing process.
Properties
The next step is selecting good properties. You now have all the information you need to select good properties. Your investment team will find and analyze properties and provide actionable analytics, not MLS sheets. MLS sheets contain little value to an investor. They will also provide renovation estimates and the other information you will need in your evaluation.
Summary
Kenneth, if you follow the process outlined above, your odds of constantly buying properties that provide a highly reliable long-term income stream are excellent.
Post: do you guys use home warranty on Rental property along with PM?
- Realtor
- Las Vegas, NV
- Posts 809
- Votes 1,561
Hello Sam,
You have had a rough go of it. I am sorry. Based on what you said, a 1031 exchange or simply selling the properties may be your best option. What you describe is not dissimilar to what other C Class property owners have expressed to me. Frequently, C Class properties look great on paper, but the reality does not match up. For example, a client asked me to evaluate a 4-plex. On paper, it looked like an 11% to 12% return.
Once I interviewed all the tenants, I discovered that the average tenant stay in the entire complex was about 9 months. And, we could count on two or more evictions a year. Even worse, there was a huge amount of deferred maintenance (>$80,000). The rent was about $850/Mo./unit. Based on what I determined during due diligence:
- The annual vacancy cost was >$3,500/Yr.
- Maintenance was >$300/Mo. or $3,600/Yr.
- The cost to make each of the units livable was about $15,000 each.
- There was no way to raise the rent even if the units were beautiful. This property is located in a high-crime area, and anyone who could pay more for rent would not live in this area.
- Despite looking great on paper, there was no way to turn a profit.
Sam, reach out to me directly via email, and maybe I can help.
Post: Alabama, Georgia, Tennessee, Kansas, Nevada - looking to network
- Realtor
- Las Vegas, NV
- Posts 809
- Votes 1,561
Hello Dennis,
We are in Las Vegas and below are performance charts for the property segment we target.
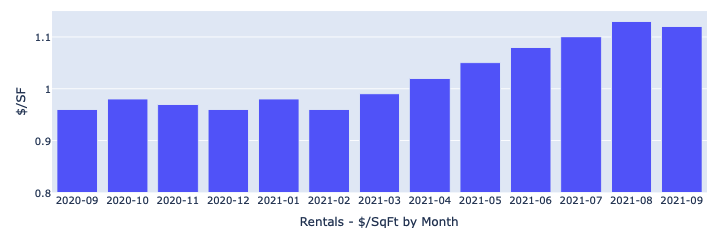
Rentals - Median $/SF by MonthYoY rent growth: 18%!
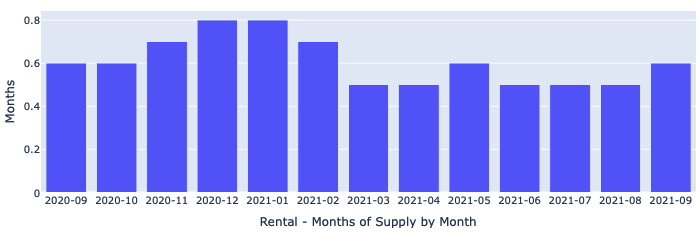
Rentals - Months of Supply
Three to four months is normal at this time of year. We are currently at about 0.6 months.
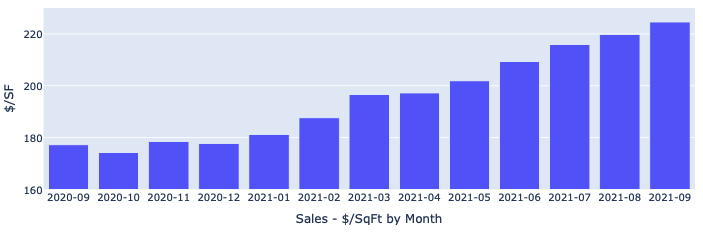
Sales - Median $/SF by Month
YoY appreciation: 28%!
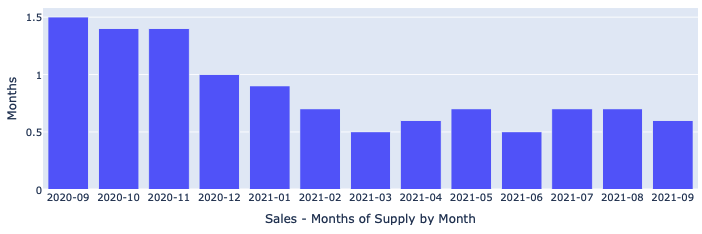
Sales - Months of Supply
6 months supply is considered a balanced market. We are at 0.6 months.
What is driving housing demand in Las Vegas?
- Jobs - Everywhere you look in Las Vegas there are help wanted signs. The shortage of labor is driving up income and attracting people from other states. Currently we have $22B in new projects under development with another $7B announced. The large number of good paying jobs and the relatively low cost of living is attracting a lot of people to Las Vegas.
- Limited Supply of Buildable Land - Las Vegas is an island surrounded by federal land. At the end of 2019, the amount of vacant buildable land in the Las Vegas Valley was less than 28,000 acres, of which 5,000 to 7,000 acres is not viable for residential development. (87.5% of Clark County is federally owned. 85% of the entire state is federally owned.) Consumption rate is about 5,000 acres/year. See the animated GIF below. The areas in brown are federal land. The time-lapse only goes through 2018 and there was a large amount of development in 2019 and 2020. The shortage of land combined with the increasing population almost guarantees property prices and rent will continue to increase.
- California - California's government seems committed to driving people and companies out the state. Las Vegas continues to receive a part of this exodus. Las Vegas is very attractive to people and companies because of the following:
- Pro-business government
- Low property taxes - The average property tax rate is 0.55%. According to MortgageCalculator.org, Nevada has the 9th lowest property tax rate in the nation.
- Low cost insurance - The cost of property insurance is a good indicator of the risk of a major natural disaster. Nevada has the 10th lowest average insurance cost in the nation.
I can provide more specifics, but I believe the above should give you an idea as to what is happening in the Las Vegas investment market. There are other factors that make Las Vegas attractive to investors:
- Landlord friendly - Time and cost to evict a nonperforming tenant: less than 30 days and $500. Also, the laws allow lease agreements to place much of the cost for damages on the tenant. Plus, the ability to deduct any damage beyond reasonable wear and tear from the tenant's security deposit. The lease agreement terms are the major reason why our target properties' average tenant turn cost is under $500.
- Low property taxes - The average property tax rate is 0.55%. According to MortgageCalculator.org, Nevada has the 9th lowest property tax rate in the nation.
- Low cost insurance - The cost of property insurance is a good indicator of the risk of a major natural disaster. Nevada has the 10th lowest average insurance cost in the nation.
- No state income tax - Pro business government and low cost of operations.
- Low maintenance cost - Las Vegas properties have low maintenance costs due to the construction materials required by the Mojave Desert climate.
In summary, Las Vegas is performing well and likely to do so well into the foreseeable future.
You asked about property management, renovation, and maintenance. We have an investment team and provide all the services you mentioned and more.
Ping me if you have questions.
Post: What should I buy next with my current finances.
- Realtor
- Las Vegas, NV
- Posts 809
- Votes 1,561
The type of property you buy is not important. What matters is selecting properties that best enable you to meet your goals. Below is the process I would follow to grow a reliable, inflation advantaged, long-term income stream.
Location Selection
Location is the most important decision you will make, not the property. As long as you buy in a good location, all but the worst mistakes will be corrected over time through rent increases and appreciation. However, if you don't invest in a good location, you can do little to turn things around. So, you have to make the right location decision.
Fortunately, there are a few indicators that make selecting a good location easier than you might imagine. The most important of them all is the rate of appreciation.
- Appreciation - The number one criteria in location selection is appreciation. Inflation is constantly eroding buying power; each year, it costs more to buy the same set of goods. If you buy in a location where prices and rents are rising faster than the inflation rate, you will be able to buy the same set of goods because you will have the additional dollars you need from increased rents. If you buy in a location where prices and rents are increasing below the inflation rate, your only option will be to decrease your standard of living over time. If you are interested, I can post an article showing why appreciation is the fastest way to grow your portfolio and cash flow.
- Population Size - Greater than 1 million. Small towns may rely too much on a single business or market segment.
- Population Growth - If people are moving into a location, many things have to be right, including jobs and the cost of doing business. I would not invest in any location where the population is stagnant or declining.
- Crime - People and companies will not move to locations perceived as dangerous. One source of cities to avoid is Neighborhood Scout's 100 most dangerous cities.
- Disaster Risk - Some parts of the country are more prone to natural disasters. The best indicator for natural disaster probability is homeowners insurance cost. I would avoid states with high insurance rates. Note, even if insurance pays for all the damage your property suffers, you still lose. When a significant disaster occurs, people and jobs move to locations where they can make money today. The location may take years to recover, or it may never recover. ValuePenguin is a good source for the relative cost of insurance by state.
Investment Team
If you needed surgery, you would not start medical school. Also, not just any doctor will do. You want a surgeon that specializes in the kind of surgery you need, not a general surgeon. The same is true with real estate investing. You want to work with an investment team that already has the skills. The place to start is with an investment Realtor. Know that even in a large metro area, there is likely only one or at most two investment Realtors. So, an investment Realtor will likely be hard to find. Below are the skills an investment Realtor provides directly and indirectly through team members. While finding an investment Realtor may take time, the cost, risk, and time savings will be worth it.
Tenant Pool
The only way to consistently make money is to keep the property occupied by what I call a good tenant. A good tenant is someone who:
- Has stable employment in a market segment that is very likely to be stable or improve over time
- Has a credit history with which you can evaluate the likelihood that they will perform
- Pays all the rent on schedule
- Takes care of the property
- Does not cause problems with neighbors
- Does not engage in illegal activities while on the property
- Stays for many years
Good tenants are the exception, not the norm. Good tenants are the result of:
- Targeting the right tenant pool
- Selecting property properties that attract your target tenant pool
- A skilled property manager
How do you determine the right tenant pool that will support your financial goals? Your investment team is your first stop. In addition, I would interview multiple property managers. I believe that the best tenant pool will be obvious once you go through the interviewing process.
Properties
Your investment team will help you to define the property characteristics that will attract your target tenant pool. They should also provide the analytics you will need to make an informed decision, not MLS sheets. MLS sheets have little value to an investor.
In Conclusion
If you follow the location > investment team > tenant pool > property path, you will be on the right track and should do well.
Post: Multifamily vs Single Family?
- Realtor
- Las Vegas, NV
- Posts 809
- Votes 1,561
The type of property you buy is not important. What matters is selecting properties that best enable you to meet your goals. For rent rest of this post, I will assume your goal is to augment your current income or to replace your current income over time. In either case, you are looking at long-term performance, not initial ROI.
If this is the case, select properties that best meet the following:
- Appreciation - Prices and rents are increasing faster than the inflation rate. If not, your buying power is guaranteed to decline over time due to inflation. Evaluate appreciation based on the 10 years preceding COVID; the high COVID appreciation rates are likely to be short-lived in most locations.
- Targets the right tenant pool segment - Every property attracts a fairly narrow segment of the total tenant pool population. Determine which tenant pool segment has the highest concentration of "good" tenants and only buy properties that will attract this segment. I define a good tenant as someone who:
- Has stable employment in a market segment that is very likely to be stable or improve over time.
- Does not engage in illegal activities while on the property
- Does not cause problems with neighbors
- Pays all the rent on schedule
- Takes care of the property
- Stays for many years
- Low vacancy costs - Vacancy costs can turn what appears to be a profitable property into a money pit. Vacancy cost is a function of the tenant pool, carrying costs, time to rent, property manager skill, construction and renovation materials, lease agreement terms, and local regulations governing tenants. For example, below are typical annual vacancy cost estimates for the three major Las Vegas tenant pool segments
- Transient: $3,200/Yr
- Permanent: $400/Yr
- Transitional: $3,500/Yr
- Low maintenance cost - The only way to keep maintenance costs low is to not buy properties that need a lot of maintenance. Maintenance cost is a function of property condition, age, climate, construction and renovation materials, tenant pool, and property manager skill.
If you base your property selection on the above, you will make the best decisions. Do not make selections based on dogma or what others say. You are the person who will live with your decision for many years.