All Forum Categories
Market News & Data
General Info
Real Estate Strategies

Landlording & Rental Properties
Real Estate Professionals
Financial, Tax, & Legal


Real Estate Classifieds
All Forum Posts by: Eric Fernwood
Eric Fernwood has started 58 posts and replied 714 times.
 Post: Las Vegas Bound! Neighborhoods?!
- Realtor
- Las Vegas, NV
- Posts 743
- Votes 1,510
Hello @Da'Mario Hughley,
As @Michael Robbins said, it depends on your investment goals. I will share ours so you can use it as a starting point for what you are seeking.
I believe every investment property must meet the following three criteria.
- Sustained profitability - The property must generate a positive cash flow today and into the foreseeable future, in good times and bad.
- Appreciating - Appreciating at or above the inflation rate. The properties we target had a YOY increase in rent of 14.3% and appreciated 18% (May 2021).
- Low Operating Cost - In a location where operating costs are low and regulations favor investors.
When I first moved to Las Vegas (about 16 years ago), I did a lot of research concerning tenant pools. I started with defining the characteristics of what I call a "good" tenant. Next, I researched which tenant pool segment had the highest concentration of good tenants. I then translated this tenant pool's needs and wants into physical property characteristics. These are the properties we target. Below is a high-level view of what I learned about the three major tenant segments.
Tenant Pool Segments
While segment generalizations may not apply to any specific individual, generalizations are useful when evaluating segments because most members share common behaviors. As an example, I will focus on the frequency of tenant turns by tenant pool segment.
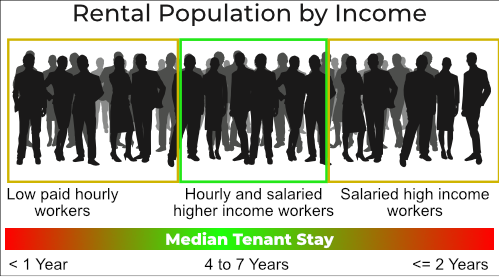
In my research, I've found that tenant stay has a strong correlation with income, as shown below.
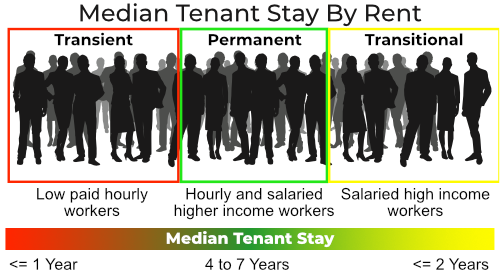
Comments on the three tenant pool segments:
- Transient - This tenant pool is primarily low-skilled hourly workers making little more than minimum wage. The typical renovation cost per turn is $1,500. The average tenant stay is one year. The average rent is $850/Mo. The average time to rent is eight weeks. When you hear about tenants not paying the rent due to Covid, this is the tenant pool they are talking about.
- Permanent - This tenant pool could be hourly or salaried, but they earn well above minimum wage. The typical renovation cost per turn is $500. The average tenant stay is five years. Typical rent $1,500/Mo. Typical time to rent, two to four weeks. This is the tenant pool that we target.
- Transitional - This tenant pool has a high enough income that they are typically home buyers. They typically only rent if there is a major negative event in their lives. For example, a divorce, the death of a spouse, etc. Once they sort out the problem, they will buy a home. The typical tenant stay is two years. The typical renovation cost per turn is $2,000. Typical rent $2,500/Mo. The typical time to rent is eight weeks.
How has the "Permanent" tenant pool performed for us?
- Average tenant stay: 5 years
- Number of evictions in the last 16 years: 5
- Average turn cost: <$500
- 2008 crash performance: zero decrease in rent, zero vacancies
- COVID performance: Out of >200 properties, 5 tenants had trouble paying and moved out.
Properties That Attract Our Target Tenant Pool
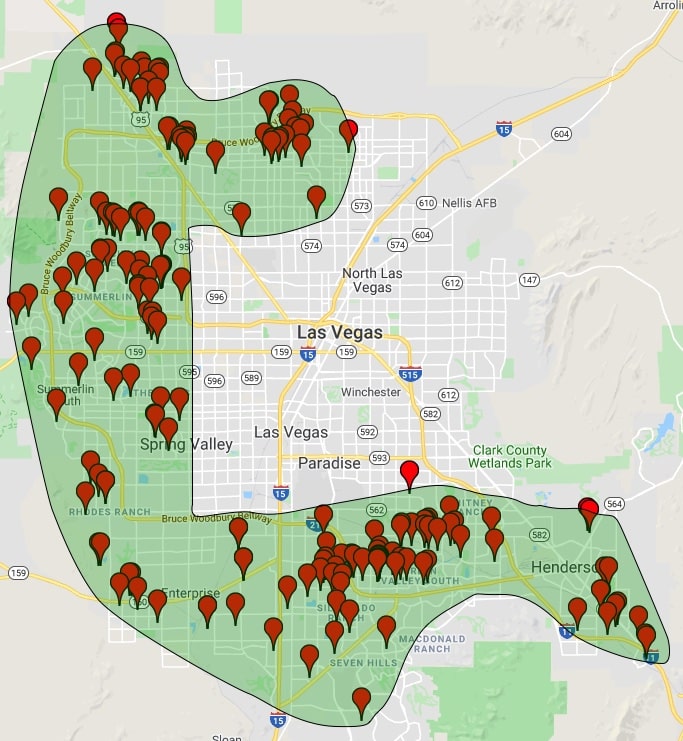
The majority of our properties are single-family and a select set of townhomes. We've investigated condos in the past, but they have multiple limitations, including an average tenant stay of about two years, financing restrictions, and the high HOA fees limit profitability. Below is a map showing the areas in which we find most of the properties (green) and the location of some of our client's properties. Note that while the green area appears homogeneous, in actuality, it looks more like Swiss cheese.
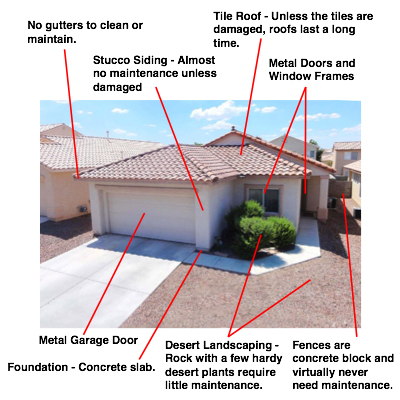
Many new clients ask about condos because they have concerns about high maintenance costs. Due to the properties we target, construction, and our process for selecting properties, our average maintenance cost is between $300 and $400 per year, plus an occasional water heater or AC compressor replacement. This is similar to maintenance costs for condos. Below is a typical property that we target. As you can see, there is not a lot to maintain.
Some thoughts for your consideration:
- Select your target tenant pool first and then buy properties that this tenant pool is willing and able to rent.
- Find a good investment team. If you would like information on selecting an investment Realtor, let me know, and I will post it.
- I would not pre-judge the type of property to buy. I would buy properties that generate the highest net return today and continue to do so into the foreseeable future.
Post: Best Investment in Las Vegas?
- Realtor
- Las Vegas, NV
- Posts 743
- Votes 1,510
Hello @Aj,
Since I do not know your investment goals, below are the characteristics that I feel represent the best types of investments.
- Sustained profitability: The property must generate a positive cash flow today and into the foreseeable future, in good times and bad.
- Appreciating: The price and rent must increase at a rate above the rate of inflation.
- Low Operating Cost: In a location where operating costs are low, and regulations favor investors.
Notice that my goals do not specify a type of property because the property type does not matter. What matters is that you consistently make money. To make money, the property must remain occupied by a tenant who pays all the rent on schedule and takes care of the property. So the real challenge is selecting the right tenant pool. Below is the process I followed when I first moved to Las Vegas.
After some consideration, I determined that the most important tenant pool characteristic for making money is that the tenant stays in the property for many years. I did a study and discovered a strong correlation between the monthly rent and the length of tenant stay, as shown below.

- Comments on the three tenant pool segments
- Transient - This tenant pool is primarily low-skilled hourly workers making little more than minimum wage. The typical renovation cost per turn is $1,500. The average tenant stay is one year. Typical rent is about $850/Mo. and the typical time to rent, eight weeks.
- Permanent - This tenant pool could be hourly or salaried, but they earn well above minimum wage. The typical renovation cost per turn is $500. The average tenant stay is five years. Typical rent $1,500/Mo. Typical time to rent, two to three weeks.
- Transitional - This tenant pool has a high enough income that they are typically home buyers. They typically only rent if there is a major negative event in their lives. For example, divorce, death of a spouse, etc. Once they sort out the problem, they buy a home. The typical tenant stay is two years. The typical renovation cost per turn is about $2,000. The average tenant stay is two years. Typical rent $2,500/Mo. Typical time to rent, eight weeks.
Next, I determined the approximate annual cost of vacancy for each of the three segments. The turn cost is the sum of the renovation cost and carrying cost. Carrying cost is dependent on time to rent, financing, taxes, insurance, and other property-specific costs. To keep this example reasonable, I will only look at lost income. To calculate an annual estimated cost, I will evaluate over ten years. To keep things simple, I will ignore inflation, probable rent increases, and similar variables. Below are the turn costs for each segment based on the above assumptions.

If I multiply Total Turn Cost by the 10 year turn frequency, I get the following:
- Transient: 10 turns x 3,200 = 32,000 or 3,200/Yr
- Permanent: 2 turns x 2,000 = 4,000 or 400/Yr
- Transitional: 5 turns x 7000 = 35,000 or 3,500/Yr
Below I normalized annual turn cost to show how much more annual cash flow the Transient and Transitional segment must generate above the Permanent segment to have the same annual net cash flow.
- Transient segment: +$2,800 per year more than Permanent.
- Transitional segment: +$3,100 per year more than Permanent.
Based on the above calculations and research concerning cash flow and tenant turn rate from properties that target the three tenant pool segments, I determined that the highest net cash flow (for the same amount of capital invested) is from the Permanent segment.
Once we identified our target segment (the Permanent segment), the next task was to determine three important segment characteristics: rent range, needs, and location. Once we understood these, we translated them into four property characteristics: type, configuration, location, and rent range. Below is a description of each of the four characteristics.
- Type: Condo, high rise, single-family, etc.
- Configuration: For example, 2,000SF, two bedrooms, three-car garage, large back yard, single-story, two stories, etc.
- Location - Where the target tenant pool wants to live.
- Rent range - The rent must be within the target tenant pool's acceptable rent range and generate a sufficient ROI and cash flow.
I determined that the vast majority of this tenant pool rents single-family homes and a narrow selection of townhomes. The overall process is illustrated below.

How has this pool performed for our clients over the last 15 years?
- Average stay is five years.
- Average turn cost is less than $500 (The landlord friendly regulations in Nevada help.)
- During normal times, the time to rent is 2 to 3 weeks. Today, most rent in less than one week.
- During the 2008 crash, zero decrease in rent and zero vacancies. During Covid, out of about 230 properties, five tenants moved out because they could not pay the rent.
- Five evictions in 15 years.
- The average annual maintenance cost is between $300 and $400, excluding the occasional water heater or air compressor.
Below is a map showing where some of our client's properties are located and the green area is where we find the most conforming properties. Note that while the green area looks homogeneous, it is more like Swiss cheese.

Bear in mind though, that conforming properties represent only about 0.4% of all available properties on the MLS. And they do not stay on the market long especially in today's market. We are only able to find the 5 to 10 properties we need each month for clients due to our data mining software and related processes.
In Conclusion
In order to determine the best investment property type in a particular market, you first need to determine which tenant pool to target in order to achieve your investment goals. From there, you can determine a property profile that attracts your target tenant pool.
Aj, I have some recommendations.
- C class and most B class and multi-family properties in Las Vegas are poor investments because of the tenant turn cost; actual returns are much lower than paper return. Also, B and C class properties tend to be older and require more maintenance and renovation.
- Conforming single-family and select townhomes are the best performers today and have been for the last 15 years. I recently ran our monthly statistics on conforming properties. YoY rent increased by 15.7%. YoY prices rose by 16%. If you would like this data, let me know and I will post it.
- The number of skills and knowledge required to find such properties, renovate them, and monetize them is more than any individual can do. I've been doing this for many years, and I would never consider doing this on my own. My recommendation is to find a good investment team. I would start by finding an investment Realtor. Investment Realtor's have little similarity to residential Realtor's. Investment Realtors sell income streams while residential Realtors sell homes. If you'd like information on selecting an investment Realtor, let me know, and I will post that information on this thread.
Aj, I hope the above will help you find an investment property that will meet your goals. I wish you success.
Post: Found a property in LV but worried about peak
- Realtor
- Las Vegas, NV
- Posts 743
- Votes 1,510
Hello @Matt Huneycutt and @Bill B.,
Thanks for the tag.
What We Are Seeing
Las Vegas is an island surrounded by federally owned land. There is little land for expansion, a growing job market, and an influx of people. Unless there is another "COVID Event", prices and rents will continue to increase at a rapid rate through 2021 and beyond. Unless California suddenly turns business and people-friendly, Las Vegas will have a long run of prosperity. Some specifics.
- Prices rose 15.4% YoY in March 2021 (for the segment that we target. See charts below.), with median days on the market at 5. Properties that we target are typically going under contract in 1-2 days.
- Rents rose 8.7% in March 2021 YoY with median days on the market at around 8. The average time on the market for most of our client's rentals is under seven days.
- Both the sales and rental market have extremely low inventory (less than half a month).
- We regularly close properties with a cash-on-cash return between 4% and 6% (6 last month), so good properties are available.
- The average tenant stay (for ours and our clients' properties) is about five years, with an average turnover cost of about $500.
- COVID - To date, out of the 190+ client properties we track (out of a total of > 220 properties), at some point during the last twelve months, ten tenants have had trouble paying the full rent on schedule. A relatively small percentage of the total. I expect most of these tenants will catch up on their rent. For example, one of the tenants paid close to $9,000 to bring their rent current. Paying $9,000 to catch up on the rent is a lot more expensive than moving. However, moving is not the issue; bad credit report is their fear. A negative hit on their credit will dog them for years. Plus, even if they wanted to move, no property manager would rent an A Class property to anyone with any black mark on their credit. So, eviction moratorium or not, credit risk is the primary control factor for our tenant pool. We've only had five evictions in the last 15+ years.
- For Class C and Class B properties, it is a very different story. The landlords I talked to have a lot of tenants who have not paid the rent in months. The tenant pool for C and most B Class properties are lower-paid, lower-skilled workers. These are the first to be laid off during economic stress and the last to be rehired. This is one reason we do not recommend Class C and rarely B Class.
Supporting Information
First, the statistics.
The information below only concerns the narrow property profile/tenant pool we target. No data for any other property type is included. The typical property we target has the following characteristics:
- Single family
- Sale price < $400,000
- Bedrooms: 3 to 4
- Garage: 2 to 3
- Stories: 1 or 2
- Note that while the green area appears homogeneous, in actuality it is more like Swiss cheese.

Below you will find the statistics we generate each month.
Rental Statistics
Rentals - Median $/SF by Month
Median rental rates reached $1/SF in March, representing a 8.7% increase YoY. A phenomenal growth for rental rates.

Rentals - List to Contract Days by Month
There is very little rental inventory and what is available goes under contract in days.

Rentals - Availability by Month
This chart shows the average daily number of properties that were for rent in a particular month. As you can see, we are at about 40% of the level a year ago.

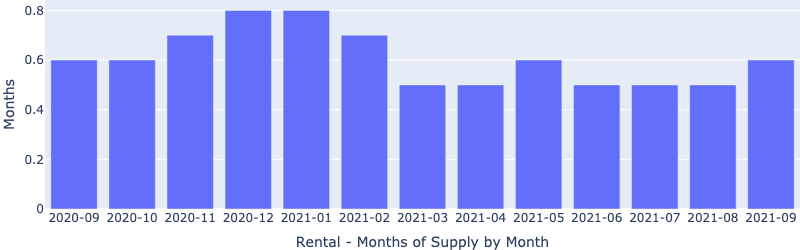
Rentals - Months of Supply
2 to 3 months is typical. Today we are at just 0.5 month of supply!
Sales Statistics
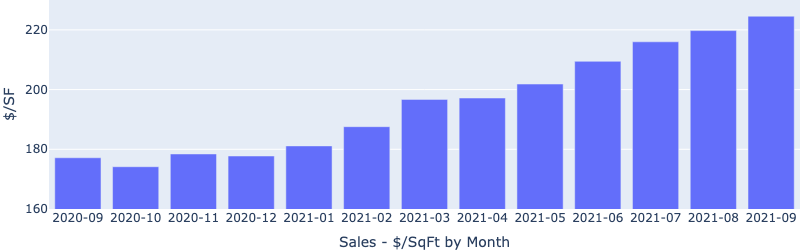
Median $/SF by Month
Prices have risen rapidly since February 2021 and March 2021 saw an amazing increase of 15.4% YoY!
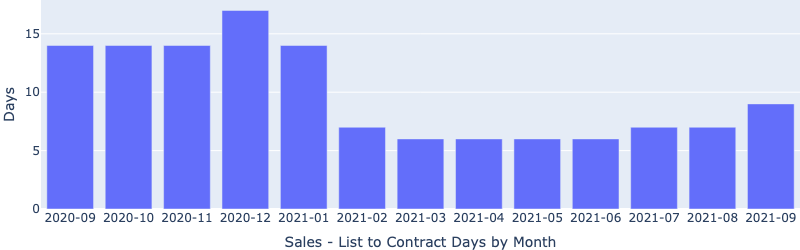
Sales - List to Contract Days by Month
Accompanying the rapid price increase is the unprecedented low days on the market. Properties that we target are typically going under contract in 1-2 days.
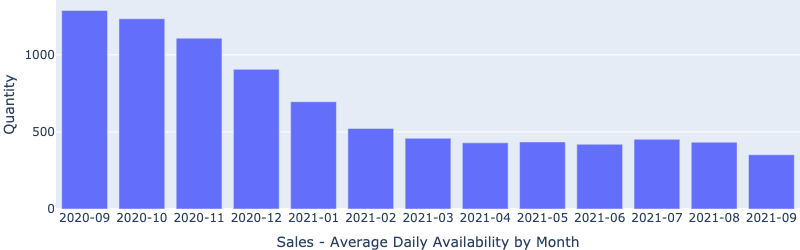
Sales - Availability by Month
We are at less than 1/3 of the level a year ago just before the COVID hit.
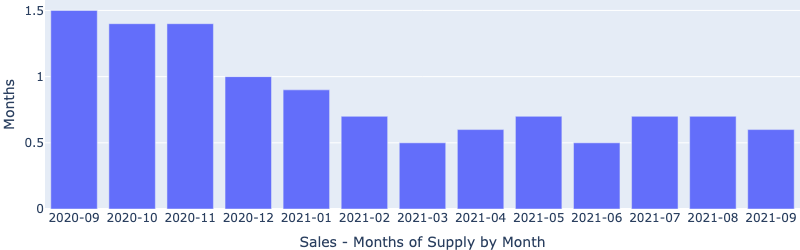
Sales - Months of Supply
Six months supply is considered a balanced market. In March there was approximately 1/3 of one month!
Other Items of Interest
- Google Data Center - Google is in the process of building a $600M data center in Henderson. They also announced that they will add a second $600M data center on the same site. Las Vegas will be one of 11 data centers worldwide. Even though they will not employ many people (100 to 150 employees at an average salary of $65,000), the presence of Google is huge. I believe that where Google goes, others will follow. And, it will be infrastructure, which is what I want for Las Vegas. I've seen companies lay off thousands of engineers and programmers at a time, but no one walks away from infrastructure.
- announced three more centers in Las Vegas. Of special interest are two facilities: Merch by Amazon and Print on Demand. "Merch by Amazon allows brands and independent artists to create custom-printed apparel and electronics products. Print on Demand helps authors and publishers with on-demand publishing, helping to reduce upfront costs of printing for inventory." Amazon selecting Las Vegas for this type of infrastructure will bring others to Las Vegas as well.
The hospitality industry is still expanding:
- Virgin Hotels just opened a new hotel/casino.
- The First Atari Hotel Looks Like a Gamer's Fantasy — and It’s Opening in Las Vegas
- The Boring Company plans to expand the existing underground transit system in Las Vegas.
- Resorts World, a $7B hotel/casino is opening summer 2021.
- The convention business is starting to rebound. At least one convention, 2021 World of Concrete, is schedule for June 2021.
- Las Vegas was the second fastest-growing city in the US for 2020 - according to Updater. "Most people migrated [to Las Vegas] from cities like San Fransisco, Los Angeles, and Sacramento, Updater said."
- California fuels Las Vegas growth - As California continues to make the state less desirable for both individuals and businesses, many are leaving the state. Leaving California has actually become a significant business. A portion of these companies and people will choose Las Vegas. Hopefully, the number of people moving to Las Vegas will not become the torrent that Boise is attempting to deal with.
- Zillow is predicting a +10% increase in Las Vegas housing prices in 2021. Interestingly, in the summer of 2020 they predicted a 7% decrease for 2021.
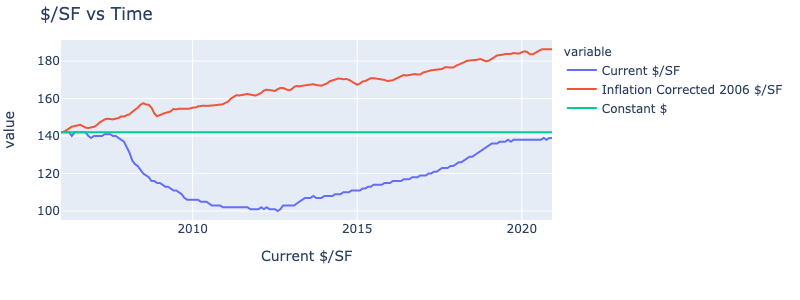
- Housing prices for Las Vegas are still well below 2006 peak prices. See the chart below. If you ignore inflation, prices have almost reached the 2006/2007 peak. However, inflation is real and must be considered. $143/SF in 2008 dollars is the same as $174/SF in 2020 dollars so there is still a long way to go.

- Land shortage - The available land for development continues to dwindle. At the end of 2019, the amount of vacant buildable land in the Las Vegas Valley was less than 28,000 acres, of which 5,000 to 7,000 acres is not viable for residential development. (87.5% of Clark County is federally owned. 85% of the entire state is federally owned.) Consumption rate is about 5,000 acres/year. See the animated GIF below. The areas in brown are federal land. The time-lapse only goes through 2018 and there was a large amount of development in 2019 and 2020. The southwest part of the city is now the least developed and construction in the area is relentless. For example, the $400M Uncommons has broken ground - a $400M complex in southwest Las Vegas.
Las Vegas is and will continue to be a great place to invest for buy and hold investors.
Post: Las Vegas????
- Realtor
- Las Vegas, NV
- Posts 743
- Votes 1,510
Hello @Daniel Cisneros,
Thanks for the tag.
What We Are Seeing
Las Vegas is an island surrounded by federally owned land. There is little land for expansion, a growing job market, and an influx of people. Unless there is another "COVID Event", prices and rents will continue to increase at a rapid rate through 2021 and beyond. Unless California suddenly turns business and people-friendly, Las Vegas will have a long run of prosperity. Some specifics.
- Prices rose 15.4% YoY in March 2021 (for the segment that we target. See charts below.), with median days on the market at 5. Properties that we target are typically going under contract in 1-2 days.
- Rents rose 8.7% in March 2021 YoY with median days on the market at around 8. The average time on the market for most of our client's rentals is under seven days.
- Both the sales and rental market have extremely low inventory (less than half a month).
- We regularly close properties with a cash-on-cash return between 4% and 6% (6 last month), so good properties are available.
- The average tenant stay (for ours and our clients' properties) is about five years, with an average turnover cost of about $500.
- COVID - To date, out of the 190+ client properties we track (out of a total of > 220 properties), at some point during the last twelve months, ten tenants have had trouble paying the full rent on schedule. A relatively small percentage of the total. I expect most of these tenants will catch up on their rent. For example, one of the tenants paid close to $9,000 to bring their rent current. Paying $9,000 to catch up on the rent is a lot more expensive than moving. However, moving is not the issue; bad credit report is their fear. A negative hit on their credit will dog them for years. Plus, even if they wanted to move, no property manager would rent an A Class property to anyone with any black mark on their credit. So, eviction moratorium or not, credit risk is the primary control factor for our tenant pool. We've only had five evictions in the last 15+ years.
- For Class C and Class B properties, it is a very different story. The landlords I talked to have a lot of tenants who have not paid the rent in months. The tenant pool for C and most B Class properties are lower-paid, lower-skilled workers. These are the first to be laid off during economic stress and the last to be rehired. This is one reason we do not recommend Class C and rarely B Class.
Supporting Information
First, the statistics.
The information below only concerns the narrow property profile/tenant pool we target. No data for any other property type is included. The typical property we target has the following characteristics:
- Single family
- Sale price < $400,000
- Bedrooms: 3 to 4
- Garage: 2 to 3
- Stories: 1 or 2
- Note that while the green area appears homogeneous, in actuality it is more like Swiss cheese.
Below you will find the statistics we generate each month.
Rental Statistics
Rentals - Median $/SF by Month
Median rental rates reached $1/SF in March, representing a 8.7% increase YoY. A phenomenal growth for rental rates.
Rentals - List to Contract Days by Month
There is very little rental inventory and what is available goes under contract in days.
Rentals - Availability by Month
This chart shows the average daily number of properties that were for rent in a particular month. As you can see, we are at about 40% of the level a year ago.
Rentals - Months of Supply
2 to 3 months is typical. Today we are at just 0.5 month of supply!
Sales Statistics
Median $/SF by Month
Prices have risen rapidly since February 2021 and March 2021 saw an amazing increase of 15.4% YoY!
Sales - List to Contract Days by Month
Accompanying the rapid price increase is the unprecedented low days on the market. Properties that we target are typically going under contract in 1-2 days.
Sales - Availability by Month
We are at less than 1/3 of the level a year ago just before the COVID hit.
Sales - Months of Supply
Six months supply is considered a balanced market. In March there was approximately 1/3 of one month!
Other Items of Interest
- Google Data Center - Google is in the process of building a $600M data center in Henderson. They also announced that they will add a second $600M data center on the same site. Las Vegas will be one of 11 data centers worldwide. Even though they will not employ many people (100 to 150 employees at an average salary of $65,000), the presence of Google is huge. I believe that where Google goes, others will follow. And, it will be infrastructure, which is what I want for Las Vegas. I've seen companies lay off thousands of engineers and programmers at a time, but no one walks away from infrastructure.
- announced three more centers in Las Vegas. Of special interest are two facilities: Merch by Amazon and Print on Demand. "Merch by Amazon allows brands and independent artists to create custom-printed apparel and electronics products. Print on Demand helps authors and publishers with on-demand publishing, helping to reduce upfront costs of printing for inventory." Amazon selecting Las Vegas for this type of infrastructure will bring others to Las Vegas as well.
The hospitality industry is still expanding:
- Virgin Hotels just opened a new hotel/casino.
- The First Atari Hotel Looks Like a Gamer's Fantasy — and It’s Opening in Las Vegas
- The Boring Company plans to expand the existing underground transit system in Las Vegas.
- Resorts World, a $7B hotel/casino is opening summer 2021.
- The convention business is starting to rebound. At least one convention, 2021 World of Concrete, is schedule for June 2021.
- Las Vegas was the second fastest-growing city in the US for 2020 - according to Updater. "Most people migrated [to Las Vegas] from cities like San Fransisco, Los Angeles, and Sacramento, Updater said."
- California fuels Las Vegas growth - As California continues to make the state less desirable for both individuals and businesses, many are leaving the state. Leaving California has actually become a significant business. A portion of these companies and people will choose Las Vegas. Hopefully, the number of people moving to Las Vegas will not become the torrent that Boise is attempting to deal with.
- Zillow is predicting a +10% increase in Las Vegas housing prices in 2021. Interestingly, in the summer of 2020 they predicted a 7% decrease for 2021.
- Housing prices for Las Vegas are still well below 2006 peak prices. See the chart below. If you ignore inflation, prices have almost reached the 2006/2007 peak. However, inflation is real and must be considered. $143/SF in 2008 dollars is the same as $174/SF in 2020 dollars so there is still a long way to go.
- Land shortage - The available land for development continues to dwindle. At the end of 2019, the amount of vacant buildable land in the Las Vegas Valley was less than 28,000 acres, of which 5,000 to 7,000 acres is not viable for residential development. (87.5% of Clark County is federally owned. 85% of the entire state is federally owned.) Consumption rate is about 5,000 acres/year. See the animated GIF below. The areas in brown are federal land. The time-lapse only goes through 2018 and there was a large amount of development in 2019 and 2020. The southwest part of the city is now the least developed and construction in the area is relentless. For example, the $400M Uncommons has broken ground - a $400M complex in southwest Las Vegas.
Las Vegas is and will continue to be a great place to invest for buy and hold investors.
Post: Looking to 1031 out of the California market
- Realtor
- Las Vegas, NV
- Posts 743
- Votes 1,510
Hello @Jason W.
Instead of commenting on specific cities or investment strategies, I will describe the process I would use to select an investment location.
So we have a common understanding, I believe every investment property must meet three criteria:
- Sustained profitability - The property must generate a positive cash flow today and into the foreseeable future, in good times and bad.
- Appreciation - The location must be appreciating at or above the inflation rate.
- Investor friendly - The cost of doing business and local regulations and taxes must favor investors.
I will explore each of the three criteria below but first, a comment on selecting properties based on ROI.
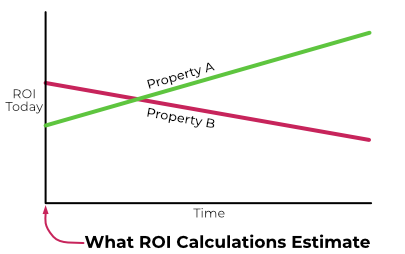
ROI is Only a Snapshot in Time
If you anticipate holding the property for many years, what is happening long-term is more important than what is happening today. ROI, and other such metrics, estimate how the property is likely to perform on day one of a lifetime hold. ROI tells you nothing about how the property is likely to perform in the future. See the chart below.
Today, Property A and Property B have the same estimated ROI. However, in the future Property A is returning 8% while Property B is only returning 1%. Market direction is a critical factor in location selection.

Below is another example. Is property A or Property B a better investment? Even though Property B has a higher initial return, Property A is the clear winner over time.
Location Trend
How can you evaluate a location's trend? Determining market trends directly from statistical data would not be easy. However, there are "indicators" and basic metrics that can provide the location selection information you need. I listed a few below that you could use to narrow your search.
Population SizeI would only consider metro areas with a population of at least 1 million. You want a stable economic environment, and small towns may be too dependent on a single company or commodity.
AppreciationProperty prices increasing above the rate of inflation, is a strong indicator that people are moving into the location, new jobs are being created, and household income is rising. And, since rents lag property prices by 2 to 10 years, what is happening with property prices today indicates what will happen to rents in the future. I would not consider any location where appreciation is less than the (actual) rate of inflation.
Population GrowthIncreasing or decreasing population is a strong indicator of taxes, crime, cost of living, jobs, quality of life, and many other things. If the population is increasing, a lot of things in that location must be right, and prices and rents are likely to rise due to increasing demand. If the population is decreasing, prices and rents are likely to fall due to decreasing demand. Here is a list of metro population changes between 2010 and 2019.
Job Quality and QuantityAn investment property is no better than the jobs around it. Said another way, if your tenants are not working, they are not paying rent. When you consider jobs, there are two aspects: job quantity and job quality. The quantity of jobs is important but not sufficient; you must also consider the quality (pay rate, benefits, location, etc.). Also, it is not just the jobs the tenant pool has today. Most small businesses' life span is about ten years, and even S&P 500 companies only last on average about 18 years. So, most of the jobs your tenant pool has today will likely be gone within the next ten years. Unless new jobs are being created to replace the existing jobs that pay at similar levels and require similar skills, your tenant pool will either move away or take jobs at lower pay. If your tenant pool moves away or accepts lower-paying jobs, rents will fall accordingly. You need to consider the economic direction of the location. One of the best indicators I know for economic health is median household income growth. The St Louis Federal reserve site is my go-to place for such information.
CrimeWhile crime is everywhere, crimes occur in some locations much more frequently. Properties in cities with high rates of crime are unlikely to do well over time for three reasons. One, few people will move to a location perceived as a high crime area. Two, people who can afford to do so will move away from a high crime area. Three, jobs do not stay in high crime areas, so people move away to where the jobs are. NeighborhoodScout maintains a list of the 100 most dangerous cities in the US. I would be very hesitant to invest in any city on this list. High levels of crime and long-term growth do not go together.
Urban SprawlIn most cities, areas that were once the best place to live are now distressed. The pattern where people with higher incomes move to newer areas is commonly referred to as urban sprawl. The people who remain typically have lower incomes and cannot afford to move. As the median income of an area falls, property prices fall. Sales taxes and property taxes largely fund city services. If the tax base declines, city services decline and crime increases. As crime increases, the remaining population with sufficient income leave the area. Over time, the only jobs that remain are low-paid service sector jobs, which results in a spiral of declining prices and rents.
The easiest way to detect urban sprawl is to watch a time-lapse aerial view of the area. Below are a few examples.
- Memphis
- Atlanta
- Indianapolis
- Phoenix
- Las Vegas - Las Vegas is fairly unique in that it is surrounded by federal land and there is very little non-government land left for expansion. So, Las Vegas has almost no urban sprawl.
Cities subject to urban sprawl share some common characteristics, including:
- Existing home prices rise slowly or even decline (after adjusting for inflation).
- As the household income in older areas declines, prices and rents fall to match.
- Generally, home prices will be significantly lower than metro areas with expansion limitations.
Investor Friendly
You could buy what appears to be an outstanding property only to have operating costs eat all the cashflow. Below are a few factors to consider.
- High Taxes - People are fleeing high tax states like California, New York, New Jersey, and others. I would not invest in any of these states because their economies are declining.
- Property Insurance Cost - Property insurance rates are based on the probability of a natural disaster occurring in that state. The higher the cost of insurance, the higher the probability of a major disaster. The problem is not the cost of repairs, which can be covered by insurance. The problem is the loss of area jobs and population. People and businesses will leave a disaster area so they can resume a normal life. The likely result will be declining property values and rents. Value Penguin has an excellent comparison of insurance cost by state. I would not consider states with high insurance costs.
- Regulations - I talk to many people considering using a 1031 Exchange to move their investment to Las Vegas. The most common reasons for moving their investment include:
- Anti-investor regulations including rent control and similar abuses of property ownership rights.
- Permits & occupancy regulations - In some cases you will need to get occupancy permits just to rent the property.
- Cost and time to evict non-paying tenants. For example, in some states, you cannot evict tenants during the winter. In other states, it can take up to a year or more to evict a wily tenant. Note I view such nightmare evictions like I view cancer. The odds of your getting cancer are relatively small, but if you do get cancer, it is devastating and "odds" mean nothing.
The Process I Would Follow
I would eliminate locations based on the following criteria, which is sorted into the order of the easiest to hardest to evaluate.
- Population Size
- Property insurance cost
- Crime
- Population Growth
- Job quality and quantity
- State income tax rates
- Urban sprawl
- Investor friendliness
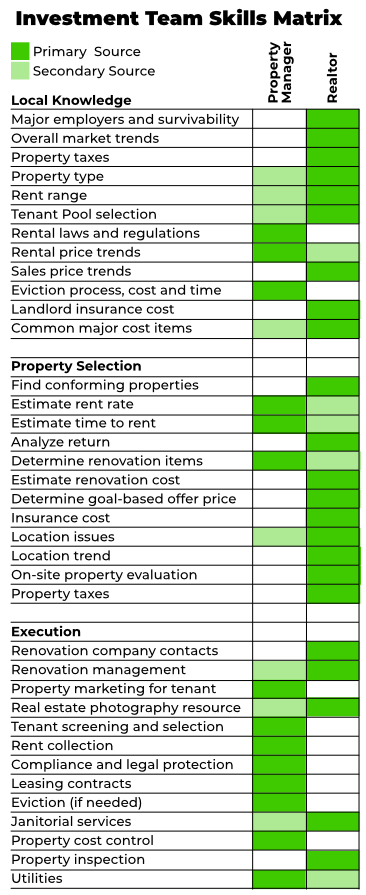
Final Consideration
A number of skills are required to make money with real estate. You can either provide all these skills yourself (you can't) or you can work with a good investment team. Below is a chart showing the needed skills and who is most likely to provide these skills. Unless I could find a good investment team in a location you are considering, I would look for another location.
Jason, I hope the above helps. If you have questions, feel free to reach out to me.
Post: Starting with the renter first?
- Realtor
- Las Vegas, NV
- Posts 743
- Votes 1,510
Hello @Jacoby Atako,
My concern is that the property would be specific to that tenant and maybe not be a good match for other tenants. So, when they move out (they will sooner or later) what will you do then?
I do believe in targeting a specific tenant pool. We certainly do and the results have been excellent. The properties are highly desirable to a pool of people so if one moves out it is quickly re-rented.
There is another concern, the tenant pool for properties priced over $400,000 is relatively small. Also, according to our research, the average tenant stay is about 2 years. The turn cost on such large properties is high. A little background on the general Las Vegas tenant pool characteristics might be helpful.
We did a good bit of research on average tenant stay by rent range. What we found is illustrated below.
Below a certain rent, the majority of the tenants stay 1 year or less. Above a certain rent range, the average tenant stay is about 2 years. We actually named the segments based on their average length of stay. See the image below.
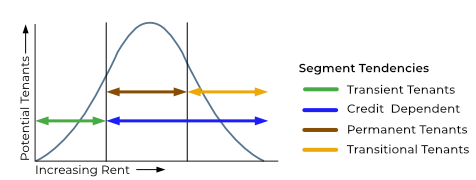
- Transient tenants - This segment of tenants are low paid hourly workers. They are the first to be laid off and the last to be rehired in times of financial stress. When you hear about tenants that cannot be evicted even though they are not paying due to the eviction moratorium, this is largely the group they are referring to.
- Permanent tenants - This is the segment we target. With a good property manager selecting the tenant, we've done very well both during the 2008 crash and through COVID.
- Transitional tenants - These people make enough to buy a home but some event has occurred that made renting more desirable. Once they sort out the problem they usually buy a home.
Buying a property that will only attract transitional tenants may not be the safest option. I would buy with a specific tenant pool in mind so I know I could always re-rent the property.
Post: How are investors making money in Las Vegas rentals?
- Realtor
- Las Vegas, NV
- Posts 743
- Votes 1,510
@Account Closed
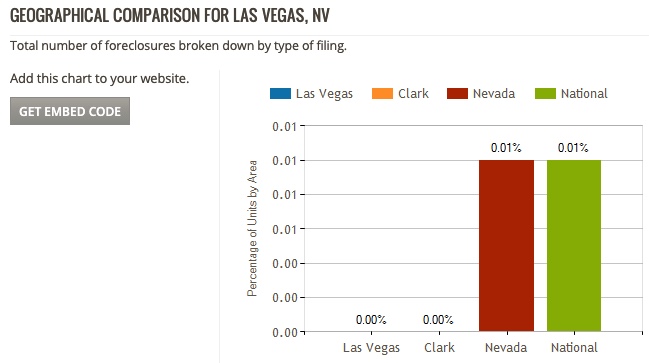
On your statement, "Vegas is number one. In forbearances/deliquency [sic]"
The following comes from RealtyTrak

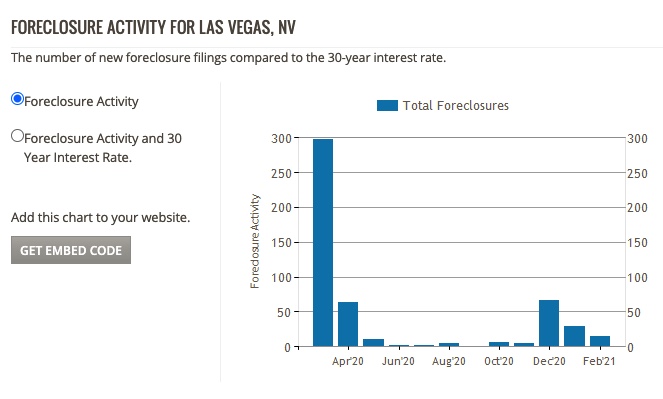
Will there be a lot of foreclosures in Las Vegas? I do not believe so because most properties are above water; if people get into financial trouble, they will sell their homes and pocket the profit. This is not 2008, where most homes were underwater.
I searched the MLS for distressed properties:
- Bank owned: 20
- Short sale: 19
- Foreclosure started: 7
Not a significant percentage of all available properties.
You stated you did not agree with the returns I provided, "Even Fernwood whos rental analysis i disagree with". Below are the numbers on one of the 8 properties we put under contract this month. All have a similar return.
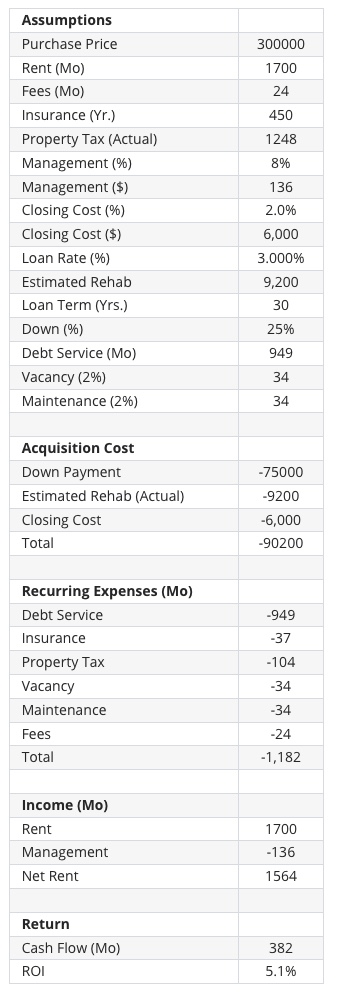
What part do you disagree with? Please be specific. How am I misleading people? My clients have positive cash flow from day one. Otherwise, >90% would not buy more than one property, and >80% buy three or more.
Post: Cities Where Rents Will Rise The Most In 2021!
- Realtor
- Las Vegas, NV
- Posts 743
- Votes 1,510
There were several comments on investing in Las Vegas, and I wanted to share what we are seeing with everyone.
What We Are Seeing
- We regularly close properties with a cash-on-cash return between 4% and 6% (10 last month), so they are available.
- Rents rose about 9% in 2020. We expect the same or more in 2021.
- The average time on the market for most of our client's rentals is under seven days.
- The average tenant stay (for ours and our clients' properties) is about five years, with an average turnover cost of about $500.
- COVID - To date, out of the 170+ client properties we track (out of a total of > 200 properties), at some point during the last nine months, ten tenants have had trouble paying the full rent on schedule. A relatively small percentage of the total. I expect most of these tenants will catch up on their rent. For example, one of the tenants just paid close to $9,000 to bring their rent current. Paying $9,000 to catch up on the rent is a lot more expensive than moving. However, moving is not the issue; bad credit report is their fear. A negative hit on their credit will dog them for years. Plus, even if they wanted to move, no property manager would rent an A Class property to anyone with any black mark on their credit. So, eviction moratorium or not, credit risk is the primary control factor for our tenant pool. We've only had five evictions in the last 14+ years.
- For Class C and Class B properties, it is a very different story. The landlords I talked to have a lot of tenants who have not paid the rent in months. The tenant pool for C and most B Class properties are lower-paid, lower-skilled workers. These are the first to be laid off during economic stress and the last to be rehired. This is one reason we do not recommend Class C and rarely B Class.
Las Vegas is in a unique position. There is little land for expansion, a growing job market, and an influx of people. Unless there is another "COVID Event", prices and rents will continue to increase at a rapid rate through 2021 and beyond. Unless California suddenly turns business and people-friendly, Las Vegas will have a long run of prosperity.
Supporting Information
First, the statistics.
The information below only concerns the narrow property profile/tenant pool we target. No data for any other property type is included. The typical property we target has the following characteristics:
- Single family
- Sale price < $400,000
- Bedrooms: 3 to 4
- Garage: 2 to 3
- Stories: 1 or 2
- Note that while the green area appears homogeneous, in actuality it is more like Swiss cheese.
Below you will find the statistics we generate each month.
Rental Statistics
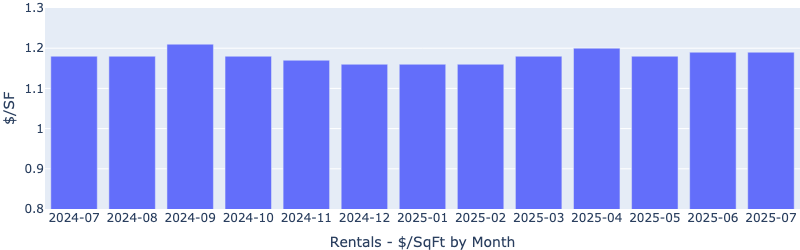
Rentals - Median $/SF by Month
Rents rose by approximately 9% YoY, which is a tremendous growth.
Rentals - List to Contract Days by Month
There is very little rental inventory and what is available goes under contract in days.

Rentals - Availability by Month
Inventory was low in January 2020, today it is even lower.

Rentals - Months of Supply
2 to 3 months is typical. Today we are just over 0.5 months of supply.

Sales Statistics
Median $/SF by Month
YoY $/SF increased by about 8%

Sales - List to Contract Days by Month
Due to the limited supply and the high levels of demand, properties went under contract in days, not weeks or months.

Sales - Availability by Month
There is very little inventory, which continues to drive up prices.

Sales - Months of Supply
6 months of supply is considered a "balanced" market. Today there is about 0.5 months of supply.

Other Items of Interest
- Google Data Center - Google is in the process of building a $600M data center in Henderson. They also announced that they will add a second $600M data center on the same site. Las Vegas will be one of 11 data centers worldwide. Even though they will not employ many people (100 to 150 employees at an average salary of $65,000), the presence of Google is huge. I believe that where Google goes, others will follow. And, it will be infrastructure, which is what I want for Las Vegas. I've seen companies lay off thousands of engineers and programmers at a time, but no one walks away from infrastructure.
- announced three more centers in Las Vegas. Of special interest are two facilities: Merch by Amazon and Print on Demand. "Merch by Amazon allows brands and independent artists to create custom-printed apparel and electronics products. Print on Demand helps authors and publishers with on-demand publishing, helping to reduce upfront costs of printing for inventory." Amazon selecting Las Vegas for this type of infrastructure will bring others to Las Vegas as well.
The hospitality industry is still expanding:
- Virgin Hotels is opening a new hotel/casino on March 25, 2021)
- The First Atari Hotel Looks Like a Gamer's Fantasy — and It’s Opening in Las Vegas
- The Boring Company plans to expand the existing underground transit system in Las Vegas.
- Resorts World, a $7B hotel/casino is opening summer 2021.
- Las Vegas was the second fastest-growing city in the US for 2020 - according to updater. "Most people migrated [to Las Vegas] from cities like San Fransisco, Los Angeles, and Sacramento, Updater said."
- California fuels Las Vegas growth - As California continues to make the state less desirable for both individuals and businesses, many are leaving the state. Leaving California has actually become a significant business. A portion of these companies and people will choose Las Vegas. Hopefully, the number of people moving to Las Vegas will not become the torrent that Boise is attempting to deal with.
- Zillow is predicting a +10% increase in Las Vegas housing prices in 2021. Interestingly, in the summer of 2020 they predicted a 7% decrease for 2021.
- Housing prices for Las Vegas are still well below 2006 peak prices. See the chart below. If you ignore inflation, prices have almost reached the 2006/2007 peak. However, inflation is real and must be considered. $143/SF in 2008 dollars is the same as $174/SF in 2020 dollars so there is still a long way to go.
- Land shortage - The available land for development continues to dwindle. At the end of 2019, the amount of vacant buildable land in the Las Vegas Valley was less than 28,000 acres, of which 5,000 to 7,000 acres is not viable for residential development. (87.5% of Clark County is federally owned. 85% of the entire state is federally owned. ) Consumption rate is about 5,000 acres/year. See the animated GIF below. The areas in brown are federal land. The time-lapse only goes through 2018 and there was a large amount of development in 2019 and 2020. The southwest part of the city is now the least developed and construction in the area is relentless. For example, the $400M Uncommons has broken ground - a $400M complex in southwest Las Vegas.
Las Vegas is and will continue to be a great place to invest for buy and hold investors.
Post: How are investors making money in Las Vegas rentals?
- Realtor
- Las Vegas, NV
- Posts 743
- Votes 1,510
Hello @Dexter Belleza,
Thank you for asking. A lot has changed since 2017, mostly for the better with our target tenant pool. First, a summary and then the supporting information.
What We Are Seeing
- We are consistently closing on properties with an average cash-on-cash return of between 4% and 6% (10 this month). And, we believed rents will continue to increase in 2021 and beyond. However, these sorts of deals represent only about 0.4% of all available properties. The days of finding such deals by cruising real estate sites or driving around are pretty much over.
- Rents rose about 9% in 2020, and we expect the same or more in 2021.
- The average time on the market for most of our client's rentals is under seven days.
- The average tenant stay is still at about five years, with an average turn-over cost of about $500.
- COVID - To date, out of the 160+ client properties we track (out of a total of > 200 properties), at some point during the last nine months, ten tenants have had trouble paying the full rent on schedule. A relatively small percentage of the total. I expect most of these tenants will catch up on their rent. For example, one of the 10 tenants just paid close to $9,000 to bring their rent current. Paying $9,000 to catch up on the rent is a lot more expensive than moving. However, moving is not the issue; bad credit report is their fear. A negative hit on their credit will dog them for years. Plus, even if they wanted to move, no property manager would rent an A Class property to anyone with any black mark on their credit. So, eviction moratorium or not, credit risk is the primary control factor for our tenant pool. We've only had six evictions in the last 14 years.
- For Class C and Class B properties, it is a very different story. The landlords I talked to have a lot of tenants who have not paid the rent in months. The tenant pool for C and most B Class properties are lower paid, lower skilled workers. These are the first to be laid off during economic stress and the last to be rehired. This is one reason we do not recommend Class C and rarely B Class.
Las Vegas is in a unique position. There is little land for expansion, a growing job market, and an influx of people. Unless there is another "COVID Event," prices and rents will continue to increase at a rapid rate through 2021 and beyond. Unless California suddenly turns business and people-friendly, Las Vegas will have a long run of prosperity.
Supporting Information
First, the statistics.
The information below only concerns the narrow property profile/tenant pool we target. No data for any other property type is included. The typical property we target has the following characteristics:
- Single family
- Sale price < $400,000
- Bedrooms: 3 to 4
- Garage: 2 to 3
- Stories: 1 or 2
- Note that while the green area appears homogeneous, in actuality it is more like Swiss cheese.
Below you will find the statistics we generate each month.
Rental Statistics
Rentals - Median $/SF by Month
Rents rose by approximately 9% in 2020.
Rentals - List to Contract Days by Month
There is very little rental inventory and what is available goes under contract in days.
Rentals - Availability by Month
Inventory was low in December 2019, today it is down to the lowest I've seen in the last 15 years.
Rentals - Months of Supply
2 to 3 months is typical. Today we are just over 0.5 months of supply.
Sales Statistics
Median $/SF by Month
YoY $/SF increased by about 8%
Sales - List to Contract Days by Month
Due to the limited supply and the high levels of demand, properties went under contract in days, not weeks or months.
Sales - Availability by Month
There is very little inventory, which continues to drive up prices.
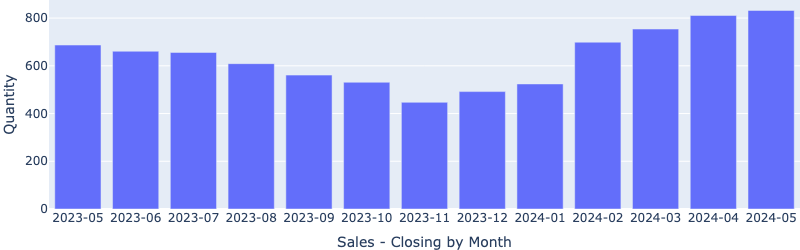
Sales - Closings by Month
Sales - Months of Supply
6 months of supply is considered a "balanced" market. Today there is about 0.5 months of supply.
Other Items of Interest
- Google Data Center - Google is in the process of building a $600M data center in Henderson. They also announced that they will add a second $600M data center on the same site. Las Vegas will be one of 11 data centers worldwide. Even though they will not employ many people (100 to 150 employees at an average salary of $65,000), the presence of Google is huge. I believe that where Google goes, others will follow. And, it will be infrastructure, which is what I want for Las Vegas. I've seen companies lay off thousands of engineers and programmers at a time, but no one walks away from infrastructure.
- announced three more centers in Las Vegas. Of special interest are two facilities: Merch by Amazon and Print on Demand. "Merch by Amazon allows brands and independent artists to create custom-printed apparel and electronics products. Print on Demand helps authors and publishers with on-demand publishing, helping to reduce upfront costs of printing for inventory." Amazon selecting Las Vegas for this type of infrastructure will bring others to Las Vegas as well.
The hospitality industry is still expanding:
- Virgin Hotels is opening a new hotel/casino this month (January 2021)
- The First Atari Hotel Looks Like a Gamer's Fantasy — and It’s Opening in Las Vegas
- The Boring Company plans to expand the existing underground transit system in Las Vegas.
- Resorts World, a $7B hotel/casino is opening summer 2021.
- Las Vegas was the second fastest-growing city in the US for 2020 - according to updater. "Most people migrated [to Las Vegas] from cities like San Fransisco, Los Angeles, and Sacramento, Updater said."
- According to Newsweek, Nevada is the third fastest-growing state.
- California fuels Las Vegas growth - As California continues to make the state less desirable for both individuals and businesses, many are leaving the state. Leaving California has actually become a significant business. A portion of these companies and people will choose Las Vegas. Hopefully, the number of people moving to Las Vegas will not become the torrent that Boise is attempting to deal with.
- Zillow is predicting a +10% increase in Las Vegas housing prices in 2021. Interestingly, in the summer of 2020 they predicted a 7% decrease for 2021.
- Housing prices for Las Vegas are still well below 2006 peak prices. See the chart below. If you ignore inflation, prices have almost reached the 2006/2007 peak. However, inflation is real and must be considered. $143/SF in 2008 dollars is the same as $174/SF in 2020 dollars so there is still a long way to go.
- The median sales price for new single-family homes is $415,000. The current price range for our target property profile is between $250,000 and $350,000. What this means is that new homes will not compete with resales as investments. The quantity of conforming rental properties is limited. This will tend to drive up rents and prices.
- Land shortage - The available land for development continues to dwindle. At the end of 2019, the amount of vacant buildable land in the Las Vegas Valley was less than 28,000 acres, of which 5,000 to 7,000 acres is not viable for residential development. (87.5% of Clark County is federally owned. 85% of the entire state is federally owned. ) Consumption rate is about 5,000 acres/year. See the animated GIF below. The areas in brown are federal land. The time-lapse only goes through 2018 and there was a large amount of development in 2019 and 2020. The southwest part of the city is now the least developed and construction in the area is relentless. For example, the $400M Uncommons has broken ground - a $400M complex in southwest Las Vegas.
I hope this answers your question on the current state of the investment market in Las Vegas. If you have questions, please contact me directly or post them and I will do my best to answer.
Post: Which neighborhood to invest in Las Vegas
- Realtor
- Las Vegas, NV
- Posts 743
- Votes 1,510
Determining a Property Specific Maintenance Provision
In this post I will describe a method for determining a property specific maintenance provision and explain where this method can fail. Before I do, I want to explain why there is no "universal constant" that provides any meaningful result for all properties. To demonstrate the problem, I will compare the maintenance on two cars.
Suppose you are asked to determine a single yearly maintenance amount that would be accurate for the two cars shown below.

One is a new small car and the other is an older wrecked Humvee. If you chose an annual amount to match the new car, it would be insufficient for the Humvee. If you chose a maintenance amount that would match the Humvee, it would be way more than what is needed for the small car. If you decided to use a average of the maintenance cost for the small car and the wrecked Humvee, you would be wrong on both.
Even if such a universal maintenance constant could be determined, multiplying this constant (percentage) by the rent does not work. When you multiply any maintenance constant by rent, the higher the rent, the higher the predicted maintenance cost. The following example will demonstrate the problem with this approach.
Suppose I assume that 10% of the rent is the correct amount of all properties, no matter the tenant pool, age or condition, length of tenant stay, construction materials used, tenant pool, climate or anything else. I will use the maintenance constant multiplier for estimating the maintenance of a typical C Class Las Vegas property and one of the A Class properties we deal with.
In Las Vegas, many C Class properties rent for about $650/Mo., average age is about 40 years and most are in poor condition. If I use the 10% rent multiplier, the result is: 12Mo. X $650/Mo. X 10% = $780/Yr for maintenance cost. Does this approximate the actual cost? In short, no. In my experience, $2,000 to $2,500 might be low.
A Class properties that conform to our property profile have an average cost of about $300,000 with a typical rent of about $1,800/Mo. All were built after 1985 and we cherry pick properties that require low maintenance. If I use the same 10% multiplier: 12Mo. X $1,800/Mo. X 10% = $2,160/Yr. According to the property managers we work with, average maintenance cost is closer to $350/Yr. The amount of rent has no relationship to the annual maintenance cost.
Determine a Property Specific Maintenance Provision
The method used with commercial properties is to create a "reserve" fund to cover future repair costs based on remaining useful life of the expensive components. The following example shows the two most expensive repair cost items for our typical residential properties. You might have 2 or 10 items on your spreadsheet. It depends on the property age, condition, construction, etc.
Suppose you want to determine a maintenance provision for a property and you know the age of the existing units. From this you can determine the remaining useful life.

Based on the projected remaining useful life, you need to accumulate the replacement cost of the AC compressor ($2,500) within 11 years, and to accumulate the replacement cost of the water heater within 3 years. So, how much do you need to set aside each month to handle both repairs?
- AC compressor: $2,500 / 11 Yrs / 12 Mo/Yr = $19/Mo.
- Water heater: $800 / 3 Yrs / 12 Mo/Yr = $22/Mo.
The total for each month is: $19 + $22 or $41/Mo.
Using this approach, once you have accumulated enough funds ($2,500 + $800) to replace the two units, you do not keep accumulating funds. However, the odds of the AC compressor and the water heater failing in the same years are small. I would accumulate the funds for the more expensive items (the AC compressor) and not worry about the water heater.
Another factor to consider is the monthly cash flow from the property. Suppose the cash flow for the property is $300/Mo. You could cover the replacement cost of the AC compressor with $2,200 plus one month's cash flow ($300). That changes the calculation for the AC compressor provision as follows:
- AC compressor: ($2,500 - $300) / 11Yrs / 12Mo/Yr = $17/Mo.
Multiple Properties
How do you determine a maintenance provision if you owned multiple properties? You would create a spreadsheet with the useful life, remaining life and replacement cost for major component for each property. To keep things simple the following table only contains one item, the AC compressor, for each property and the replacement cost is always $2,500.

The table below contains the monthly cash flow for each property.

In this example, the total monthly cash flow is sufficient to cover the replacement cost of one AC compressor. Since the odds of two AC compressors failing in the same month are low, no provision is actually needed for this (overly simplistic) example.
The point is that as the number of properties increases, you actually need a lower maintenance provision since the combined cash flow will cover most repairs.
The same method can be applied to base level repairs, such as dripping faucets, etc. Work with the property manager to determine a reasonable base repair cost and then amortize it on monthly basis. For example, if you assume 2 repairs each year and each repair costs $100, the repair provision for the earlier property can be revised as follows:
- AC compressor: $2,500 / 11Yrs / 12Mo/Yr = $19/Mo.
- Water heater: $800 / 3 Yrs / 12Mo/Yr = $22/Mo.
- Base maintenance: $200/Yr / 12Mo/Yr = $17/Mo.
Total for each month is $19 + $22 + $17 or $58/Mo.
Where This Falls Down
Individual items do not necessarily conform to national averages. For example, consider a water heater. While the useful life according to national sources is 12 years, could a water heater fail in 6 years? Yes it could. Could a water heater last 20 years, yes it could. Plus, the unexpected will happen. You handle this by establishing an initial maintenance fund and then add to it using the previously described maintenance provision method. What I did was to place $1,000 in a maintenance fund at the time I closed on the first property. With additional properties, I may or may not add to the fund. To date, all the repairs are minor and the repairs were covered by the monthly cash flow so I have not touched the maintenance fund.
Only Insure What You Can Not Afford to Lose
A maintenance fund is like an insurance policy. The accumulated funds are there to cover costs that you cannot afford to pay. What if you have sufficient funds from your job or other sources to handle any anticipated maintenance expense? You may choose not to maintain any maintenance provision.
Summary
The real world does not run on "averages". Maintenance is a good example. There is no universal constant which you can multiply by the monthly rent to get anything reasonable. The best way to estimate the annual maintenance is to talk to your property manager. They can tell you what they are experiencing with similar properties. However, always remember that you did not buy an "average" property, you will purchase a specific property, and every property is different.
Vacancy cost can be provisioned in a similar way. If anyone is interested I can write a post about this as well.