All Forum Categories
Market News & Data
General Info
Real Estate Strategies

Landlording & Rental Properties
Real Estate Professionals
Financial, Tax, & Legal


Real Estate Classifieds
Reviews & Feedback
All Forum Posts by: Eric Fernwood
Eric Fernwood has started 57 posts and replied 709 times.
 Post: Which neighborhood to invest in Las Vegas
- Real Estate Agent
- Las Vegas, NV
- Posts 736
- Votes 1,509
Hello @Hengky Lim,
Before you choose a location in Las Vegas, you need to decide what tenant pool you wish to target. Each tenant pool has different characteristics, which defines the type, location, configuration and rent rate of the properties that will attract your target tenant pool.
Based on our research on Las Vegas renters, you can generally subdivide tenant pools into three general categories based on rent, as shown in the image below.
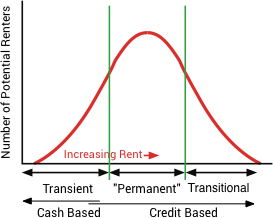
General characteristics of each segment:
- Transient - Cash based, average tenant stay 1 year, typical turn cost $1,500 to $2,000. Plan on lots of turnover and high maintenance costs. These are typically C class properties. Typical age of these properties is about 40 years. These are typically hourly workers making little more than minimum wage. They are the first to be laid off and the last to be rehired. When you hear about landlords not receiving rent due to the covid eviction moratorium, this is the tenant pool segment most are referring to.
- Permanent - These are typically families with an income between $45,000 and $65,000/Yr. They stay for long periods of time (average is about 5 years), pay all the rent on schedule and take care of the property. Average turn cost is about $500. This tenant pool primarily occupies A Class and some B+ Class properties. The physical act of eviction is not what concerns this tenant pool segment, the credit hit does. They know that if they have a late payment, let alone an eviction, they will not be able to rent another A Class property and the cost of credit will rise significantly.
- Transitional - These are people who make enough money to buy a home and typically only rent due to some event in their lives like a divorce, death of a spouse, etc. Once they sort out their lives, they buy a home. Typical tenant stay, 2 years. Turn cost, high. These properties are typically larger homes with significant amenities and tenant expectations are very high. Restoring a home to meet the next tenant's expectations is expensive.
Because of the above and other considerations, we choose a narrow tenant pool segment well inside the "envelope" of what we call the "Permanent" renter range. This tenant pool has worked out very well for us and our clients, including during turbulent economic times such as the 2008 crash and today.
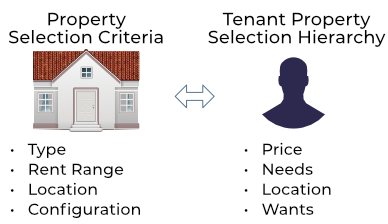
How do you target a specific tenant pool? You need to understand the specific target tenant pool's selection hierarchy. See the image below.
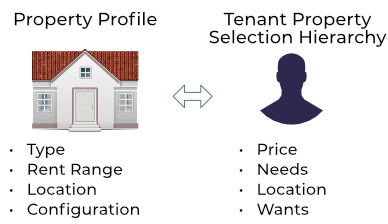
- Price - If you can afford $1,200/Mo. rent, you will not consider properties renting for $1,500/Mo. or properties renting for $1,000/Mo. A rule of thumb is to select properties that will rent profitably at about 1/3 of the median gross wage of your target tenant pool.
- Needs - If you want to attract families, one bedroom condos will not work.
- Location - Factors such as crime, area amenities, schools, access to transit, etc. define the location.
- Wants - For example, to attract our target tenant pool the property almost always needs to have tile or LVP floorings for high traffic areas. For another tenant pool, it might be bars on the windows. Another might be a swimming pool. This also drives what renovations are required and which are not.
With these 4 factors defined, you can translate them into a property profile, which will include at least 4 characteristics:
- Rent - Rent range. Typically, you can use 1/3 of the gross monthly income for the pool.
- Type - Condo, multi-family, single family, etc.
- Location - You may find a few locations that will work.
- Configuration - 2 bedrooms, 3 bedrooms, single story, etc.
There are more factors to consider but the above are the major property selection criteria.
Below is a diagram showing the general process. Simplistically, talk to multiple property managers about what types, configurations, locations and rent ranges that will attract the tenant pool you want to target . (If you want a list of potential questions, drop me an email.) Pay special attention to factors like typical tenant stay and time to rent. You need a long tenant stay; a vacant property destroys profitability.

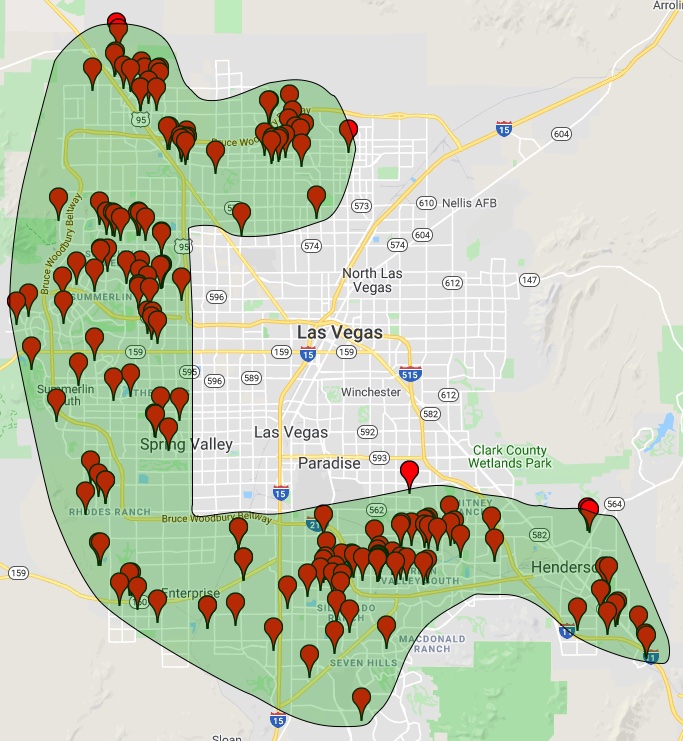
The map below shows where most of our client's properties are located. However, if you choose a different tenant pool, your search areas would be different. (Note, while the green area appears homogeneous, it actually looks more like Swiss cheese.)
Hengky, I hope the above helped. Email me or post any questions and I will do my best to answer.
Post: Las vegas Flippers and Rental Investors
- Real Estate Agent
- Las Vegas, NV
- Posts 736
- Votes 1,509
Hello @Jordan Goulet,
There are investment properties with excellent cash flow available but, as always, you have to pick good properties that target the right tenant pool. We currently have 7 such properties under contract.
As always, the tenant pool is critical, especially in turbulent times like today. Based on what I am hearing, owners of C class and most B class properties are hurting because of the COVID eviction moratorium in addition to the normal high turn-over rate. In contrast, out of a population of +160 A Class properties our clients purchased from us, 5 tenants that are delinquent on the rent will be evicted if they do not catch up. This is worse than the 2008 crash. At that time we had zero reduction in rent, zero vacancies and no evictions.
Below is what we are consistently seeing, and we do 5 to 10 such properties each month.
- Single family price range: $250,000 to $350,000
- Townhouse price range: $200,000 to $260,000
- Return: 4% to 8% with 25% down financing including debt service, taxes, insurance, management, and reasonable maintenance and vacancy provisions.
- Average tenant stay is 5 years and the average turn cost is about $500. Time to turn a property, about one month, sometimes less.
- To date, we have had 6 evictions in the last 14 years from our single family and townhome properties. (For C Class (we have very few), on average there are 3 to 5 evictions/skips a month.)
- Time to rent after renovation: 5 to 14 days
I am working on our annual Las Vegas 2021 Investor Outlook and below are a couple of stats that you may find interesting. The full report will be out mid January.
- Rents increased about 9% YoY.
- $/SF increased about 7.9% YoY.
So, if you buy the right properties that target the right tenant pool, now is a fantastic time to invest in Las Vegas real estate. Especially so with the low interest rates. The challenge is finding these properties. Good Class A investment properties represent about 0.4% of the total available properties. We can only find them because we developed our own data mining software. Manually, it would be difficult since not only are good properties few and far between, they go under contract within days. So, there is little time to act.
Post: Looking for a recommendation for buyer's agent in Vegas
- Real Estate Agent
- Las Vegas, NV
- Posts 736
- Votes 1,509
Hello @Andrew Njoo,
Instead of giving you names, I will talk about the skills you will need from your Realtor/Investment team. My intent is to give you the background knowledge you will need to select the right investment team.
Whether you invest locally or remotely, the skills you need are about the same. The only difference is that while you might provide some skills yourself if the property is local, as a remote investor you will need others to provide all the skills. Below is what I consider to be the minimum skills you will need to be successful.

As you can see, I subdivided the required skill sets into four categories:
- Local knowledge - What you learn from podcasts, books and seminars is general investment/real estate knowledge but has very limited applicability to any specific market. Restating, what is the best investment in Houston could be worst investment in Boston. All markets are different. There is no database that can provide hyper-local knowledge you need. It can only come from your investment team.
- Property specific - Even if you are local, your knowledge may not be relevant. Very few people have the in-depth knowledge of properties to know a good investment from a poor investment property. Remember, you are not buying a home; you are buying an income stream, so the property type, beds, baths, etc. does not matter. What matters is how the property performs today and likely to perform over a 10 or 20 year hold.
- Realtor responsibility - MLS sheets are worthless, the property type, number of bedrooms, baths, etc. mean nothing. What matters is the short and long-term performance. The Realtor you select must be able to provide the property/location analytics you need. This means providing detailed analytics on a few qualified candidates from which you can select. Not sending you 100 MLS data sheets for you to do the analysis, you do not have the essential hyper-local knowledge. However you will make the final decision. So, you need actionable analytics rather than opinions from your investment team so you can make an informed decision.
- Execution - The best plan is worthless unless it is executed properly. This includes knowing the right people for every task and a team member with the knowledge to over watch and ensure everything is meeting objectives.
I put together the following chart to show the value of the Realtor.

The vast majority of Realtors deal with residences or lifestyles and wants: first home, expanding family or downsizing, schools, commute to work, relocation, etc. However, while most Realtors are great for home buyers, they have little or no knowledge of investments. Investing in real estate requires in-depth knowledge of tenant pools, area economics, job growth, demographic changes, understanding and estimating returns, selecting high performance properties and much more. There is little overlap with a residential Realtor except for the paperwork of closing a sale.
Also, do not be confused by Realtors who have sold investments. In most cases, the Realtor sent the investor MLS sheets (almost worthless to an investor) and then made the offer on the properties specified by the client. This does not make a Realtor knowledgeable of investments. What should you look for in a good investment Realtor?
- Deep knowledge of investment real estate, including expertise in estimating returns and rehab costs.
- Deep knowledge of the local investment market, including areas and types of properties to focus on or to avoid.
- Access to a network of service providers for various needs.
- Highly skilled in selecting good investment properties, especially in a competitive market.
- Highly skilled in process management and problem solving and deal making in order to bring a property from identification through acquisition, rehab, and property manager hand off.
How do you then, from thousands of Realtors in any market, identify a good investment Realtor? The following chart shows a process you could follow. I divided the diagram into Critical Skills and Highly Desirable Skills. If the Realtor does not have ALL the Critical Skills, if they are missing ANY of the skills, find another Realtor. You cannot afford to depend on anyone without all the critical skills.
The Highly Desirable Skills are critical for success, but you can accomplish these tasks with someone other than the Realtor if necessary. For example, if the Realtor does not have the skills to over-watch the rehab, the property manager may provide this skill.
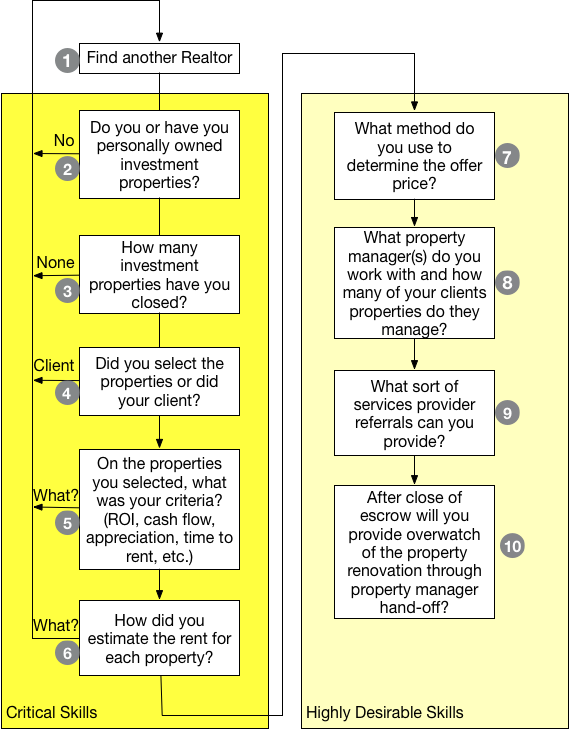
Know that you will have to interview multiple Realtors before you find one with even a portion of the Critical Skills. Do your interviewing via Zoom/Skype. You are going to trust this person with investing a lot of your money, and you will get far more information if you can look the person in the eye than just hear their voice on the phone.
Andrew, I hope this gets you started on finding the Realtor/investment team you need.
Post: Rental Property in Las Vegas
- Real Estate Agent
- Las Vegas, NV
- Posts 736
- Votes 1,509
Hello @Garrett Smith,
Excellent question. But not one with a short answer. There are many ways to calculate return. We use a conservative method that includes all recurring costs and we cover the approximate cost for maintenance and vacancy by not including any tax benefits (depreciation) in our calculations. Also, remember that return calculations are only an estimate of how a property is likely to perform on day one of a life time hold. The economic momentum in a location is more important than the first day's return.
The formulas we use are below.
- ROI = (Income - DebtService - ManagementFee - Insurance - RETax - PeriodicFees) x (1 - StateIncomeTax) / ( DownPayment + ClosingCosts)
- Cash Flow = (Income - DebtService - ManagementFee - Insurance - RETax - PeriodicFees) x (1 - StateIncomeTax)
Notes:
- There is no state income tax in Nevada but we include this variable (StateIncomeTax) for when we compare properties in states that do have a personal income tax.
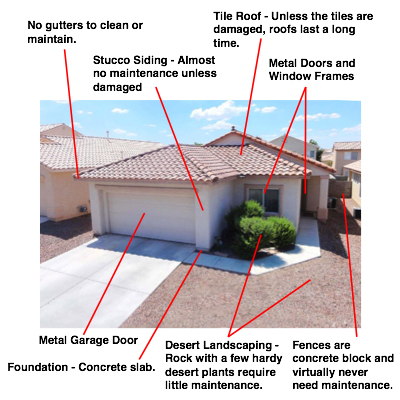
- We do not include a constant for vacancy rate or maintenance when we compare properties. (If you want to know why, ask me). Vacancy and maintenance are property and tenant pool specific. The way we compensate for maintenance and vacancy is that we do not include any tax benefits, like depreciation, which generally increases return by between 3% and 6%. For our population of properties and our tenant pool, maintenance plus vacancy averages about 4% so the tax benefit generally exceeds vacancy plus maintenance. We are able to keep maintenance and vacancy low because of the construction used in Las Vegas (see below), careful selection of properties, careful screening of tenants, an average tenant stay of about 5 years, average turn cost of $500 and the property managers we work with.
- Debt Service: Principal and interest.
- Management Fee: Management fee percentage x annual rent. Our clients pay 8% of collected rent.
- Insurance: Estimated annual landlord insurance. We use $450/Yr which is reasonably accurate for our property population.
- RETax: Annual property tax. We use the actual tax (from tax records) for each property.
- Periodic Fees: The sum of all periodic fees like association fees, special assessments, etc. prorated to a monthly fee.
- State Tax: Nevada has no state income tax, so this is always zero for properties in Nevada. However, if you are comparing a property in Nevada to one in another state, use the appropriate income tax rate for that state.
- Down Payment: We assume 25% as almost all of our clients choose this option due to the interest rate difference. For cash purchases, it is the total purchase price.
- Closing Costs: We use 2% x the purchase price for financed properties and $2000 for cash purchases. 2% is usually sufficient to cover the lender fees if any plus closing costs, the appraisal, inspection, lease-up fees (from the property manager), a 1 year home warranty, 2 repairs in the first year with about $500 as a maintenance reserve. This is only a guess but it usually works out for a high percentage of our properties.
On recent properties, we are seeing 5% to 8%, with all recurring and an estimate on non-recurring costs included (closing costs). Below is an example property. If you are interested in all the details including a video, property manager opinion and more, email me and I will provide all the details.
Below is the estimated return for one of the better performing properties we've seen this week. (Note: If I included the estimated rehab cost ($5,400), return decreases to 8.1%.) More commonly, we see properties with returns between 5% and 8% with 25% down.
| Assumptions | ||
|---|---|---|
| Purchase Price | 300000 | <<Asking Price |
| Rent (Mo) | 1850 | <<Property Manager Opinion |
| Fees (Mo) | 14 | <<Actual |
| Insurance (Yr.) | 450 | <<Estimate |
| Property Tax (Actual) | 1236 | <<Actual |
| Management (%) | 8% | <<Actual |
| Management ($) | 148 | |
| Closing Cost (%) | 2.0% | <<Typical with Keller Williams Mortgage |
| Closing Cost ($) | 6,000 | |
| Loan Rate (%) | 3.125% | <<Last close rate |
| Estimated Rehab | 0 | |
| Loan Term (Yrs.) | 30 | |
| Down (%) | 25% | <<Last close rate |
| Debt Service (Mo) | 964 | |
| Vacancy (2%) | 37 | <<Estimate based on history |
| Maintenance (2%) | 37 | <<Estimate based on history |
| Acquisition Cost | ||
| Down Payment | -75000 | |
| Estimated Rehab | 0 | |
| Closing Cost | -6000 | |
| Total | -81000 | |
| Recurring Expenses (Mo) | ||
| Debt Service | -964 | |
| Insurance | -37 | |
| Property Tax | -103 | |
| Fees | -14 | |
| Total | -1,118 | |
| Income (Mo) | ||
| Rent | 1850 | |
| Management | -148 | |
| Net Rent | 1702 | |
| Return | ||
| Cash Flow (Mo) | 584 | |
| ROI | 8.7% |
Garrett, not certain I answered all your questions. So, feel free to post a follow-on question or reach out directly on email.
Post: Rental Property in Las Vegas
- Real Estate Agent
- Las Vegas, NV
- Posts 736
- Votes 1,509
Hello @Walter Antonio,
I see two questions in your post:
- What are the best zip codes for investment properties?
- Can you quickly rent a property at this time?
The Best Zip Codes
Which location is best depends on what tenant pool you are targeting. For example, if you are targeting low paid hourly workers, then C class properties on the East side and areas of North Las Vegas would be the places to look. We do not target low paid hourly workers for multiple reasons. The tenant pool we target can be described as:
- Has stable employment in a market segment that is very likely to be stable or improve over time.
- Pays all the rent on schedule
- Takes care of the property
- Does not cause problems with neighbors
- Does not engage in illegal activities while on the property
- Stays for many years
The property characteristics we require include:
- Sustained profitability - The property must generate a positive cash flow today and into the foreseeable future, in good times and bad.
- Appreciating at or above the rate of inflation and likely to continue for the foreseeable future.
- Maintenance costs are low
Below is a map showing where the majority of our client's properties are located. The map gives a false impression, that all the areas in green are good investment locations. This is not true. The actual map looks closer to Swiss cheese. We are selective down to the subdivision level, not at the zip code level. However, this will give you a good overall idea of where we are finding good properties.
89138 is certainly in one of the areas we consider. However, when we look for properties, we are not selecting properties by location. What we do is select properties that our target tenant pool is willing and able to rent. To make a long story short (See this month's newsletter if you want details), below is a simplified depiction of the tenant pool we target.

How well has this tenant pool performed? During the 2008 crash, our clients had zero decrease in rent, zero vacancies. The market value of their properties plunged like all others but their income stream (the purpose of the properties) did not decrease. Today during the pandemic, out of the 160+ properties we track (there are more but they are scattered out with multiple property managers and a few are self managed), so far there are 10 tenants that have not paid the full rent on schedule at some point during the last 7 months. 5 of these tenants recently caught up on the rent or made arrangements acceptable to the owner. We expect most or all of the remaining 5 to catch up on the rent or make an arrangement acceptable to the owners.
How do you target a specific tenant pool? Through the property. Each property defines the tenant pool so you need to be very aware of the characteristics of the targeted tenant pool. In 2004/5 I spent a lot of time studying how tenants select properties. I came up with a selection model I call the Tenant Property Selection Hierarchy (if anyone can suggest a more "catchy" name, I would appreciate hearing it). See the illustration below.
On the right is the order in which most tenants select rental properties. Expanding on the hierarchy.
- Price - The maximum a tenant is willing and able to pay is about 1/3 of their gross monthly income. And, since people generally want to live in the nicest place they can afford, they tend to rent properties priced at about 1/3 of their gross monthly pay. Knowing the rent range, we were able to translate that into property prices.
- Needs - Number of bedrooms, baths, size, etc.
- Location - People are willing to drive a reasonable distance to live in safe areas with acceptable amenities. What is reasonable depends on the metro area. We made some amazing discoveries on how long people will drive in Las Vegas. Beyond that distance, rents tended to drop and time to rent increases. This helped to define the location where we search for properties.
- Wants - Examples would include elements such as granite counters, nice appliances, property age, flooring, condition, etc.
Once we understood our target tenant pool's Tenant Property Selection Hierarchy, we mapped this to what we call a property profile. At a minimum, a property profile has 4 components:
- Type - Condo, single family, high rise, etc.
- Rent range - This must match the gross monthly income of the target tenant pool.
- Location - We were surprised to find "clusters" of desirable areas as opposed to gross areas like zip codes.
- Configuration - This has to do with the number of bedrooms, baths, garage size, SqFt, etc.
However, just because a property meets all these requirements does not mean that every tenant that it attracts is a good tenant. Tenants that meet all the characteristics I listed earlier are not the norm. This is part of the reason why we work closely with a very skilled property manager during property selection. It takes a skilled property manager to select the good tenants from all the applicants.
In summary, I believe A class single family and select townhomes, in the $250,000 to $350,000 range which meet all the above requirements are the best long term investment.
Are Properties Renting
Below are statistics on the tenant pool we target. Understand that these are not "general" Las Vegas metro numbers like you find in the "news". (I quote the term "news" because I question if any of their people has ever taken even a basic statistics class.) We do not track C or B class properties, condos, multi family, etc. since we do not recommend such properties in Las Vegas. Our clients are seeking long term, highly reliable income streams that increase faster than the rate of inflation. Now the numbers.
Rentals - Median $/SF by MonthNotice the significant rent increase in July, August and September.

Rentals - Median List to Contract Days by Month
The time from list to contract is below 10 days and dropping, an amazingly short period of time. According to the property managers we work with, there are usually multiple qualified applicants for each property. In some cases, renters are offering to pay more than the asking rent or pay one year's rent in advance just to secure a good place to live.

Rentals - Availability by Month
This chart shows the average daily number of properties that were for rent by month. As you can see, rental inventory continues to fall. We are at less than half of the level a year ago, a dramatic decrease.

So, the statics clearly show that there is an extreme shortage of rental properties for our target tenant pool which means now is a great time to buy rental properties.
Walter, if you select a property that targets the right tenant pool, the odds of quickly renting the property are better today than they have been in many years.
I hope this is helpful.
Post: Found a property in LV but worried about peak
- Real Estate Agent
- Las Vegas, NV
- Posts 736
- Votes 1,509
As always, lots of great opinions and predictions on this thread. However, I always question the reliability of any prediction. I believe Peter Drucker said it very well:
"Trying to predict the future is like trying to drive down a country road at night with no lights while looking out the back window."
Or, my own opinion:
"Predicting anything beyond yesterday is guessing"
So I will leave the predictions to others and instead I will present the current condition of the Las Vegas market.
Below are charts from our latest trailing 13 month market report, which includes August data. Remember that this data is only for the property profile that we target, not for the entire metro area and all property types. Our property profile was selected to have the highest probability of attracting our target tenant pool. In general, the property profile is as follows:
- Single family
- 1 or 2 stories
- Price range: $250,000 to $400,000
- 3+ bedrooms
- 2+ car garage
- In very specific areas
- Built after 1985
There is a lot more detail but the above will give you a general idea of the properties we target. What this also means is that we do not include in our data: apartments, condos, multi-family, single family homes priced above or below our target price range or configurations that do not conform to our property profile.
So, with all that said, here is the data for the prior 13 months ending 8/31/2020.
Rental Statistics
Rental rates posted another significant increase in August, now at the highest level for the last 13 months. Both property managers that we work with are reporting extremely low inventory and multiple applications for most properties.
Rentals - Median $/SF by Month
There was a significant month-to-month increase in rental rates, which reflects low inventory and increasing demand.
Rentals - Median List to Contract Days by Month
The time from list to contract is below 10 days, an amazingly short period of time. There are usually multiple applicants for each property. In some cases, renters are offering to pay more than the asking rent or pay one year's rent upfront just to secure a place to live.
Rentals - Availability by Month
This chart shows the average daily number of properties that were for rent by month. As you can see, rental inventory continues to fall. We are at less than half of the level a year ago, a dramatic decrease.
Sales Statistics
Year-to-year prices increased by about 4%.
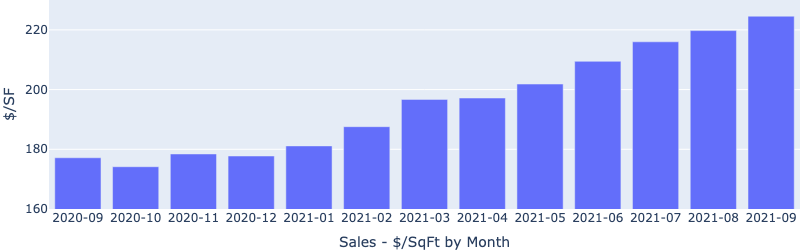
Sales - Median $/SF by Month
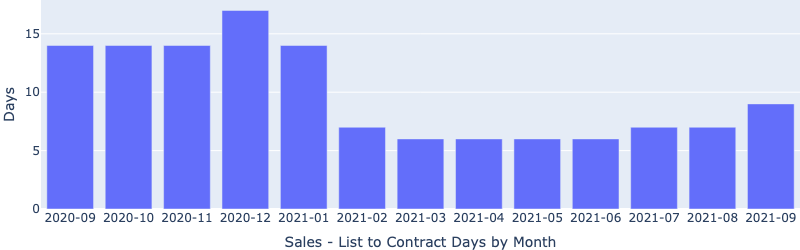
Sales - Median List to Contract Days by Month
Median days on market remains amazingly low for the property profile we target. Properly priced properties go under contract in in 1-3 days and usually with multiple offers.
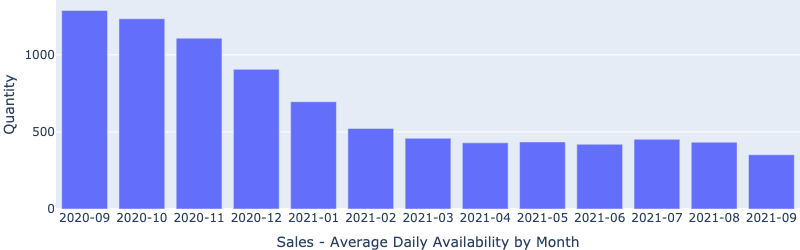
Sales - Availability by Month
This chart shows the average daily number of properties that were for sale by month. Inventory continues to fall and is significantly lower than the same time last year.
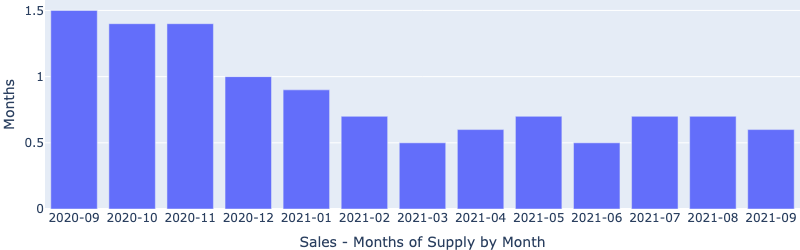
Sales - Months of Supply
Months of supply are just barely over one month! Six months is considered balanced.
Based on the above market statistics, what conclusions would you draw about this market? Do you see any indication of a crash or do you see a consistent trend of rising prices and rents?
The Big Eviction
There are "news" articles about the coming "eviction wave". As usual, the "experts" got it wrong. Their first mistake is that they grouped all tenants together into one basket and made their "prediction". (I've looked for their source data and cannot find it. If someone can point me to the data, please let me know.) I can tell you as an engineer that their approach is invalid. You cannot combine disparate tenant pools into a single group and produce any meaningful information. They also made another error.
When the eviction restrictions end, it is possible that a number of people in C and B Class properties may be evicted. However, what the "experts" seemed to forget is that all these people will still need a place to live. And, all the owners of the C and B Class properties will need tenants. What I believe will happen is closer to musical chairs than a huge wave of vacancies. Evicted tenants will move to the next C or B Class property down the street. And, the people who were evicted from that unit will move to another recently vacated C or B property. So, in the short term, I see the potential for a lot of people shuffling around but not a lot of vacancies.
About the tenant pool we target; to date out of the 160+ client properties we track (out of a total of > 200 properties), 10 tenants have at some point over the last 6 months had trouble paying the full rent on schedule. A relatively small percentage of the total in my opinion. I expect most of these tenants will catch up on their rent in the near future. For example, one of the 10 tenants just paid close to $9,000 to bring their rent current. Paying $9,000 to catch up on the rent is a lot more expensive than moving. However, moving is not the issue, a bad credit report is this tenant pool's fear. A negative hit on their credit will dog them for years. Plus, even if they wanted to move, it is unlikely any property manager with an A Class property will rent to them. There are too many qualified applicants for the property manager to consider anyone who was evicted or skipped out on their lease. So, we do not expect many of the remaining 9 tenants to be evicted. To put this in perspective, out of a population of over 200 properties, we've had a total of 5 evictions in the last 12 years.
Summary
I believe that increasing demand combined with a shortage of inventory will continue to drive the market in a positive direction for the foreseeable future.
Post: Corona Virus Impact to Las Vegas Market
- Real Estate Agent
- Las Vegas, NV
- Posts 736
- Votes 1,509
From the News
- Las Vegas Housing Market (is) "On Fire" With Record Prices Despite Pandemic. This is from the Las Vegas Review Journal.
- Realtor.com stated that Las Vegas is among the top 10 fastest recovering markets since the pandemic onset. Our own statistics says the same.
- Redfin report: More than 27% of Homebuyers Are Searching Out of Town, with Phoenix, Sacramento and Las Vegas the Most Popular Destinations
Market Update
Below are charts from our latest trailing 13 month market statistics, including July data. Remember that this data is only for the property profile that we target, not for the entire metro area.
Rental Statistics
Rental rates posted a significant increase in July, now at the highest level for the last 13 months. Both property managers that we work with are reporting extremely low inventory and multiple applications for most properties.
Rentals - Median $/SF by Month
Rentals - List to Contract Days by Month
The time from list to contract is below 10 days. An amazingly short period of time. There is a lot of demand and little inventory.
Rentals - Availability by Month
The number of rental properties available by month has continued to fall since January. This is likely to continue, which will drive up rental rates.
Sales Statistics
Prices also increased significantly in July, reflecting pent up demand.
Sales - Median $/SF by Month
Sales - Median List to Contract Days by Month
This is an unbelievable chart. 5-7 days is an extremely short time between listing and contract. Properties that we target are going under contract in 1-3 days and with multiple offers.
Sales - Availability by Month
Inventory continued declining in July.
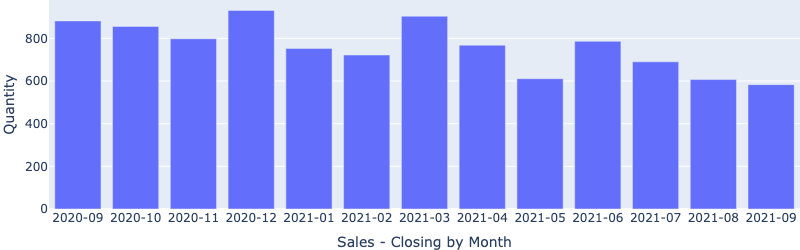
Sales - Closings by Month
Transaction volume increased drastically in July, following an already strong rebound in June. It is now at the highest level since January 2019.
 Sales - Months of Supply
Months of supply continues to drop rapidly.
If you look at these market statistics, you probably would not believe that this is a market in the middle of a major crisis. We think this is due to -
Increasing Demand- COVID-19 sped up changes that may have otherwise taken years. Notably, more and more employers now allow remote workers. This means that people can live where they want and many will flee high-tax states. Some will choose Las Vegas, which will increase demand for rentals and homes. This trend is already showing up in statistics such as the Redfin report.
- Historically low interest rates driving up demand. Most recent rate a client received: 3.125% for a 25% down 30-year fixed investment loan with no points. Low interest rate is a huge advantage for investors since it increases returns and fixes your largest cost permanently. Low interest rates will not be here forever. Economists expectation is that once a coronavirus vaccine is widely available (hopefully within 6 months), the economy will fully recover and interest rates spike.
- The biggest generation in US history, the millennials, are entering the home buying age. Forbes.com: The Great American Housing Boom Has Begun. This is a national trend and will drive up demand for many years to come.
- Despite all the negative news reported, Las Vegas is still in business, even in the gaming sector. See June report published by the Nevada Gaming Control Board. There was still over a million visitors to Las Vegas in June, when it started reopening. Las Vegas has gone through crisis before and each time has transformed itself and thrived.
- Las Vegas has $24B under construction and more is planned (such as a $4B high speed train from Southern California to Las Vegas). This will create thousands of new jobs, many of which will match our target tenant pool.
Below is a chart showing the months of supply for the entire MLS (including new homes). We are at only 2.2 months for July. Not many sellers are putting their homes on the market.
With the pending sales volume rising, the inventory is likely to fall further.
Unlike other major cities, Las Vegas is landlocked, it is surrounded by federal land. Currently there is about 26,000 undeveloped acres in the entire Las Vegas Valley that is not federally owned. See the time lapse below, the brown shaded areas are federal land and not available for development. What land is available for development is being consumed at a rate of about 5,000 acres/Yr. Redevelopment will soon be Las Vegas' only growth path which will drive up prices and rents further.

How We See It
If you've been waiting for the market to decline in the near future, it will likely not happen. The time to act is now. Waiting will likely cost you more to acquire quality properties.
- Record low interest rates will not last. Below is a table comparing return vs. interest rate for the same property. As you can see, the difference in return between a 4.5% rate and a 3.25% rate is almost 2.4%!
| Loan Rate | Return |
|---|---|
| 4.5% | 4.55% |
| 4.0% | 5.52% |
| 3.5% | 6.47% |
| 3.25% | 6.93% |
- Prices will only increase. I have never heard of a situation when an increasing number of people bid on a small set of resources where the price did not increase. Now is the time to ride the appreciation and rent growth curve.
- Time to rent for the properties we target is very low with most properties getting multiple applicants.
- Our target tenant pool is performing even during the pandemic. Out of about 160 of ours and our clients class A properties, a total of 10 tenants have experienced issues with paying the rent at some point during the last 4 months. However, Class C or D properties are a very different story.
Based on everything we see today, Las Vegas should continue to do well long term and continues to be one of the best locations for long-term buy and hold investments.
Post: High Appreciation vs. High Cash Flow... What's your pick?
- Real Estate Agent
- Las Vegas, NV
- Posts 736
- Votes 1,509
Hello @Matt Camilliere,
An excellent question, one that more people should consider. Before I tell you my preference between cash flow and appreciation, I want to talk about what determines prices, and that is demand. Demand is a function of the imbalance between buyers and sellers. Where there are more buyers than sellers, prices rise until the number of buyers and sellers match. Where there are more sellers than buyers, prices fall until the number of buyers and sellers match. Demand is what makes the property on the left worth $80,000 and the property on the right $2,500,000.

I've talked about demand and prices, but what about rent? There is a relationship between prices and rents. The studies I've read state that rents lag prices by 2 to 10 years. Market conditions like you mentioned are real world examples of rents lagging prices. See the image below.

High Appreciation, Little or No Cash Flow
With rising demand, the current rents reflect property prices from 2 to 10 years ago. The result is that prices are high and there is little or no cashflow, as you are seeing in Austin. However, if you hold the property long enough, rents should rise and eventually the property generates a positive cash flow. You just have to be willing to keep losing money every month until such time as rents rise sufficiently.
When you buy an investment property in such a market, you are actually gambling that in the future, you will be able to sell the property for significantly more than you paid for it. Be certain to consider the cost to sell (7% to 8% of sales price) and long term capital gains taxes in your calculations. Also consider what you would do if it took many more years than you expected before rents rose enough to cover all your operating expenses. There is no guarantee that prices (and rents) will always rise.
High Cash Flow, Little or No Appreciation
With falling demand, the current rents also reflect prices from 2 to 10 years ago, when property prices were higher (in inflation adjusted dollars). The result is that property prices are low compared to the past so there is high cashflow. While such properties generate a high initial cash flow, if prices and rents are not rising at or above the rate of inflation, rents and prices are likely falling in inflation adjusted dollars. What does this mean to you?
Dollar bills, by themselves, are worth nothing. The value of dollar bills is what you can exchange these dollars for. What complicates things is inflation. Inflation is continuously eroding the buying power of dollars. You see the effect of inflation when you go to the grocery store. Each year, it costs more dollars to buy the same basket of goods. To highlight the impact of inflation, I created the image below. The numbers are from the CPI Inflation Calculator by Bureau of Labor Statistics.

As the chart shows, you need $103 in 2019 to buy the same basket of goods you bought for $50 in 1990. How does this apply to rent? If you rented a property in a high cash flow market (with little or no appreciation) in 2015 for $900/Mo., you would need to receive $993 in 2019 just to maintain the same buying power. If the 2019 rent is less than $993 , your rent actually declined in inflation adjusted dollars. However, by definition there is little or no appreciation in high cash flow markets (or they would not be high cash flow markets) so over time the inflation adjusted cash flow (buying power) will decline.
My Preference
There are markets where you can get a positive cash flow today and strong appreciation. This is my personal preference. I created the graphic below to illustrate the effect inflation has on (inflation adjusted) cash flow. If the appreciation rate is less than inflation, rent in buying power is declining. If appreciation is above the rate of inflation, buying power of the rent you will receive is increasing.

Even though you start with a lower cash flow in a more balanced market, it does not take many years to have a higher real cash flow (buying power) than the high cash flow property. Since your major cost is fixed, as rents increase so does your return, as illustrated below.

Matt, I hope this helps.
Post: Tell me why I’m wrong! Classic SF vs MF debate
- Real Estate Agent
- Las Vegas, NV
- Posts 736
- Votes 1,509
Hello @Account Closed,
Interesting comments. A few considerations:
- If you have a good investment team, you can live where you want and invest where you can make money. Of the large number of clients we deal with, only 3 or 4 live in Las Vegas. The rest live in other states (California mostly) and other countries (mostly Hong Kong or Singapore). We have never met half of our clients and many have never been to Las Vegas.
- Our clients experience:
- Typical tenant stay, approximately 5 years.
- Average turn cost: $500 to $700. We have had one or two occurrences of the type you describe in the last 10+ years. The property manager filed collections on the tenants and sooner or later they paid the monies owed. They have to because until they clear the lien, they cannot buy a car, rent another place, etc. This is another advantage of credit dependent tenants.
- Average annual maintenance + vacancy cost: <3%
- Except for 3 properties, all are professionally managed. I am a realtor, have extensive experience with investment real estate and I own properties in town. I would NEVER consider self management, I can't afford the lower ROI. Without a skilled property manager, the odds of getting bad or marginal tenants are high. There are people who watch Craigs list and similar sites looking for self managed properties. They do this because they have a bad track record and know that a property manager would not approve them. Also, people who do not have a depth of experience managing tenants are gullible and are easy to take advantage of.
- Number of evictions in +10 years, 4. Maybe more by the time COVID-19 is over. At this time, we have 5 tenants having problems or motivations paying rent out of the +160 properties.
Thoughts:
- I believe the difference between your experience and our clients experience is the tenant pool. If you target the right tenant pool, your result will be similar to ours.
- If you are not getting what you need from the property manager, you need a different property manager. The ones we work with provide a range of services including: for each property under consideration, they review and provide an opinion on: rent, time to rent, rehab items; they screen and select good tenants (we have an actual definition of a “good” tenant); they make sure repairs are done timely, etc.
- On selling the 5 bedroom house for $280,000. It depends on when you sold it and where the property was located. $280,000 could have been an outstanding price or a terrible price. It all depends.
- On multi-family always have better ROI, not in our experience or the people we know who own such properties. On paper, they do exceedingly well. However, once you take into account issues like:
- Maintenance cost - The average age of a Las Vegas 4-plex is about 40 years and the low income tenant pool is very hard on these properties. Plus, you have 4x the systems to maintain: 4 HVACs, 4 water heaters, 4 refrigerators, etc.
- Skips and evictions. The average tenant stay with such C class properties is under 1 year.
- Turn cost for a 4-plex unit is between $1,000 and $2,000.
- The Las Vegas multi-family properties are at best C class and in high crime areas so the tenant pool is limited to low income cash based tenants. There is very little ability to raise rents.
Your actual return (including all expenses) is no better and probably lower than a single family home that targets a good tenant pool. Another factor to consider with multi-family is that investors do not sell performing assets. So far, every 4-plex I’ve investigated in the last +14 years was losing money. The only question was why and whether we could turn the situation around.
In fairness, when I owned 4-plexes in Atlanta, they were -A or +B properties and they were profitable properties with little hassle due to the tenant pool. The ones I owned in Houston were C class and I had to do my own maintenance and only broke even after tax advantages.
In summary:
- With a good investment team in place, your involvement is minimal so you can invest where you can make the most money.
- If you target the right tenant pool, your tenants stay a long time, pay the rent on schedule and take care of the properties and you will get a higher return.
- If you are not getting a lot of services from your property manager, you need a new property manager.
Anyway, this is my $0.02.
Whether to buy single family or multi family is a spreadsheet decision. Run the numbers taking into consideration of all costs and see which one better supports your goal. There is no “better” property type. Also, today the best deal might be a condo. Next time a multi-family and time after that a single family. Do not limit your profit based on popular dogma.
@Account Closed
I read your last comment and I see you are basing your comments on GRM. GRM does not include expenses such as debt service, state income tax, property taxes, management, insurance, and utilities, etc. It is simply Property Price / Gross Annual Rental Income. This tells you little or nothing about a property's actual financial performance. You must include all costs in your calculations including debt services, taxes, turn costs, skips, evictions, property damage, management, rehab cost, everything, in order to know how the property actually performs.
Post: Corona Virus Impact to Las Vegas Market
- Real Estate Agent
- Las Vegas, NV
- Posts 736
- Votes 1,509
Hello @Noam Ofan,
The simple answer is that we target families of mission critical employees in companies that have performed well and are likely to perform well in the future. Not really much of an answer, so I decided to explain an approach you could use to determine such a tenant pool. However, keep in mind that the tenant pool is only 1/3 of what is required for a performing target tenant pool. See the image below.

A tenant pool that performs in good times and bad is a combination of three factors. In order of importance:
- Location - Unless appreciation is greater than the rate of inflation, your actual income (buying power) is declining.
- Jobs - If your tenant pool is not employed at the same or higher income, they cannot pay the rent. So, unless new companies are creating jobs that match the income and skills of your tenants, rents will decline or, at best, not increase. Companies only last a few years and when they die, the jobs die too. The typical life-span of a company is 10 years. The typical life-span of an S&P 500 company is only 18 years. So, every non-government job in every location will probably end within 10 to 18 years, in the best situation. Unless new companies are opening up operations in the location, all that remains over time are lower paying service sector jobs. When pay declines, rents follow.
- Tenant Pool - Selecting a tenant pool that performs mission critical jobs (the actual workers who deliver income) is critical. In times of economic stress, everyone else is expendable. Low skilled hourly workers are the first to be laid off and the last to be rehired (typical C Class properties). High end jobs that are not directly producing income are vulnerable too.
So, assuming you selected a location where appreciation is greater than inflation, job creation is ongoing and population is increasing, how would you find the “mission critical” jobs of the major employers? Conceptually, it is easy. Determine the people doing the “mission” of the company. For example:
- In a pharmacy, the pharmacist.
- In an auto repair shop, the mechanic.
- In a medical clinic, the doctors.
In practice, it is more difficult. We did a lot of analysis to pinpoint our target tenant pool. One example, we ran heat maps of the Las Vegas valley that showed how many years tenants stayed. The result looked something like the image below; green for the longest and red for the shortest. This is not the actual heat map, the real heat map is far more detailed and complex. In 2006 time frame when I started the research, the rent range for tenants that stayed multiple years was $900 - $1400, now is more like $1200 - $2000.

How could you approximate what we did? By interviewing multiple local property managers. A starting point on the questions you would ask all property managers:
I hope this helps. If not, ping back and I will do my best to answer.