Indian Rocks Beach, FL Investment Properties for Sale
Browse homes for sale and investment properties in Indian Rocks Beach, FL. Refine your search by price, property type, or more.
Best cash flowing properties in Indian Rocks Beach, FL
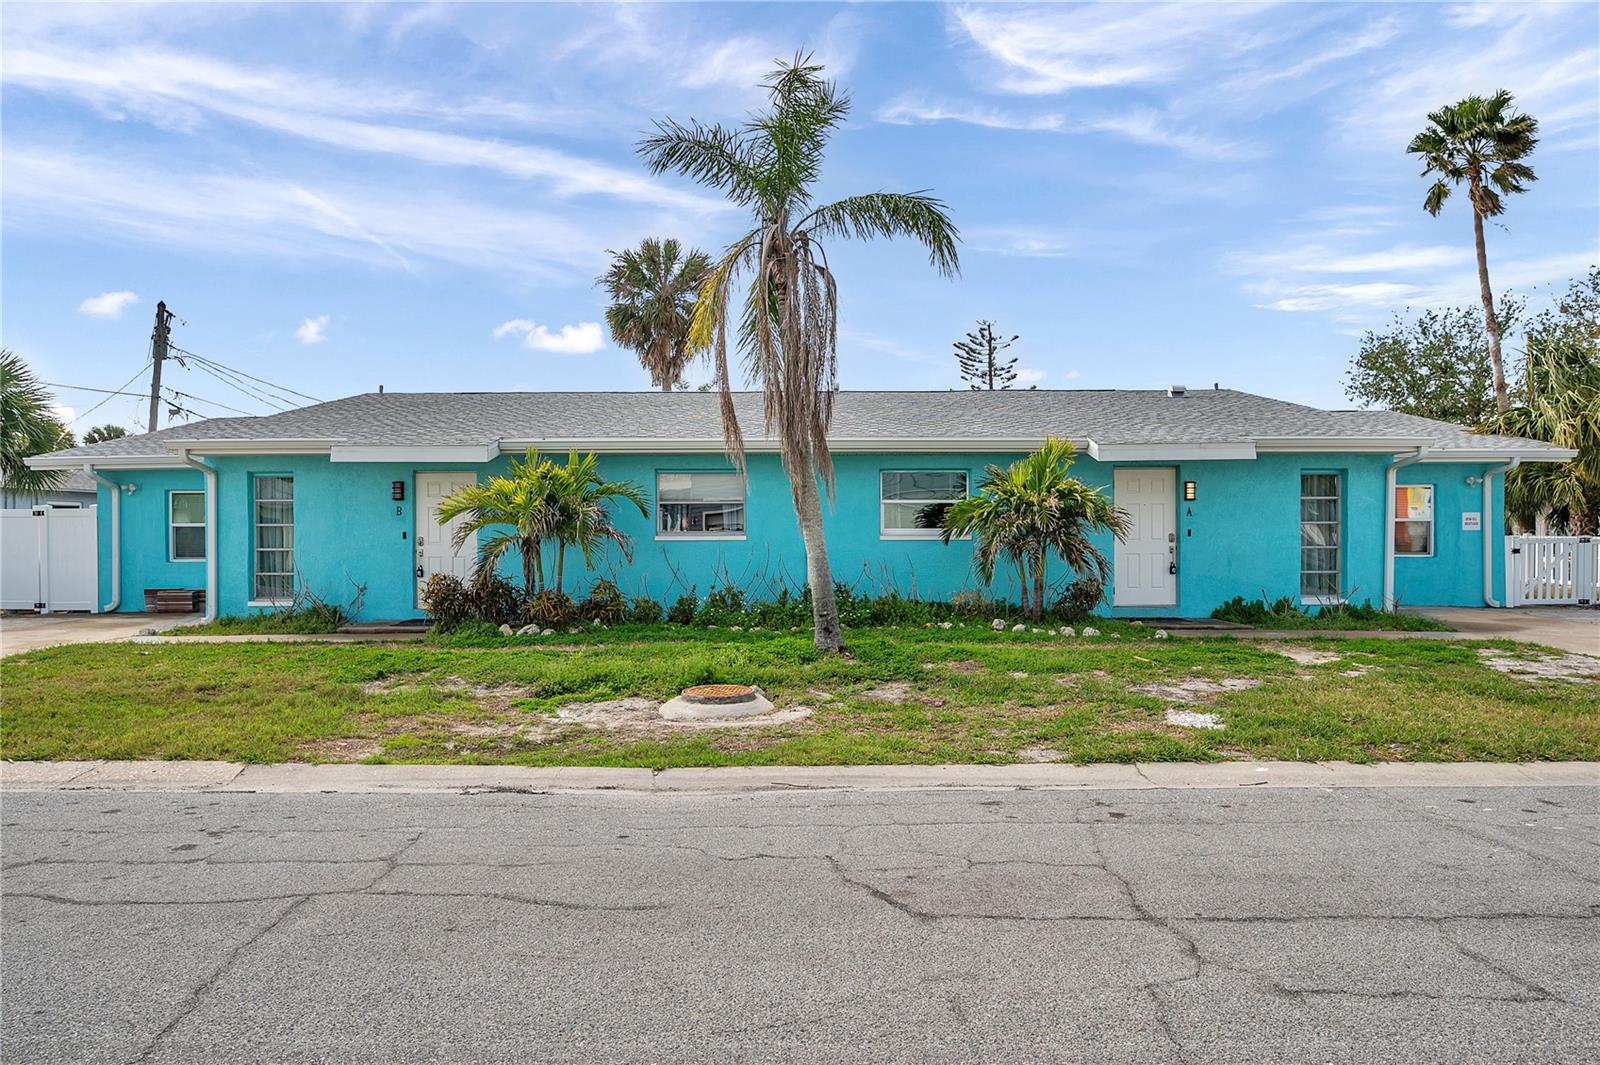
$499,999
3
bds
|
2
ba
|
1,252
sqft
|
built
1974
1214 Bay Shore Blvd, Indian Rocks Beach, FL 33785
$-176
Cash flow
-1.8%
Cash-on-Cash Return
5.7%
Cap rate
0.7%
Rent to Value Ratio
$599,000
2
bds
|
2
ba
|
1,465
sqft
|
built
1993
657 Garland Cir, Indian Rocks Beach, FL 33785
$-241
Cash flow
-2.1%
Cash-on-Cash Return
5.7%
Cap rate
0.7%
Rent to Value Ratio
36 out of 92 properties for sale in Indian Rocks Beach, FL
Limited Results Shown
Create a free account, or log in to reveal all property listings and enjoy the complete experience.
$499,999
3
bds
|
2
ba
|
1,252
sqft
|
built
1974
1214 Bay Shore Blvd, Indian Rocks Beach, FL 33785
$-176
Cash flow
-1.8%
Cash-on-Cash Return
5.7%
Cap rate
0.7%
Rent to Value Ratio
$549,000
2
bds
|
1
ba
|
936
sqft
|
built
1952
122 10th Ave, Indian Rocks Beach, FL 33785
$-1,448
Cash flow
-13.8%
Cash-on-Cash Return
3.0%
Cap rate
0.5%
Rent to Value Ratio

$2,555,000
32
bds
|
32
ba
|
3,512
sqft
|
built
1981
1809 Gulf Blvd, Indian Rocks Beach, FL 33785
$-11,262
Cash flow
-23.0%
Cash-on-Cash Return
0.9%
Cap rate
0.1%
Rent to Value Ratio
$1,200,000
bds
|
0
ba
|
1,776
sqft
|
built
1950
1803 Bay Blvd, Indian Rocks Beach, FL 33785
$-6,171
Cash flow
-26.8%
Cash-on-Cash Return
0.0%
Cap rate
0.2%
Rent to Value Ratio

$1,200,000
bds
|
0
ba
|
2,680
sqft
|
built
1958
1801 Bay Blvd, Indian Rocks Beach, FL 33785
$-5,456
Cash flow
-23.7%
Cash-on-Cash Return
0.7%
Cap rate
0.3%
Rent to Value Ratio

$1,599,000
3
bds
|
2
ba
|
1,745
sqft
|
built
1959
366 La Hacienda Dr, Indian Rocks Beach, FL 33785
$-3,874
Cash flow
-12.6%
Cash-on-Cash Return
3.2%
Cap rate
0.4%
Rent to Value Ratio
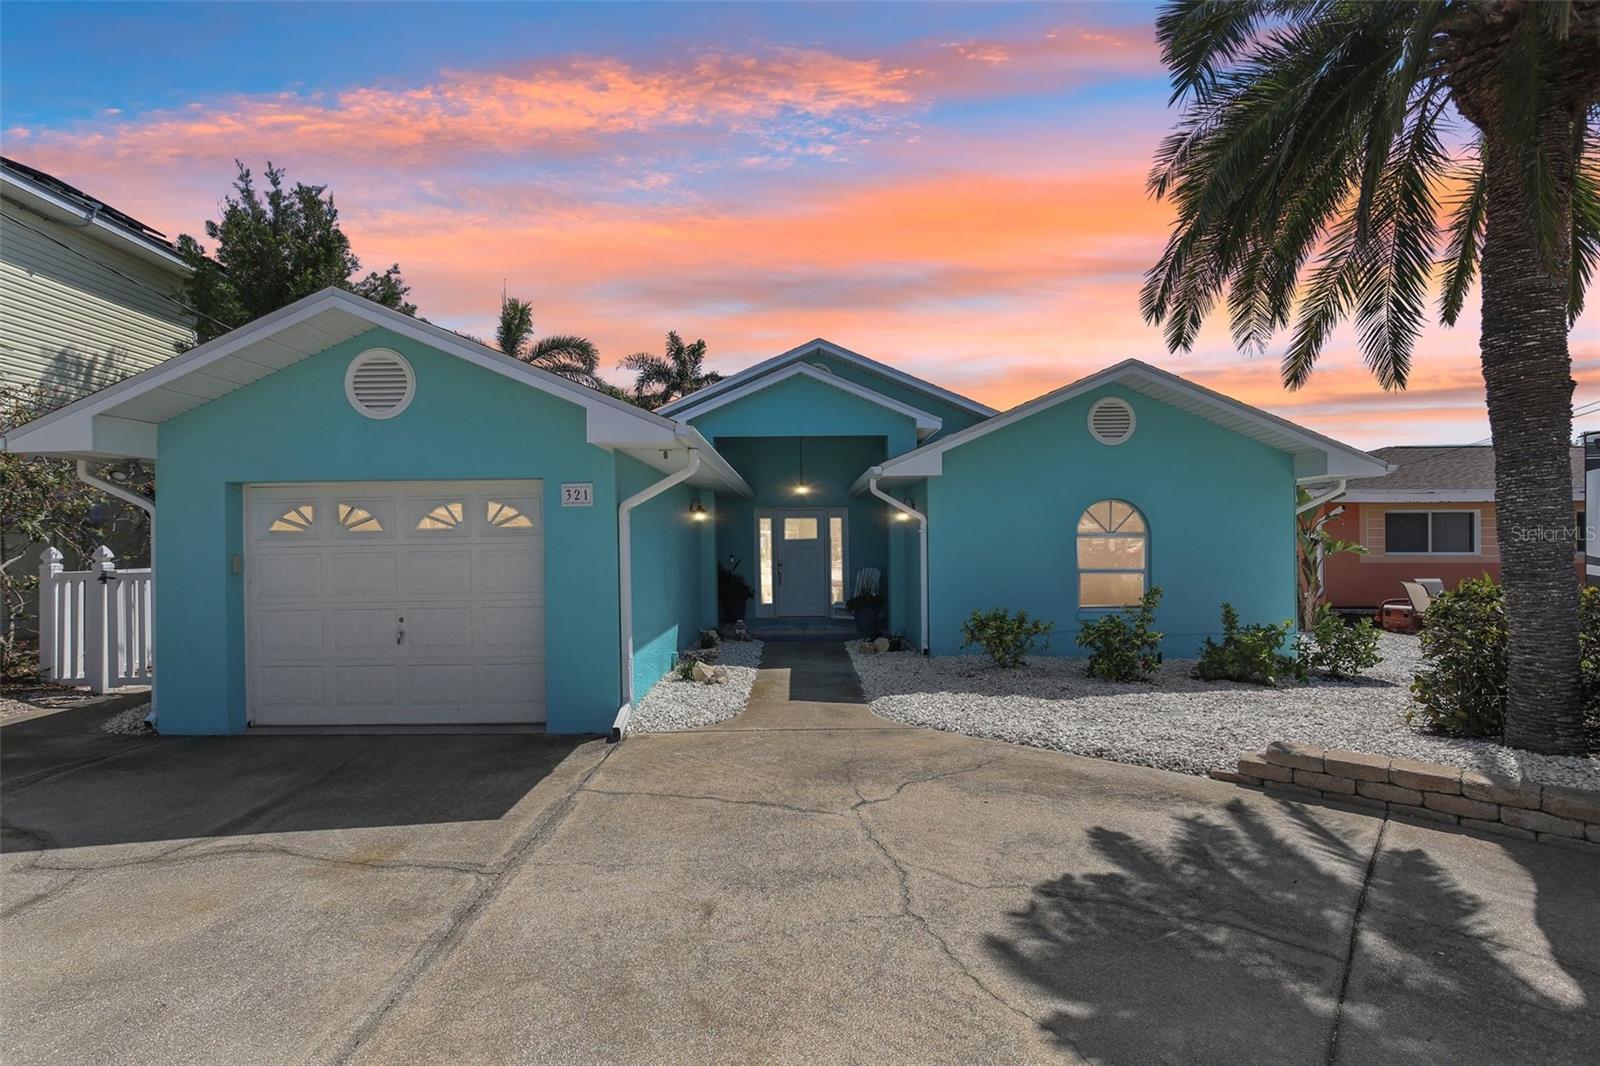
$1,050,000
2
bds
|
2
ba
|
1,745
sqft
|
built
1957
321 Bahia Vista Dr, Indian Rocks Beach, FL 33785
$-2,113
Cash flow
-10.5%
Cash-on-Cash Return
3.7%
Cap rate
0.5%
Rent to Value Ratio

$549,000
3
bds
|
2
ba
|
1,566
sqft
|
built
1994
615 Garland Cir, Indian Rocks Beach, FL 33785
$-2,026
Cash flow
-19.3%
Cash-on-Cash Return
1.7%
Cap rate
0.6%
Rent to Value Ratio

$559,000
3
bds
|
2
ba
|
1,233
sqft
|
built
1959
125 11th Ave, Indian Rocks Beach, FL 33785
$-1,452
Cash flow
-13.6%
Cash-on-Cash Return
3.0%
Cap rate
0.6%
Rent to Value Ratio
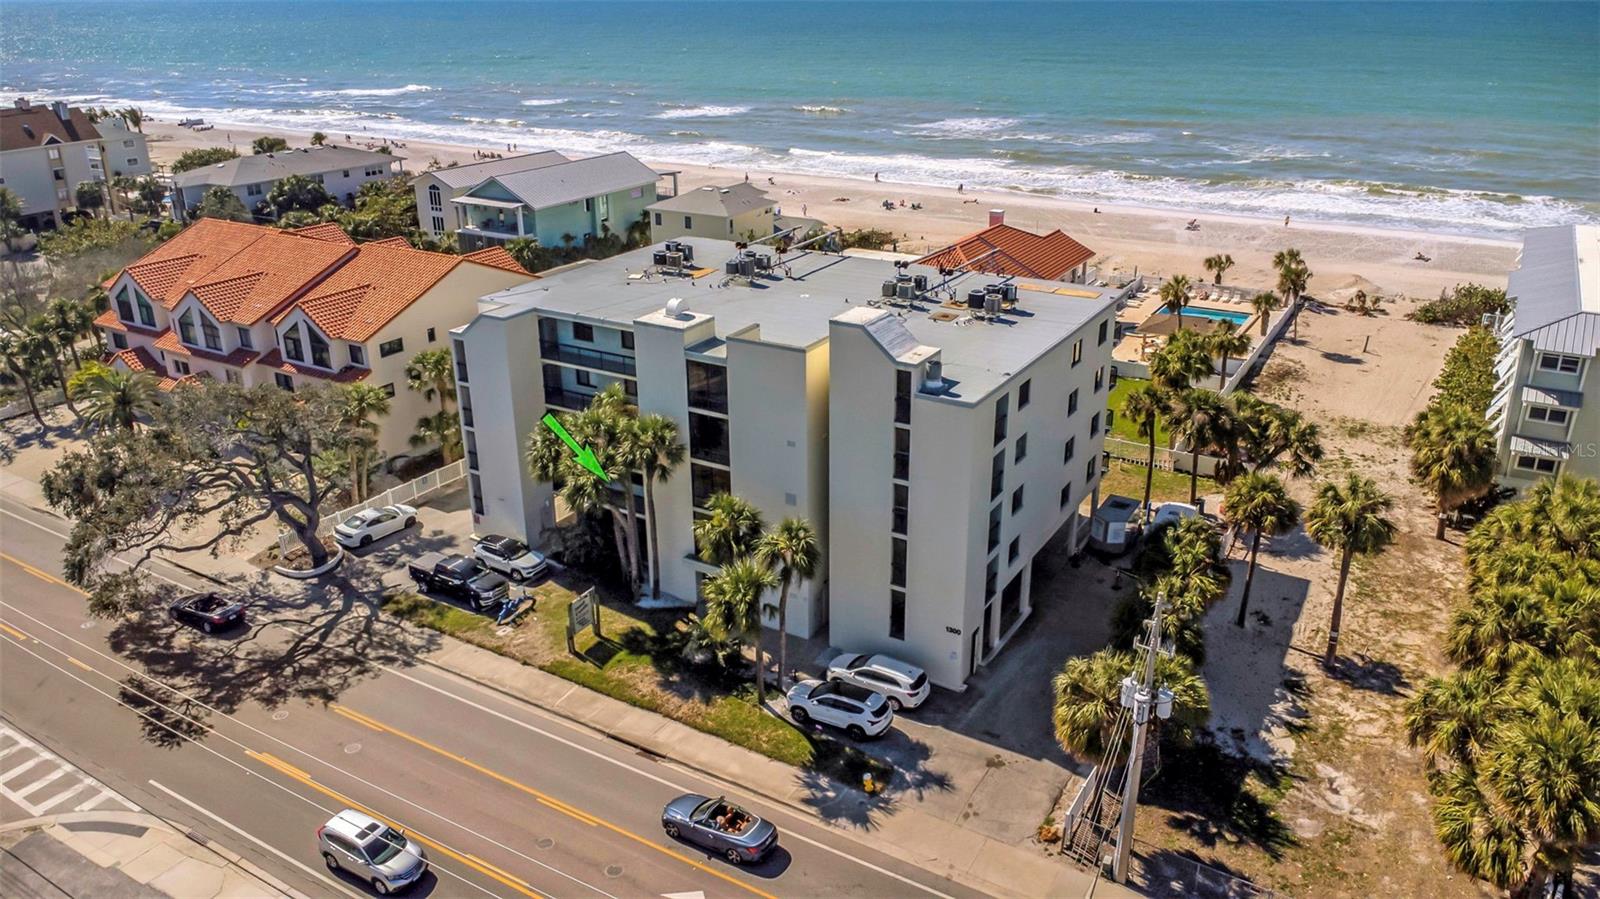
$929,000
3
bds
|
2
ba
|
1,235
sqft
|
built
1983
1300 Gulf Blvd, Indian Rocks Beach, FL 33785
$-3,455
Cash flow
-19.4%
Cash-on-Cash Return
1.7%
Cap rate
0.5%
Rent to Value Ratio
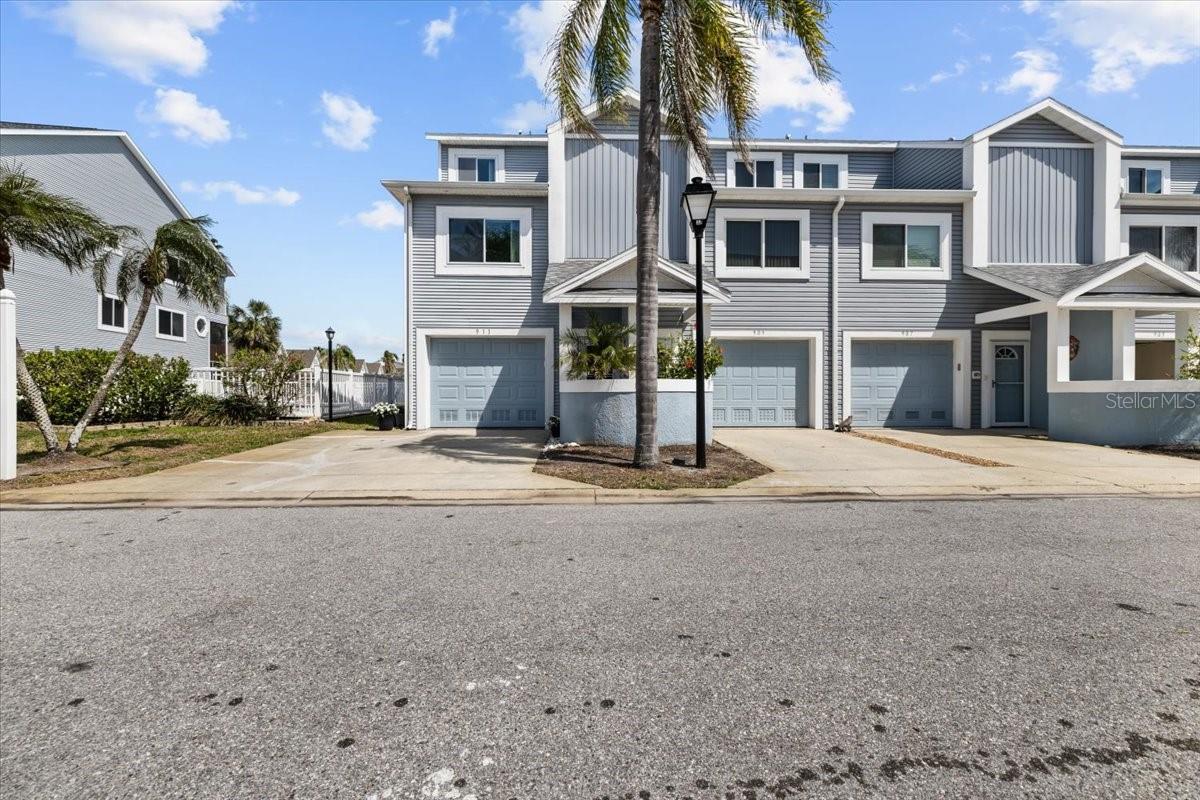
$749,000
3
bds
|
3
ba
|
1,616
sqft
|
built
1993
911 Harbour House Dr, Indian Rocks Beach, FL 33785
$-2,101
Cash flow
-14.6%
Cash-on-Cash Return
2.8%
Cap rate
0.5%
Rent to Value Ratio
$900,000
3
bds
|
3
ba
|
1,330
sqft
|
built
1982
2515 Bay Blvd, Indian Rocks Beach, FL 33785
$-3,502
Cash flow
-20.3%
Cash-on-Cash Return
1.5%
Cap rate
0.4%
Rent to Value Ratio
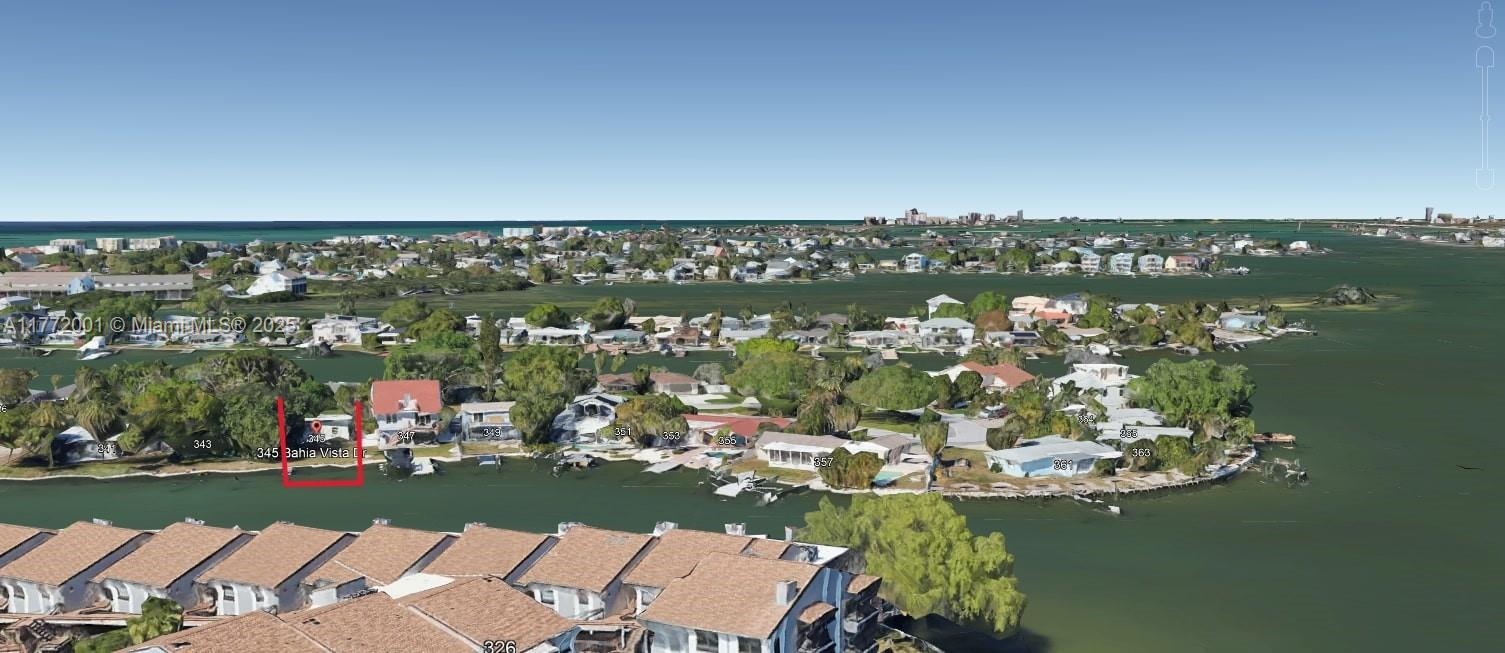
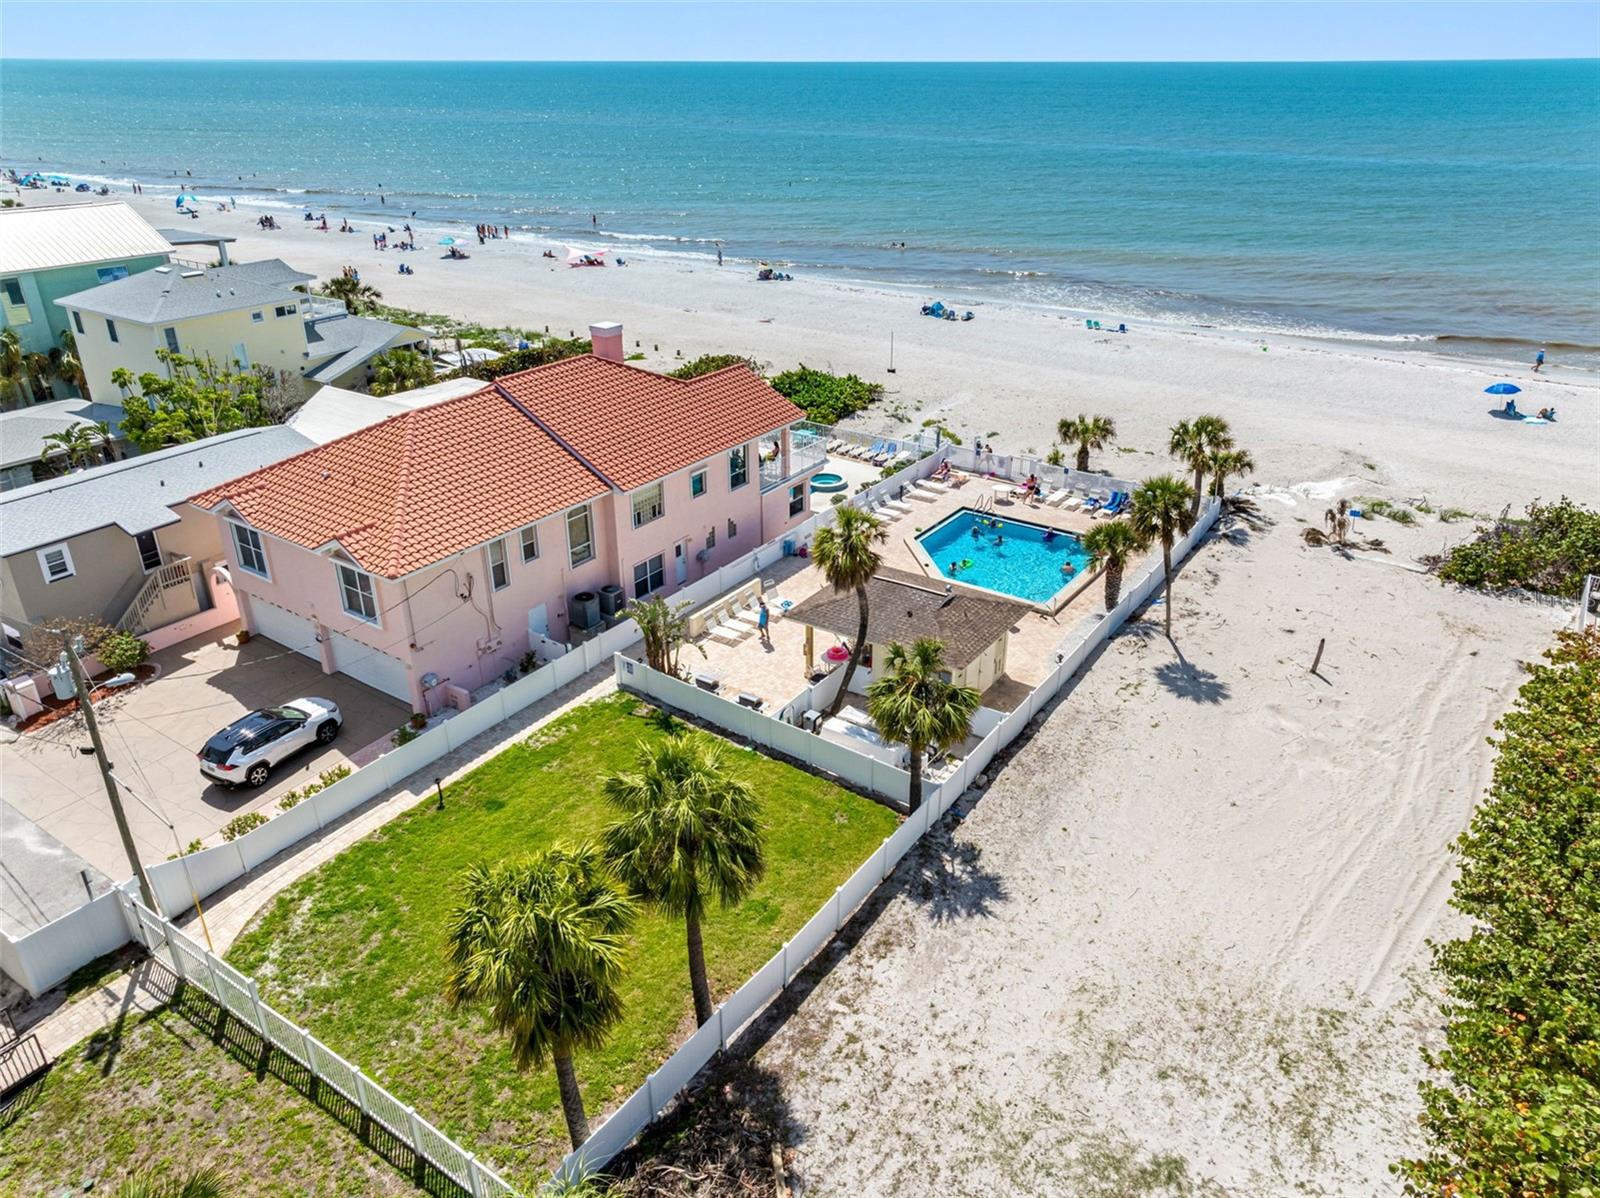
$825,000
2
bds
|
1
ba
|
0
sqft
|
built
1955
345 Bahia Vista Dr, Indian Rocks Beach, FL 33785
$-2,973
Cash flow
-18.8%
Cash-on-Cash Return
1.8%
Cap rate
0.3%
Rent to Value Ratio
$1,750,000
bds
|
0
ba
|
2,506
sqft
|
built
1940
2116 1st St, Indian Rocks Beach, FL 33785
$-6,711
Cash flow
-20.0%
Cash-on-Cash Return
1.5%
Cap rate
0.3%
Rent to Value Ratio

$890,000
3
bds
|
2
ba
|
1,166
sqft
|
built
1959
1008 1st St, Indian Rocks Beach, FL 33785
$-2,918
Cash flow
-17.1%
Cash-on-Cash Return
2.2%
Cap rate
0.4%
Rent to Value Ratio
$1,490,000
3
bds
|
3
ba
|
2,290
sqft
|
built
1956
1101 Bay Pine Blvd, Indian Rocks Beach, FL 33785
$-5,066
Cash flow
-17.7%
Cash-on-Cash Return
2.1%
Cap rate
0.4%
Rent to Value Ratio

$1,149,000
3
bds
|
3
ba
|
1,680
sqft
|
built
2011
112 13th Ave, Indian Rocks Beach, FL 33785
$-3,050
Cash flow
-13.8%
Cash-on-Cash Return
3.0%
Cap rate
0.4%
Rent to Value Ratio
$960,000
3
bds
|
2
ba
|
975
sqft
|
built
1981
812 Gulf Blvd, Indian Rocks Beach, FL 33785
$-3,416
Cash flow
-18.6%
Cash-on-Cash Return
1.9%
Cap rate
0.4%
Rent to Value Ratio

$849,900
3
bds
|
2
ba
|
1,471
sqft
|
built
1978
119 13th Ave, Indian Rocks Beach, FL 33785
$-2,288
Cash flow
-14.0%
Cash-on-Cash Return
2.9%
Cap rate
0.5%
Rent to Value Ratio

$800,000
2
bds
|
1
ba
|
1,028
sqft
|
built
1950
300 16th Ave, Indian Rocks Beach, FL 33785
$-2,085
Cash flow
-13.6%
Cash-on-Cash Return
3.0%
Cap rate
0.4%
Rent to Value Ratio

$1,150,000
8
bds
|
4
ba
|
1,650
sqft
|
built
1983
725 1st St, Indian Rocks Beach, FL 33785
$-4,487
Cash flow
-20.4%
Cash-on-Cash Return
1.5%
Cap rate
0.3%
Rent to Value Ratio
$1,250,000
4
bds
|
3
ba
|
2,200
sqft
|
built
2024
2200 Bay Blvd, Indian Rocks Beach, FL 33785
$-1,711
Cash flow
-7.1%
Cash-on-Cash Return
4.5%
Cap rate
0.7%
Rent to Value Ratio
$835,000
2
bds
|
2
ba
|
1,380
sqft
|
built
1982
74 Gulf Blvd, Indian Rocks Beach, FL 33785
$-1,375
Cash flow
-8.6%
Cash-on-Cash Return
4.2%
Cap rate
0.6%
Rent to Value Ratio
$999,000
3
bds
|
2
ba
|
1,200
sqft
|
built
1983
1300 Gulf Blvd, Indian Rocks Beach, FL 33785
$-4,272
Cash flow
-22.3%
Cash-on-Cash Return
1.0%
Cap rate
0.4%
Rent to Value Ratio
$1,800,000
8
bds
|
4
ba
|
3,112
sqft
|
built
1972
2011 1st St, Indian Rocks Beach, FL 33785
$-6,627
Cash flow
-19.2%
Cash-on-Cash Return
1.7%
Cap rate
0.3%
Rent to Value Ratio
$2,500,000
5
bds
|
5
ba
|
3,281
sqft
|
built
1985
330 6th Ave, Indian Rocks Beach, FL 33785
$-8,150
Cash flow
-17.0%
Cash-on-Cash Return
2.2%
Cap rate
0.4%
Rent to Value Ratio

$830,000
2
bds
|
2
ba
|
1,275
sqft
|
built
1981
900 Gulf Blvd, Indian Rocks Beach, FL 33785
$-1,721
Cash flow
-10.8%
Cash-on-Cash Return
3.7%
Cap rate
0.6%
Rent to Value Ratio

$795,000
2
bds
|
2
ba
|
1,380
sqft
|
built
1982
74 Gulf Blvd, Indian Rocks Beach, FL 33785
$-2,305
Cash flow
-15.1%
Cash-on-Cash Return
2.7%
Cap rate
0.6%
Rent to Value Ratio

$5,900,000
4
bds
|
5
ba
|
4,728
sqft
|
built
1989
1522 Gulf Blvd, Indian Rocks Beach, FL 33785
$-26,387
Cash flow
-23.3%
Cash-on-Cash Return
0.8%
Cap rate
0.1%
Rent to Value Ratio
$380,000
3
bds
|
2
ba
|
1,300
sqft
|
built
1976
1 Windrush Blvd, Indian Rocks Beach, FL 33785
$-1,382
Cash flow
-19.0%
Cash-on-Cash Return
1.8%
Cap rate
0.8%
Rent to Value Ratio
$599,000
2
bds
|
2
ba
|
1,465
sqft
|
built
1993
657 Garland Cir, Indian Rocks Beach, FL 33785
$-241
Cash flow
-2.1%
Cash-on-Cash Return
5.7%
Cap rate
0.7%
Rent to Value Ratio
$484,900
3
bds
|
3
ba
|
1,390
sqft
|
built
1980
318 Windrush Blvd, Indian Rocks Beach, FL 33785
$-1,361
Cash flow
-14.6%
Cash-on-Cash Return
2.8%
Cap rate
0.7%
Rent to Value Ratio
$549,900
2
bds
|
3
ba
|
1,390
sqft
|
built
1983
322 Windrush Blvd, Indian Rocks Beach, FL 33785
$-563
Cash flow
-5.3%
Cash-on-Cash Return
4.9%
Cap rate
0.7%
Rent to Value Ratio

$514,900
2
bds
|
1
ba
|
920
sqft
|
built
1980
2109 Gulf Blvd, Indian Rocks Beach, FL 33785
$-869
Cash flow
-8.8%
Cash-on-Cash Return
4.1%
Cap rate
0.6%
Rent to Value Ratio
$325,000
1
bds
|
1
ba
|
598
sqft
|
built
1972
2704 2nd St, Indian Rocks Beach, FL 33785
$-787
Cash flow
-12.6%
Cash-on-Cash Return
3.2%
Cap rate
0.6%
Rent to Value Ratio
$424,000
2
bds
|
3
ba
|
1,390
sqft
|
built
1980
320 Windrush Blvd, Indian Rocks Beach, FL 33785
$-434
Cash flow
-5.3%
Cash-on-Cash Return
4.9%
Cap rate
0.8%
Rent to Value Ratio