$960,000
Investment Summary
- Monthly Cash Flow
- -$3,416
- Cap Rate
- 1.9%
- Cash-on-Cash Return
- -18.6%
- Debt Coverage Ratio
- 0.31
- Internal Rate of Return (5 years)
- -13.9%
Cash Flow
Net Operating Income (NOI) minus mortgage payments.
Calculation:
NOI - Mortgage Payments
Cap Rate (Market Value)
Capitalization Rate is a rate of return that compares the yearly Net Operating Income (NOI) to the market value.
Calculation:
NOI / Market Value
Cash-on-Cash Return (CoC)
Annual cash flow divided by initial cash invested.
Calculation:
Annual Cash Flow / Cash Invested
Debt Coverage Ratio (DCR)
Net Operating Income (NOI) divided by total debt payments.
Calculation:
NOI / Total Debt Payments
Internal Rate of Return (IRR)
A metric for assessing profitability over time. IRR is the discount rate at which the net present value (NPV) of all future cash flows (positive and negative) from an investment equals zero — including both periodic cash flow (such as rent) and a projected sale at the end of the holding period. It represents the expected annualized return, accounting for income, expenses, and the recovery of capital through a future sale.
Calculation:
(Future Value / Present Value) ** (1 / Years) - 1
Property Description
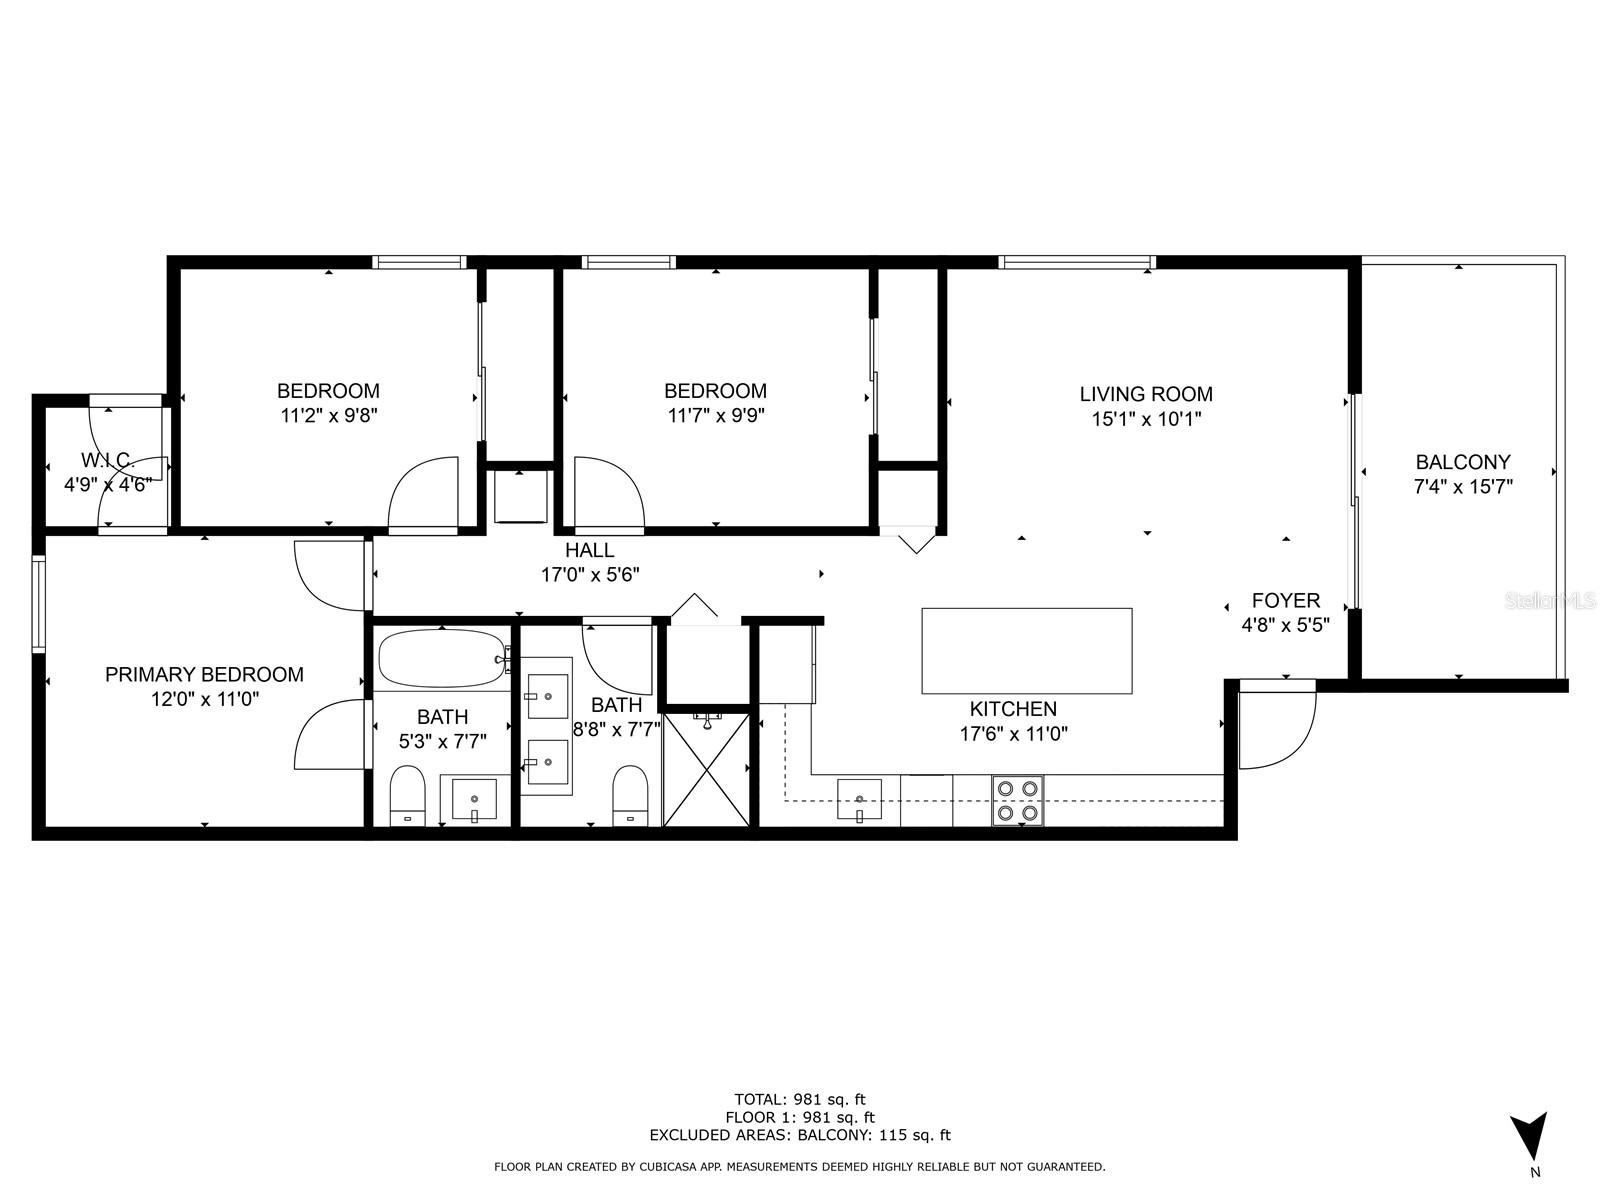
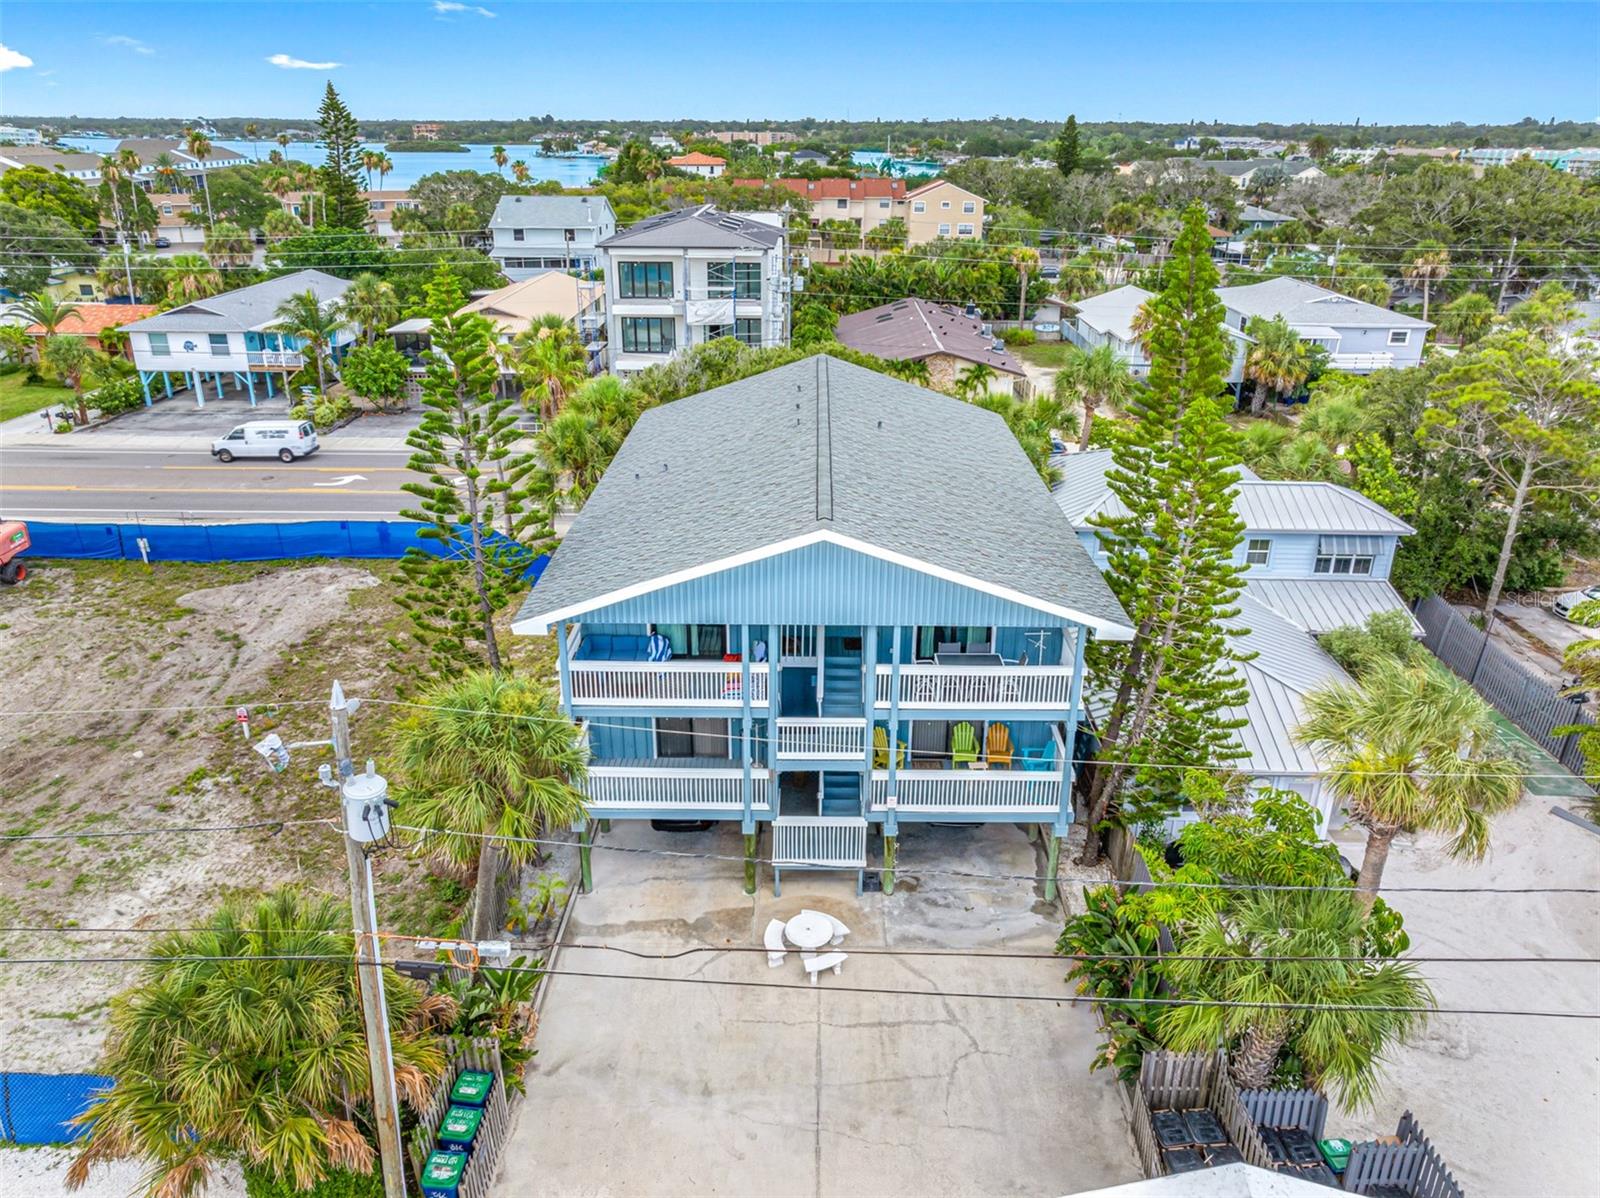
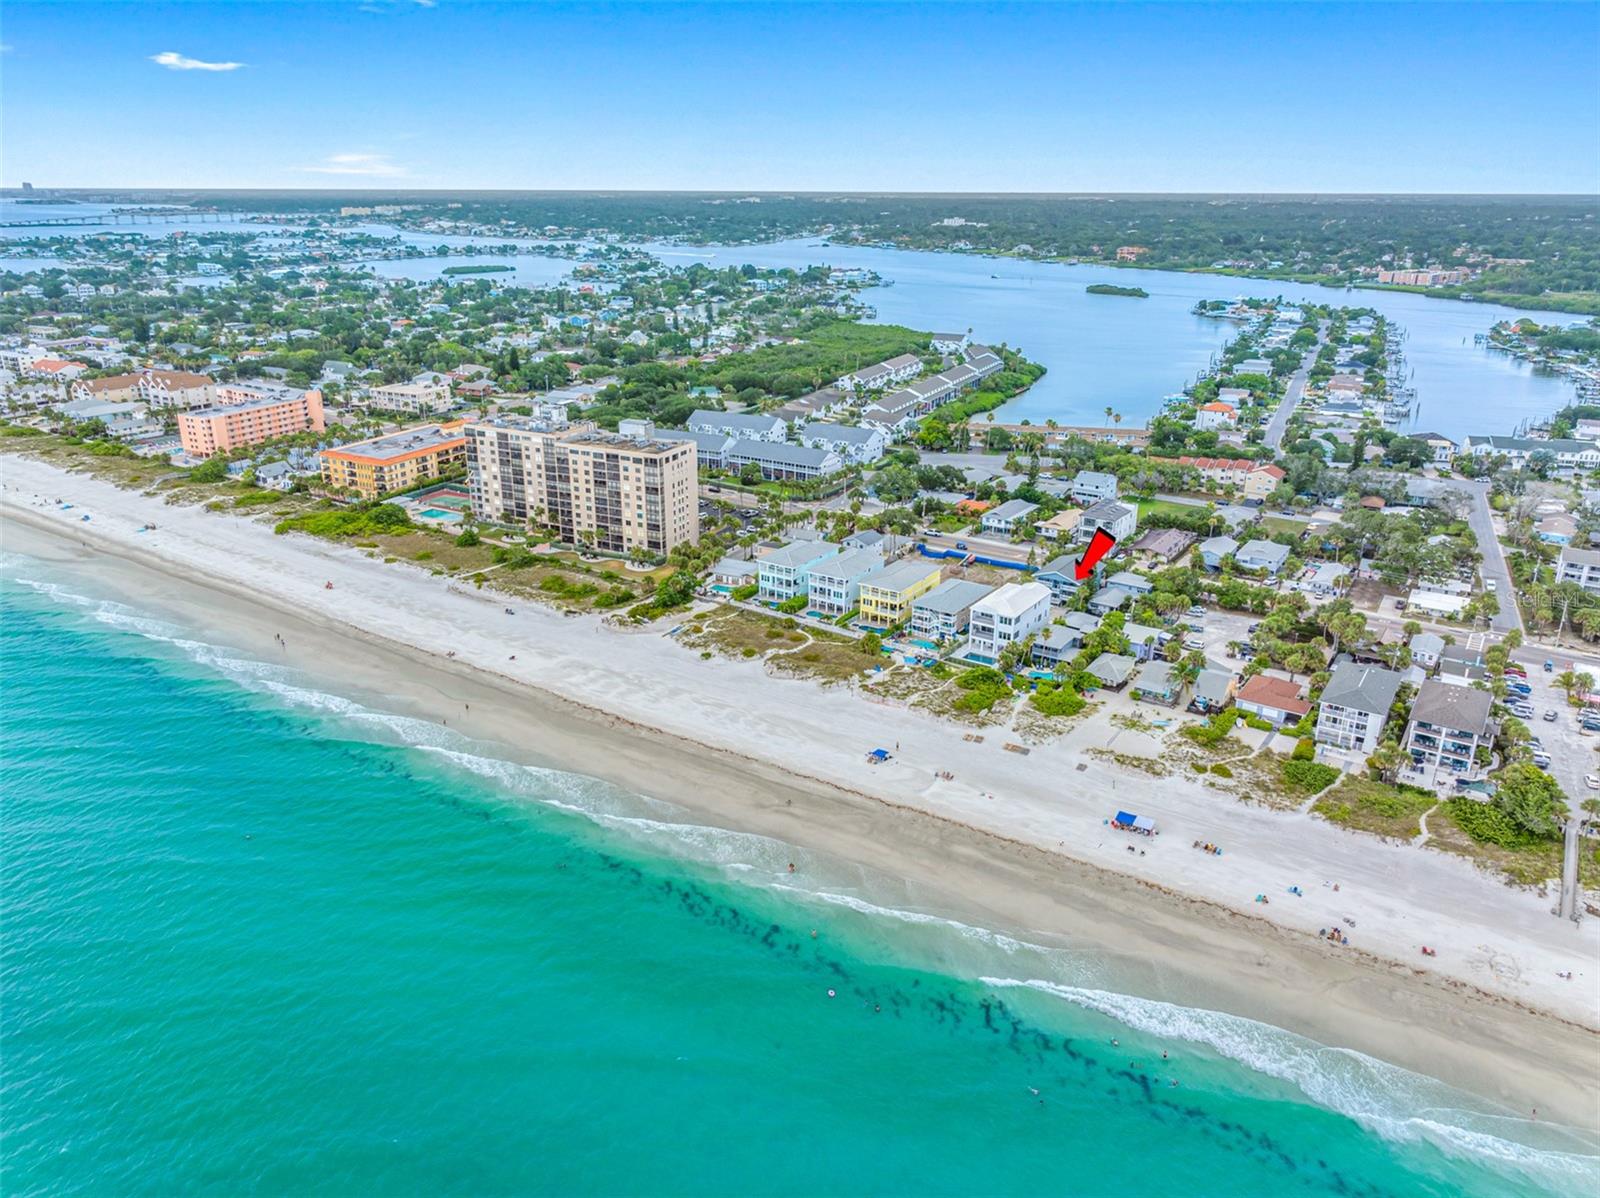
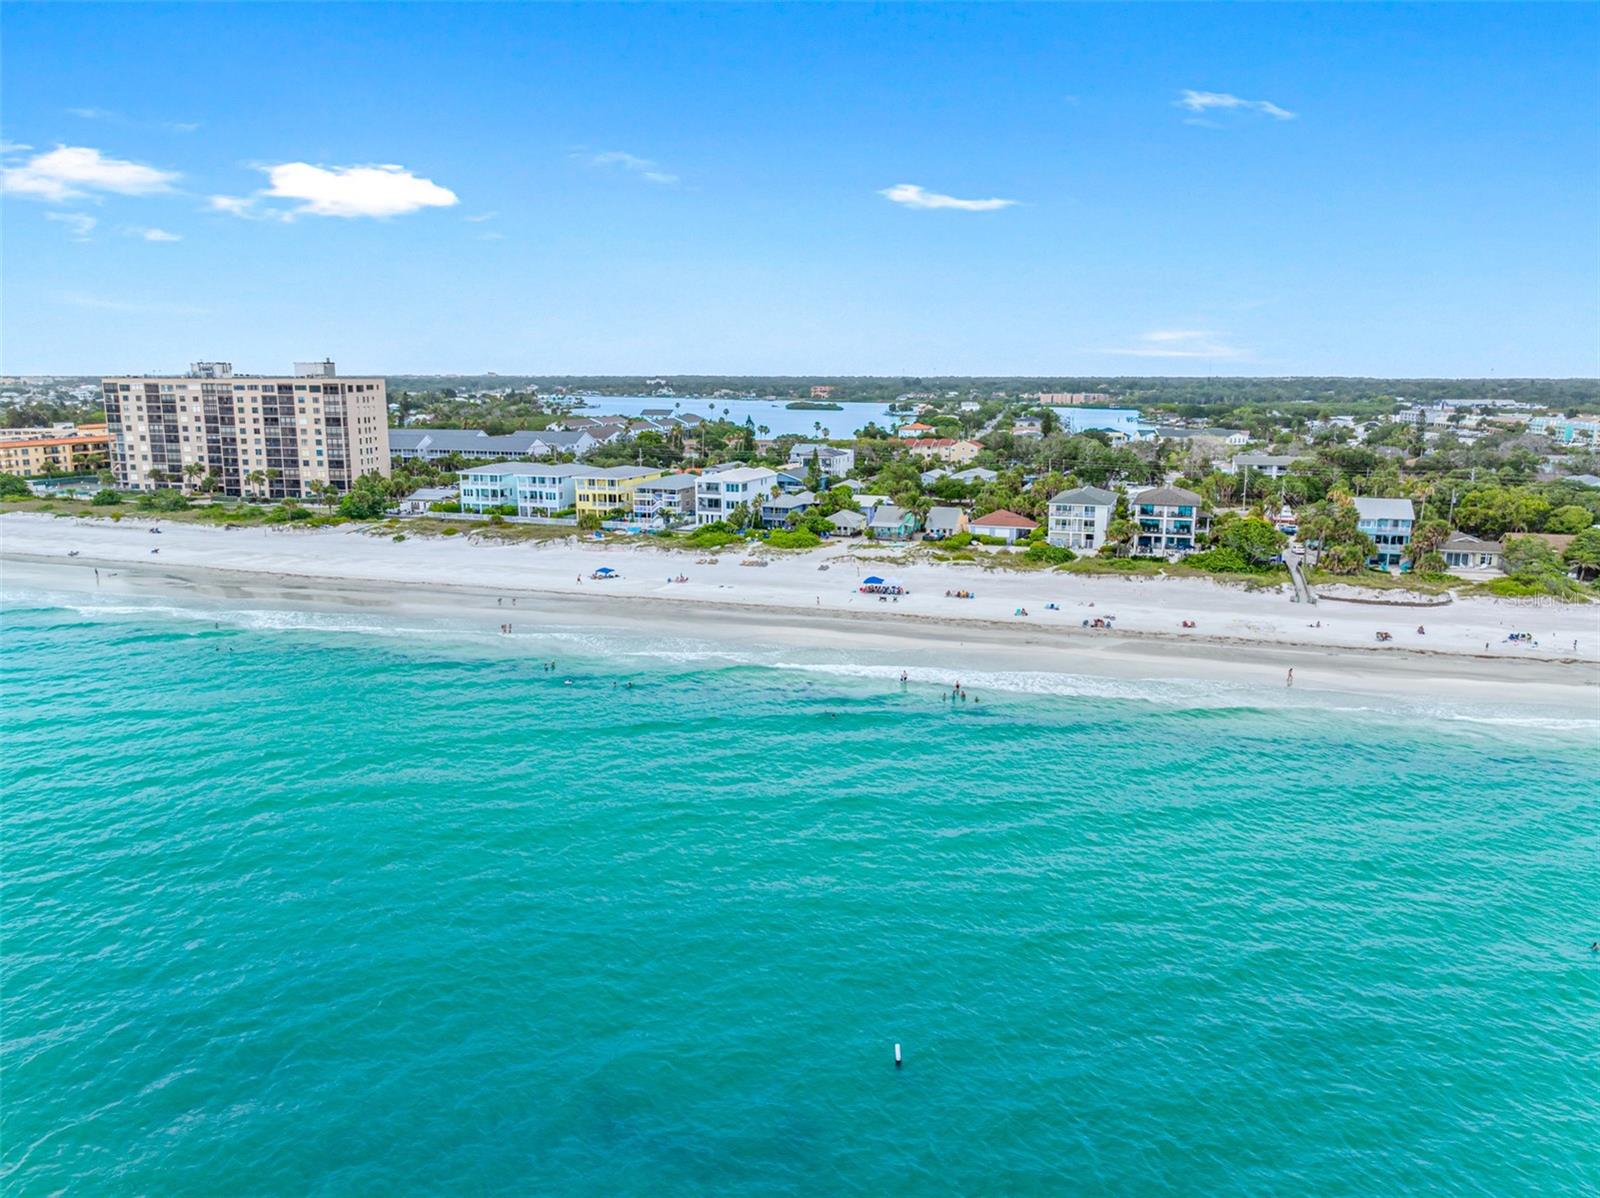
Welcome to a rare investment opportunity that promises exceptional returns in coveted Indian Rocks Beach. NO DAMAGE FROM ANY RECENT STORMS!! Currently generating an impressive $111K+ in annual income through short-term rentals on Airbnb and VRBO, this **FULLY FURNISHED** 3-bedroom, 2-bath corner unit treasure sits on the sought-after west side of Gulf Blvd in an intimate 4-unit building. As a turnkey property, you can start earning from day one with minimal effort, capitalizing on the ever-growing demand for premium beachfront accommodations in this desirable location. Beyond its impressive income potential, this property offers the perfect opportunity to create your permanent beachside sanctuary. Imagine waking up each morning just steps away from sinking your toes into sugar-white sands. This southwest corner unit captures breathtaking sunset views that paint the sky in vibrant hues every evening – a spectacular daily ritual visible from your private west-facing balcony where the rhythmic sounds of crashing waves create the perfect backdrop to coastal living. Your beach haven features a NEW roof and freshly painted exterior ensuring long-term durability and peace of mind. Inside, the bright, open floor plan showcases luxury vinyl plank flooring throughout, complemented by elegant tile bathrooms including an en-suite primary bath. The gourmet kitchen boasts stone countertops and stainless steel appliances, perfect for preparing fresh seafood meals or entertaining guests. The primary suite includes a generous walk-in closet, while practical amenities like a full-size washer & dryer in a separate interior closet make everyday living convenient and comfortable. Ownership includes two assigned under-building parking spaces and a private storage closet for all your beach essentials. Perhaps most appealing for property owners is the remarkably comprehensive HOA fee that covers water, sewer, trash, exterior maintenance, pest control, AND property insurance – allowing you to enjoy a truly low-maintenance lifestyle whether you're in residence or managing from afar. Indian Rocks Beach offers the perfect blend of laid-back coastal charm and vibrant community amenities. From waterfront nature parks and outdoor fitness areas to sports courts, resident-only beach parking, and the area's renowned dining scene – all within a golf-cart friendly community that epitomizes the Florida dream. Whether as your primary residence, vacation home, or investment property, this second-story coastal gem represents an opportunity that combines personal enjoyment with exceptional financial potential. Don't miss your chance to own a piece of paradise that has proven its resilience against nature's forces while delivering consistent returns. Schedule your private showing today!
Build Your Team
Quickly find investor-friendly professionals who can help you succeed in real estate investing at any stage of the investing journey.


Agents
Match with investor-friendly agents who can help you find, analyze, and close your next deal


Lenders
Get the best funding…find investor-friendly lenders who specialize in your deal strategy


Property Managers
Transition to passive investing. Find a trusted property management partnership that lasts.


Tax Pros & Accountants
Taxes and financial reporting made easy—find experts to create tax savings strategies, file taxes, and more
Location
Property Details
Parking
- Description: Assigned, Ground Level, Off Street, Under Building
- Details: Assigned, Off Street
- Garage Spaces: 0
- Spaces Total: 0
Bedroom Information
- # of Bedrooms: 3
Bathroom Information
- # of Baths (Full): 2
- # of Baths (Total): 2.0
Interior Features
- # of Rooms: 5
- # of Stories: 1
Exterior Features
- Exterior Walls Materials: Wood
- Foundation: Pillar/Post/Pier
- Roof Material: Shingle
HOA
- Has HOA: Yes
- Association: Marcia Brown
- HOA Fee: $525/monthly
Land Information
- Land Use: Residential
- Land Use Subtype: Apartments (general)
Lot Information
- Parcel ID: 123014811630000030
- Lot Size: 5643 sqft
Property Information
- Property Type: Condominium
- Style: Key West
- Year Built: 1981
Tax Information
- Annual Tax: $8,792
Utilities
- Water & Sewer: Public
- Heating: Central
- Cooling: Central Air
Location
- County: Pinellas
Listing Details
Investment Summary
- Monthly Cash Flow
- -$3,416
- Cap Rate
- 1.9%
- Cash-on-Cash Return
- -18.6%
- Debt Coverage Ratio
- 0.31
- Internal Rate of Return (5 years)
- -13.9%
Cash Flow
Net Operating Income (NOI) minus mortgage payments.
Calculation:
NOI - Mortgage Payments
Cap Rate (Market Value)
Capitalization Rate is a rate of return that compares the yearly Net Operating Income (NOI) to the market value.
Calculation:
NOI / Market Value
Cash-on-Cash Return (CoC)
Annual cash flow divided by initial cash invested.
Calculation:
Annual Cash Flow / Cash Invested
Debt Coverage Ratio (DCR)
Net Operating Income (NOI) divided by total debt payments.
Calculation:
NOI / Total Debt Payments
Internal Rate of Return (IRR)
A metric for assessing profitability over time. IRR is the discount rate at which the net present value (NPV) of all future cash flows (positive and negative) from an investment equals zero — including both periodic cash flow (such as rent) and a projected sale at the end of the holding period. It represents the expected annualized return, accounting for income, expenses, and the recovery of capital through a future sale.
Calculation:
(Future Value / Present Value) ** (1 / Years) - 1
Purchase Details
|
The price paid for the property. Purchase price:
| $960,000 |
|---|---|
|
The amount of the purchase financed through a loan. Amount financed:
| -$768,000 |
Down paymentThe initial payment made towards the purchase. Calculation:Purchase price - Amount financed Down payment:
| $192,000 |
Closing costsFees and expenses associated with purchasing a property, typically ranging from 2% to 5% of the home’s purchase price, paid at the end of a home purchase to cover services like lending, title transfer, and taxes. Closing costs:
| $28,800 |
|
Costs incurred to repair or improve the property. Rehab costs:
| $0 |
Initial cash investedTotal initial cash invested in the property. Calculation:Down payment + Buying costs + Rehab costs Initial cash invested:
| $220,800 |
|
The total square footage (SQFT) of the property. Square feet:
| 975 |
|
Cost per square foot of the property. Calculation:Purchase price / Square feet Cost per square foot:
| $985 |
|
Monthly rent divided by square footage. Calculation:Monthly rent / Square feet Monthly rent per square foot:
| $4.10 |
Financing Details
Loan amountThe total sum of money borrowed from a lender to finance a property purchase. Calculation:Purchase Price - Down Payment
Loan amount:
| $768,000 |
|---|---|
Loan to Value Ratio (LTV)Loan amount divided by the market value of the property. Calculation:Loan Amount / Market Value
Loan to value ratio:
| 80.0% |
Loan typeThe type of loan (e.g., fixed, adjustable).
Loan type:
| Amortizing |
TermThe loan repayment period in years.
Term:
| 30 years |
Interest RateThe percentage a lender charges on the borrowed amount of a loan, determining the cost of borrowing money.
Interest rate:
| 6.625% |
Principle & Interest (PI)The principle is the portion of the loan payment that reduces the loan balance. The interest is the lender's charge for borrowing money.
Principle & interest:
| $4,918 |
Property TaxesAnnual taxes levied by local governments on real estate properties. These taxes fund public services like schools, roads, and emergency services. Calculation:Assumes 12% of gross rental income, unless public tax records are available.
Property tax:
| $733 |
InsuranceThe costs for insurance coverage to protect against financial losses due to risks like fire, natural disasters, theft, liability, or tenant-related damages. Calculation:Assumes 7% of gross rental income, unless insurance rates are specified.
Insurance:
| $280 |
Private Mortgage Insurance (PMI)A fee that borrowers pay when they take out a conventional loan with a loan-to-value (LTV) ratio above 80%.
Private mortgage insurance (PMI):
| $0 |
|
The fixed amount a borrower pays each month to repay a loan. It typically includes principal and interest (P&I) and may also cover property taxes, insurance, HOA fees, and PMI if escrowed. Monthly payment:
| $5,931 |
Operating Income
| % Rent | Monthly | Yearly | |
|---|---|---|---|
Gross RentThe total rental income received from tenants before deducting any expenses. Includes base rent, late fees, pet fees, parking fees, and other recurring charges.
Gross rent:
| $4,000 | $48,000 | |
Vacancy LossExpected loss of rent due to vacancies.
Vacancy loss:
(6%)
| 6% | -$240 | -$2,880 |
Operating IncomeGross rental income minus vacancy loss. Calculation:Gross rent - Vacancy loss
Operating income:
| $3,760 | $45,120 |
Operating Expenses
| % Rent | Monthly | Yearly | |
|---|---|---|---|
Property TaxesAnnual taxes levied by local governments on real estate properties. These taxes fund public services like schools, roads, and emergency services. Calculation:Assumes 12% of gross rental income, unless public tax records are available. | 18% | -$733 | -$8,792 |
InsuranceThe costs for insurance coverage to protect against financial losses due to risks like fire, natural disasters, theft, liability, or tenant-related damages. Calculation:Assumes 7% of gross rental income, unless insurance rates are specified. | 7% | -$280 | -$3,360 |
Property ManagementThe costs associated with hiring a property manager to handle the day-to-day operations of a rental property. Includes management fees, leasing fes, eviction fees, etc. Calculation:Assumes 8% of gross rental income. | 8% | -$320 | -$3,840 |
Repairs & MaintenanceOngoing costs for routine upkeep and minor fixes needed to keep a property in good working condition. Calculation:Assumes 5% of gross rental income. Varies by property age and condition. | 5% | -$200 | -$2,400 |
Capital ExpensesLarge, infrequent costs for major improvements or replacements, like a new roof, HVAC system, or appliances. Calculation:Assumes 5% of gross rental income. Varies by property age. | 5% | -$200 | -$2,400 |
HOA FeesRegular dues paid to a Homeowners Association for community maintenance, amenities, and management. Similar fees include: Condo Association Fees, Co-op Maintenance Fees, etc. Calculation:Assumes 0% gross rental income, unless specified.. | 13% | -$525 | -$6,300 |
Operating ExpensesRecurring costs required to maintain and manage a rental property, including property taxes, insurance, maintenance, repairs, utilities (if paid by the owner), property management fees, and other day-to-day expenses. Calculation:Insurance + Property Taxes + Property Management + Repairs & Maintenance + Capital Expenditures + HOA Fees | 56% | -$2,258 | -$27,092 |
Cash Flow
| Monthly | Yearly | |
|---|---|---|
Net Operating Income (NOI)The income generated from a property after deducting all operating expenses but before deducting mortgage payments, taxes, and capital expenditures. Calculation:Gross Operating Income - Operating Expenses
Net operating income:
| $1,502 | $18,024 |
Mortgage PaymentThe fixed amount a borrower pays each month to repay a loan. It typically includes principal and interest (P&I) and may also cover property taxes, insurance, HOA fees, and PMI if escrowed. | -$4,918 | -$59,016 |
Cash FlowNet Operating Income (NOI) minus mortgage payments. Calculation:NOI - Mortgage Payments | $3,416 | $40,992 |