North Dakota Investment Properties for Sale
Browse homes for sale and investment properties in North Dakota. Refine your search by price, property type, or more.
Best cash flowing properties in North Dakota
$115,000
2
bds
|
1
ba
|
0
sqft
|
built
1977
1401 25th Ave S, Fargo, ND 58103
$107
Cash flow
4.9%
Cash-on-Cash Return
6.8%
Cap rate
1.1%
Rent to Value Ratio

$260,000
3
bds
|
2
ba
|
1,740
sqft
|
built
1780
605 13 1/2 Ave E, West Fargo, ND 58078
$10
Cash flow
0.2%
Cash-on-Cash Return
5.7%
Cap rate
0.8%
Rent to Value Ratio
40 out of 748 properties for sale in North Dakota
Limited Results Shown
Create a free account, or log in to reveal all property listings and enjoy the complete experience.

$305,000
3
bds
|
2
ba
|
1,790
sqft
|
built
2016
1009 Eaglewood Ave, West Fargo, ND 58078
$-337
Cash flow
-5.8%
Cash-on-Cash Return
4.4%
Cap rate
0.8%
Rent to Value Ratio

$320,000
3
bds
|
2
ba
|
1,918
sqft
|
built
2020
1022 Albert Dr W, West Fargo, ND 58078
$-487
Cash flow
-7.9%
Cash-on-Cash Return
3.9%
Cap rate
0.7%
Rent to Value Ratio
$394,000
4
bds
|
3
ba
|
2,529
sqft
|
built
2022
5511 Lori Ln W, West Fargo, ND 58078
$-376
Cash flow
-5.0%
Cash-on-Cash Return
4.5%
Cap rate
0.7%
Rent to Value Ratio

$259,900
4
bds
|
3
ba
|
2,274
sqft
|
built
2006
4226 Estate Dr S, Fargo, ND 58104
$-180
Cash flow
-3.6%
Cash-on-Cash Return
4.8%
Cap rate
0.8%
Rent to Value Ratio
$499,900
4
bds
|
2
ba
|
1,920
sqft
|
built
1997
5103 Rose Creek Pkwy S, Fargo, ND 58104
$-1,112
Cash flow
-11.6%
Cash-on-Cash Return
3.0%
Cap rate
0.5%
Rent to Value Ratio

$399,900
4
bds
|
3
ba
|
2,432
sqft
|
built
2000
920 Westwynd Dr, West Fargo, ND 58078
$-865
Cash flow
-11.3%
Cash-on-Cash Return
3.1%
Cap rate
0.5%
Rent to Value Ratio
$239,000
3
bds
|
2
ba
|
1,560
sqft
|
built
1997
3535 31st St S, Fargo, ND 58104
$-530
Cash flow
-11.6%
Cash-on-Cash Return
3.0%
Cap rate
0.6%
Rent to Value Ratio

$649,000
6
bds
|
4
ba
|
3,620
sqft
|
built
2007
1839 Queensbury St, West Fargo, ND 58078
$-1,695
Cash flow
-13.6%
Cash-on-Cash Return
2.5%
Cap rate
0.4%
Rent to Value Ratio
$115,000
2
bds
|
1
ba
|
0
sqft
|
built
1977
1401 25th Ave S, Fargo, ND 58103
$107
Cash flow
4.9%
Cash-on-Cash Return
6.8%
Cap rate
1.1%
Rent to Value Ratio

$314,900
3
bds
|
3
ba
|
1,717
sqft
|
built
2020
2103 Allison Ln, West Fargo, ND 58078
$-371
Cash flow
-6.1%
Cash-on-Cash Return
4.3%
Cap rate
0.7%
Rent to Value Ratio

$274,900
4
bds
|
2
ba
|
1,369
sqft
|
built
1955
1349 14 1/2 St S, Fargo, ND 58103
$-401
Cash flow
-7.6%
Cash-on-Cash Return
3.9%
Cap rate
0.6%
Rent to Value Ratio

$195,000
4
bds
|
1
ba
|
1,334
sqft
|
built
1973
506 5th St E, West Fargo, ND 58078
$-55
Cash flow
-1.5%
Cash-on-Cash Return
5.3%
Cap rate
0.9%
Rent to Value Ratio

$289,900
3
bds
|
2
ba
|
1,968
sqft
|
built
2006
4362 39 1/2 Ave S, Fargo, ND 58104
$-139
Cash flow
-2.5%
Cash-on-Cash Return
5.1%
Cap rate
0.8%
Rent to Value Ratio
$925,000
6
bds
|
3
ba
|
4,355
sqft
|
built
2015
1037 Wildflower Ln W, West Fargo, ND 58078
$-2,605
Cash flow
-14.7%
Cash-on-Cash Return
2.3%
Cap rate
0.5%
Rent to Value Ratio
$260,000
3
bds
|
2
ba
|
1,740
sqft
|
built
1780
605 13 1/2 Ave E, West Fargo, ND 58078
$10
Cash flow
0.2%
Cash-on-Cash Return
5.7%
Cap rate
0.8%
Rent to Value Ratio
$779,000
4
bds
|
5
ba
|
3,856
sqft
|
built
2021
8825 Meadowlark Pkwy, Horace, ND 58047
$-1,380
Cash flow
-9.2%
Cash-on-Cash Return
3.6%
Cap rate
0.6%
Rent to Value Ratio
$309,000
3
bds
|
3
ba
|
1,978
sqft
|
built
2003
3220 40th Ave S, Fargo, ND 58104
$-504
Cash flow
-8.5%
Cash-on-Cash Return
3.7%
Cap rate
0.7%
Rent to Value Ratio
$449,000
4
bds
|
3
ba
|
2,804
sqft
|
built
1998
3449 26th Ave S, Fargo, ND 58103
$-1,299
Cash flow
-15.1%
Cash-on-Cash Return
2.2%
Cap rate
0.5%
Rent to Value Ratio
$340,000
3
bds
|
2
ba
|
2,247
sqft
|
built
1970
3142 Edgewood Dr N, Fargo, ND 58102
$-610
Cash flow
-9.4%
Cash-on-Cash Return
3.5%
Cap rate
0.6%
Rent to Value Ratio

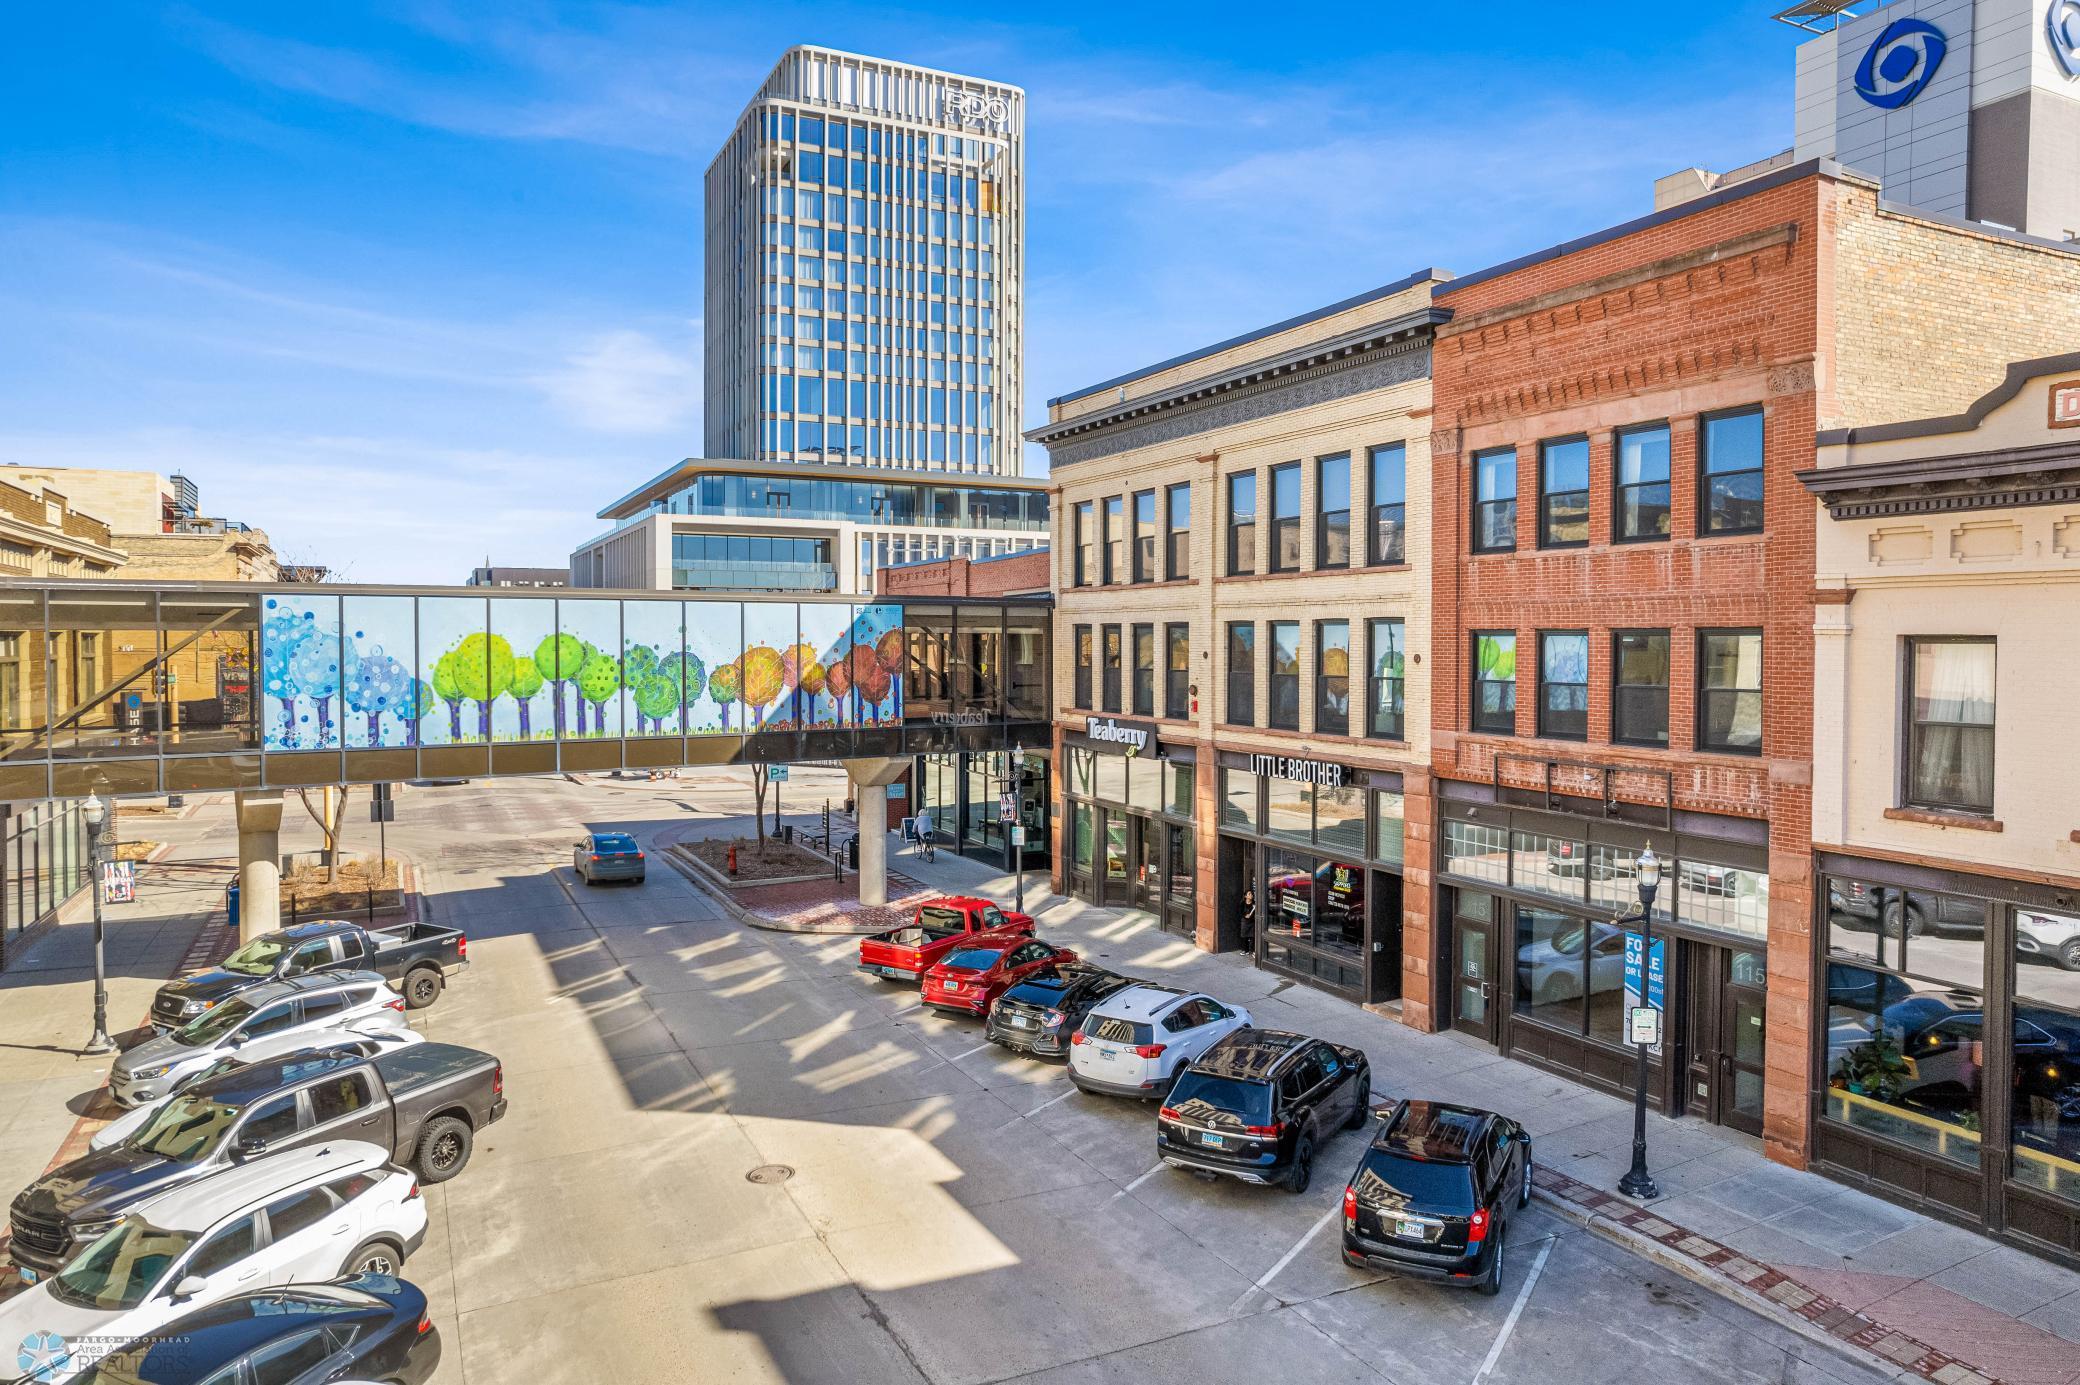
$181,000
1
bds
|
1
ba
|
588
sqft
|
built
1911
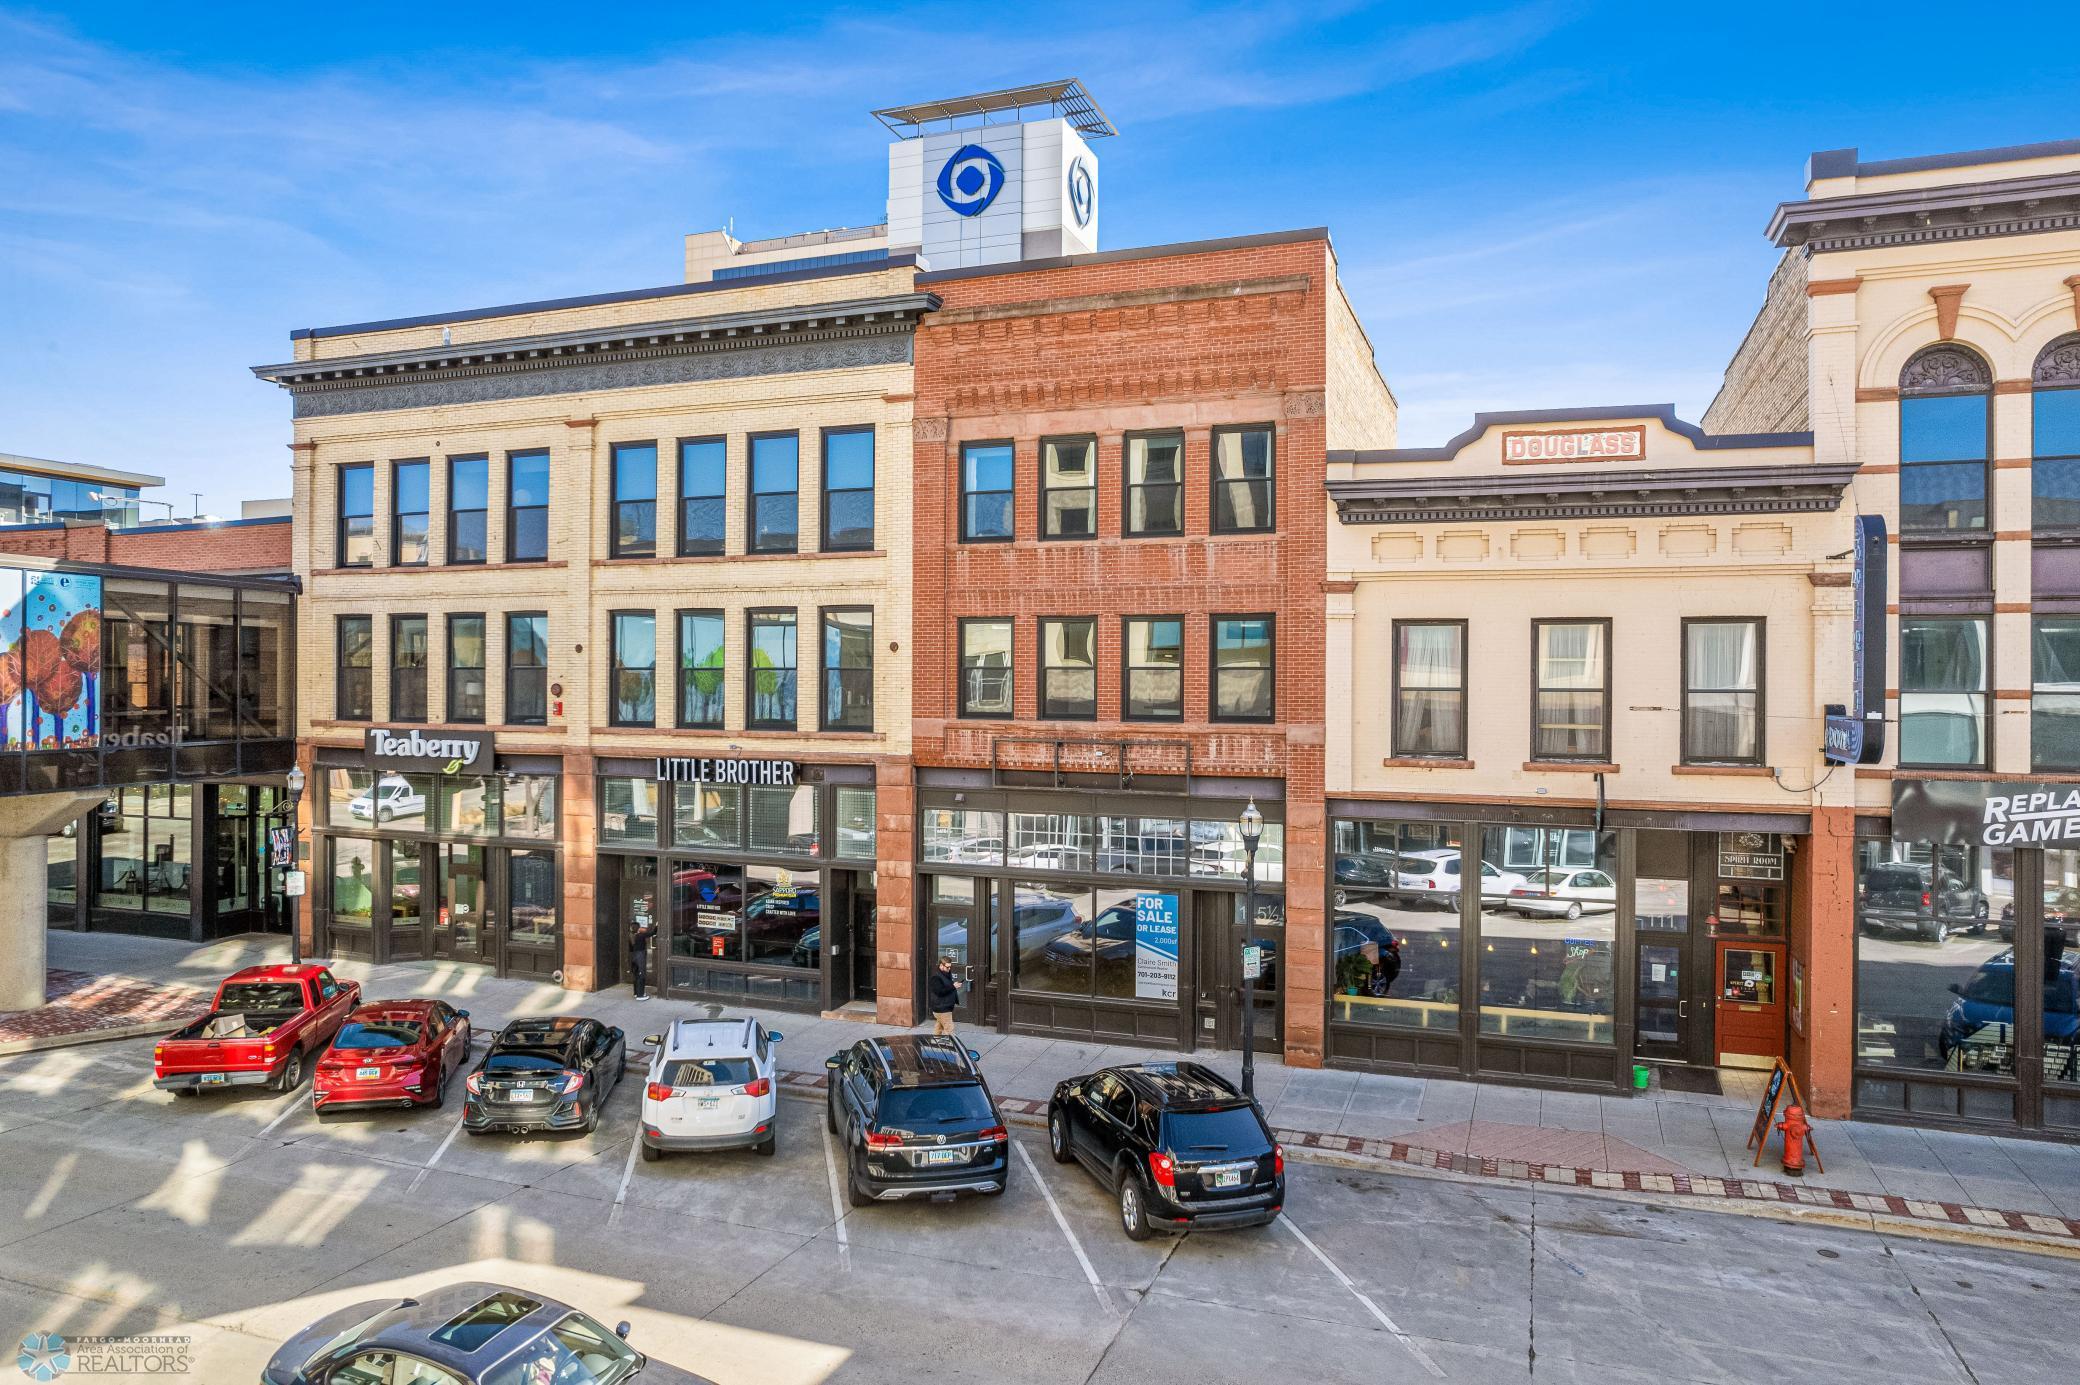
117 Broadway N, Fargo, ND 58102
$-265
Cash flow
-7.6%
Cash-on-Cash Return
3.9%
Cap rate
0.8%
Rent to Value Ratio

$178,000
1
bds
|
1
ba
|
609
sqft
|
built
1911
117 Broadway N, Fargo, ND 58102
$-260
Cash flow
-7.6%
Cash-on-Cash Return
3.9%
Cap rate
0.8%
Rent to Value Ratio

$345,000
2
bds
|
1
ba
|
993
sqft
|
built
1911
117 Broadway N, Fargo, ND 58102
$-715
Cash flow
-10.8%
Cash-on-Cash Return
3.2%
Cap rate
0.6%
Rent to Value Ratio

$325,000
1
bds
|
2
ba
|
1,016
sqft
|
built
1911
117 Broadway N, Fargo, ND 58102
$-538
Cash flow
-8.6%
Cash-on-Cash Return
3.7%
Cap rate
0.7%
Rent to Value Ratio

$225,000
1
bds
|
1
ba
|
649
sqft
|
built
1911
117 Broadway N, Fargo, ND 58102
$-368
Cash flow
-8.5%
Cash-on-Cash Return
3.7%
Cap rate
0.7%
Rent to Value Ratio
$335,000
1
bds
|
1
ba
|
678
sqft
|
built
1911
117 Broadway N, Fargo, ND 58102
$-631
Cash flow
-9.8%
Cash-on-Cash Return
3.4%
Cap rate
0.6%
Rent to Value Ratio
$460,000
3
bds
|
2
ba
|
1,513
sqft
|
built
1911
117 Broadway N, Fargo, ND 58102
$-898
Cash flow
-10.2%
Cash-on-Cash Return
3.3%
Cap rate
0.7%
Rent to Value Ratio
$215,000
1
bds
|
1
ba
|
719
sqft
|
built
1911
117 Broadway N, Fargo, ND 58102
$-221
Cash flow
-5.4%
Cash-on-Cash Return
4.4%
Cap rate
0.8%
Rent to Value Ratio

$535,000
2
bds
|
2
ba
|
1,326
sqft
|
built
1911
117 Broadway N, Fargo, ND 58102
$-1,365
Cash flow
-13.3%
Cash-on-Cash Return
2.6%
Cap rate
0.5%
Rent to Value Ratio

$415,000
2
bds
|
2
ba
|
1,198
sqft
|
built
1911
117 Broadway N, Fargo, ND 58102
$-740
Cash flow
-9.3%
Cash-on-Cash Return
3.5%
Cap rate
0.7%
Rent to Value Ratio

$435,000
4
bds
|
3
ba
|
2,642
sqft
|
built
2015
1309 Goldenwood Dr, West Fargo, ND 58078
$-680
Cash flow
-8.2%
Cash-on-Cash Return
3.8%
Cap rate
0.7%
Rent to Value Ratio
$364,900
4
bds
|
3
ba
|
1,877
sqft
|
built
2011
422 Sequoia Dr, Mapleton, ND 58059
$-771
Cash flow
-11.0%
Cash-on-Cash Return
3.1%
Cap rate
0.6%
Rent to Value Ratio

$340,000
4
bds
|
3
ba
|
2,585
sqft
|
built
2006
367 Maple Point Blvd, Mapleton, ND 58059
$-460
Cash flow
-7.1%
Cash-on-Cash Return
4.1%
Cap rate
0.6%
Rent to Value Ratio

$195,000
2
bds
|
2
ba
|
1,474
sqft
|
built
1973
3230 2nd St N, Fargo, ND 58102
$-146
Cash flow
-3.9%
Cash-on-Cash Return
4.8%
Cap rate
0.8%
Rent to Value Ratio
$899,900
7
bds
|
5
ba
|
5,044
sqft
|
built
2018
119 Westview Ln, Horace, ND 58047
$-1,730
Cash flow
-10.0%
Cash-on-Cash Return
3.4%
Cap rate
0.5%
Rent to Value Ratio
$1,875,000
5
bds
|
5
ba
|
7,110
sqft
|
built
2005
4009 Carmell Pl, West Fargo, ND 58078
$-6,990
Cash flow
-19.5%
Cash-on-Cash Return
1.2%
Cap rate
0.3%
Rent to Value Ratio
$435,000
4
bds
|
3
ba
|
2,274
sqft
|
built
2004
1095 Parkway Ln, West Fargo, ND 58078
$-503
Cash flow
-6.0%
Cash-on-Cash Return
4.3%
Cap rate
0.6%
Rent to Value Ratio

$639,000
5
bds
|
3
ba
|
2,726
sqft
|
built
1997
4708 Mc Mahon Estates Ct, West Fargo, ND 58078
$-1,667
Cash flow
-13.6%
Cash-on-Cash Return
2.5%
Cap rate
0.4%
Rent to Value Ratio

$745,000
5
bds
|
3
ba
|
3,974
sqft
|
built
2020
3620 Cordova Loop S, Fargo, ND 58104
$-1,396
Cash flow
-9.8%
Cash-on-Cash Return
3.4%
Cap rate
0.6%
Rent to Value Ratio

$340,000
3
bds
|
2
ba
|
1,490
sqft
|
built
2008
3617 5th St W, West Fargo, ND 58078
$-739
Cash flow
-11.3%
Cash-on-Cash Return
3.1%
Cap rate
0.6%
Rent to Value Ratio

$186,000
2
bds
|
2
ba
|
1,056
sqft
|
built
1986
1519 34 1/2 Ave S, Fargo, ND 58104
$-40
Cash flow
-1.1%
Cash-on-Cash Return
5.4%
Cap rate
0.9%
Rent to Value Ratio