California Investment Properties for Sale
Browse homes for sale and investment properties in California. Refine your search by price, property type, or more.
Best cash flowing properties in California
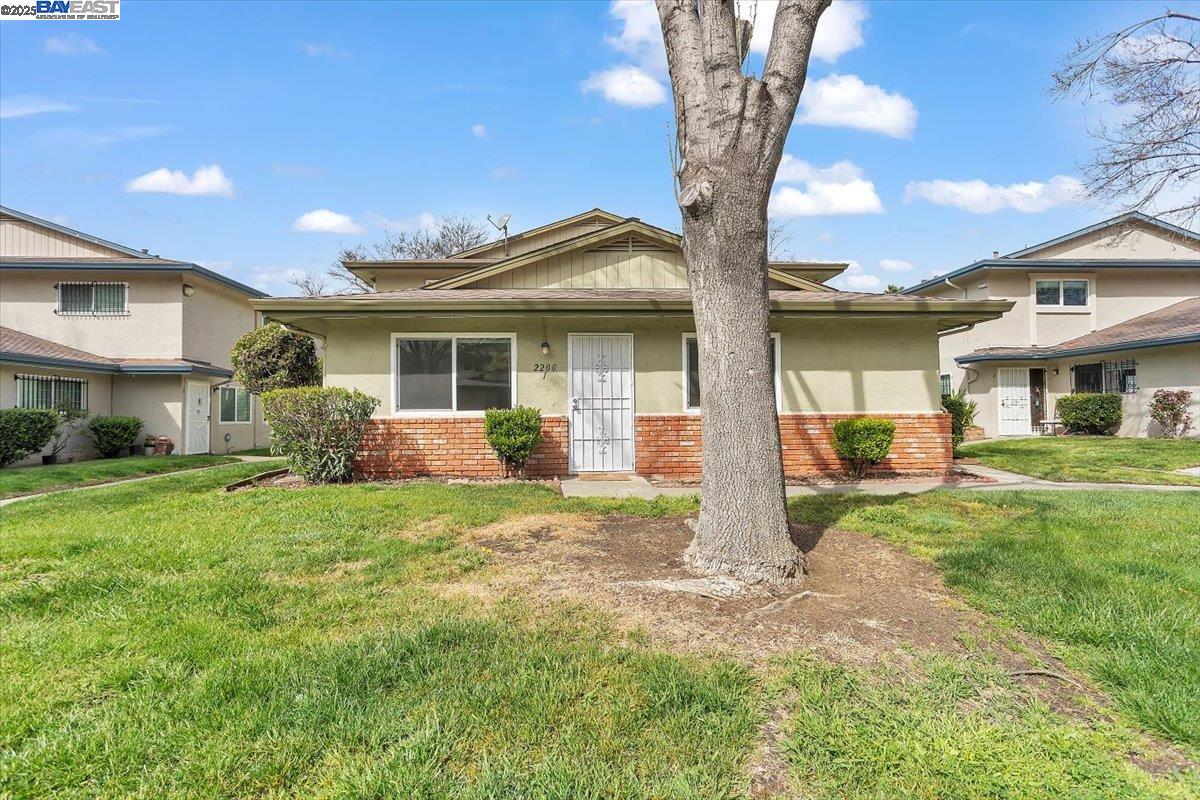
$199,000
2
bds
|
1
ba
|
822
sqft
|
built
1969
2200 Lemontree Way, Antioch, CA 94509
$-248
Cash flow
-6.5%
Cash-on-Cash Return
4.6%
Cap rate
1.0%
Rent to Value Ratio
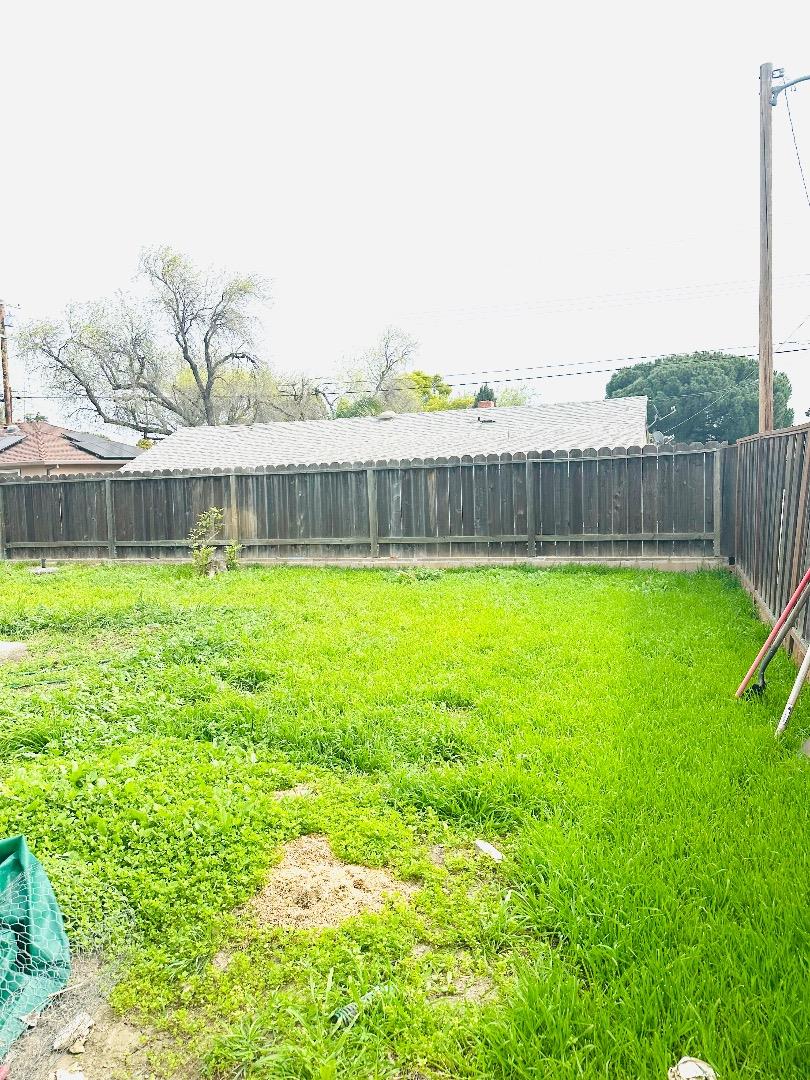
$478,888
3
bds
|
1
ba
|
1,021
sqft
|
built
1951
1311 August Way, Antioch, CA 94509
$-283
Cash flow
-3.1%
Cash-on-Cash Return
5.4%
Cap rate
0.6%
Rent to Value Ratio
40 out of 13,198 properties for sale in California
Limited Results Shown
Create a free account, or log in to reveal all property listings and enjoy the complete experience.
$2,049,000
4
bds
|
3
ba
|
2,464
sqft
|
built
1926
4275 Grand View Blvd, Los Angeles, CA 90066
$-3,392
Cash flow
-8.6%
Cash-on-Cash Return
4.1%
Cap rate
0.5%
Rent to Value Ratio

$29,995,000
19
bds
|
33
ba
|
50,000
sqft
|
built
2003
9650 Cedarbrook Dr, Beverly Hills, CA 90210
$-145,461
Cash flow
-25.3%
Cash-on-Cash Return
0.2%
Cap rate
0.0%
Rent to Value Ratio

$40,000,000
8
bds
|
12
ba
|
15,520
sqft
|
built
2025
728 Linda Flora Dr, Los Angeles, CA 90049
$-194,465
Cash flow
-25.4%
Cash-on-Cash Return
0.2%
Cap rate
0.0%
Rent to Value Ratio
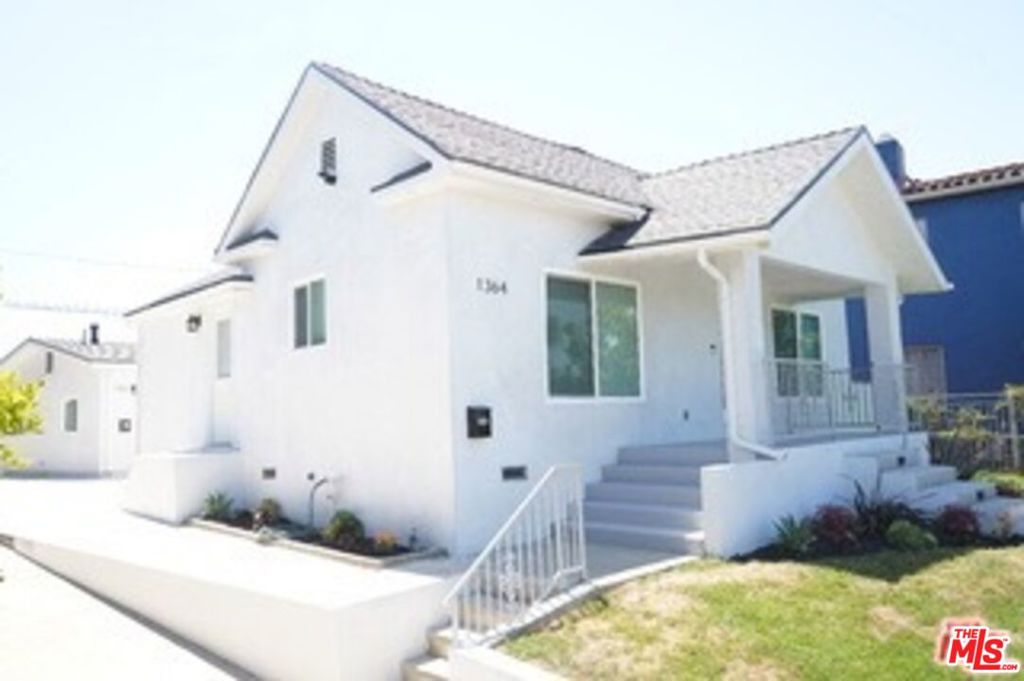
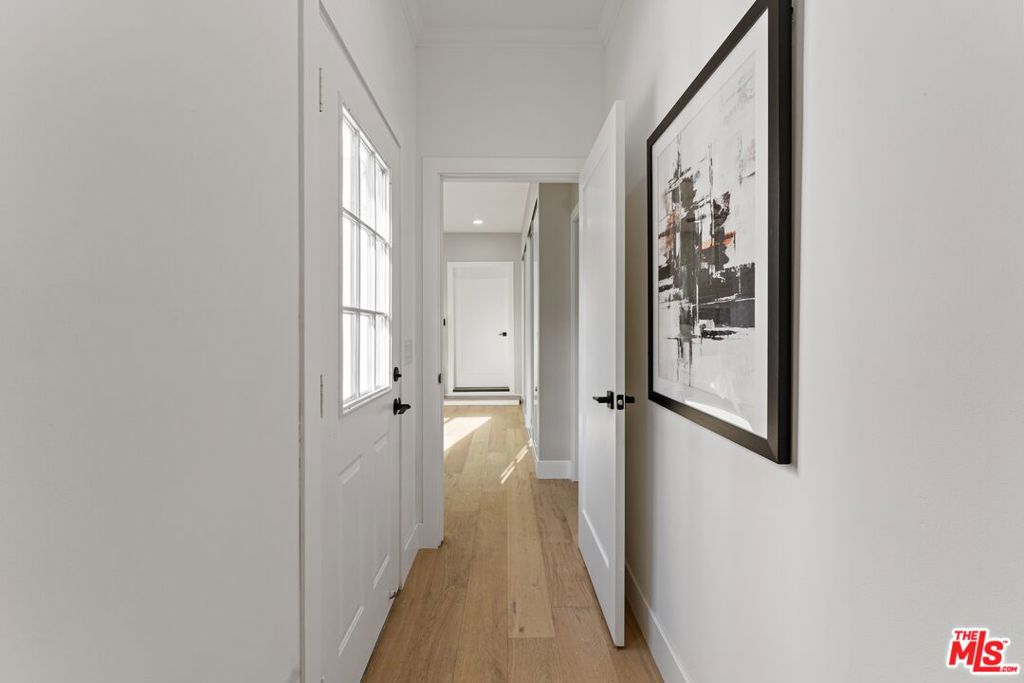
$1,749,000
3
bds
|
4
ba
|
1,108
sqft
|
built
1906
1364 S Ridgeley Dr, Los Angeles, CA 90019
$-4,911
Cash flow
-14.6%
Cash-on-Cash Return
2.7%
Cap rate
0.3%
Rent to Value Ratio

$755,000
4
bds
|
2
ba
|
2,600
sqft
|
built
2017
5476 Pinnacle View Way, Antioch, CA 94531
$-1,334
Cash flow
-9.2%
Cash-on-Cash Return
3.9%
Cap rate
0.5%
Rent to Value Ratio
$199,000
2
bds
|
1
ba
|
822
sqft
|
built
1969
2200 Lemontree Way, Antioch, CA 94509
$-248
Cash flow
-6.5%
Cash-on-Cash Return
4.6%
Cap rate
1.0%
Rent to Value Ratio
$478,888
3
bds
|
1
ba
|
1,021
sqft
|
built
1951
1311 August Way, Antioch, CA 94509
$-283
Cash flow
-3.1%
Cash-on-Cash Return
5.4%
Cap rate
0.6%
Rent to Value Ratio

$905,000
2
bds
|
2
ba
|
1,356
sqft
|
built
1981
425 N El Camino Real, San Mateo, CA 94401
$-2,311
Cash flow
-13.3%
Cash-on-Cash Return
3.0%
Cap rate
0.5%
Rent to Value Ratio

$745,000
2
bds
|
2
ba
|
1,165
sqft
|
built
1980
323 Broadway, Santa Cruz, CA 95060
$-1,841
Cash flow
-12.9%
Cash-on-Cash Return
3.1%
Cap rate
0.5%
Rent to Value Ratio

$2,085,000
5
bds
|
3
ba
|
4,235
sqft
|
built
1973
152 Montclair Dr, Santa Cruz, CA 95060
$-4,954
Cash flow
-12.4%
Cash-on-Cash Return
3.2%
Cap rate
0.4%
Rent to Value Ratio
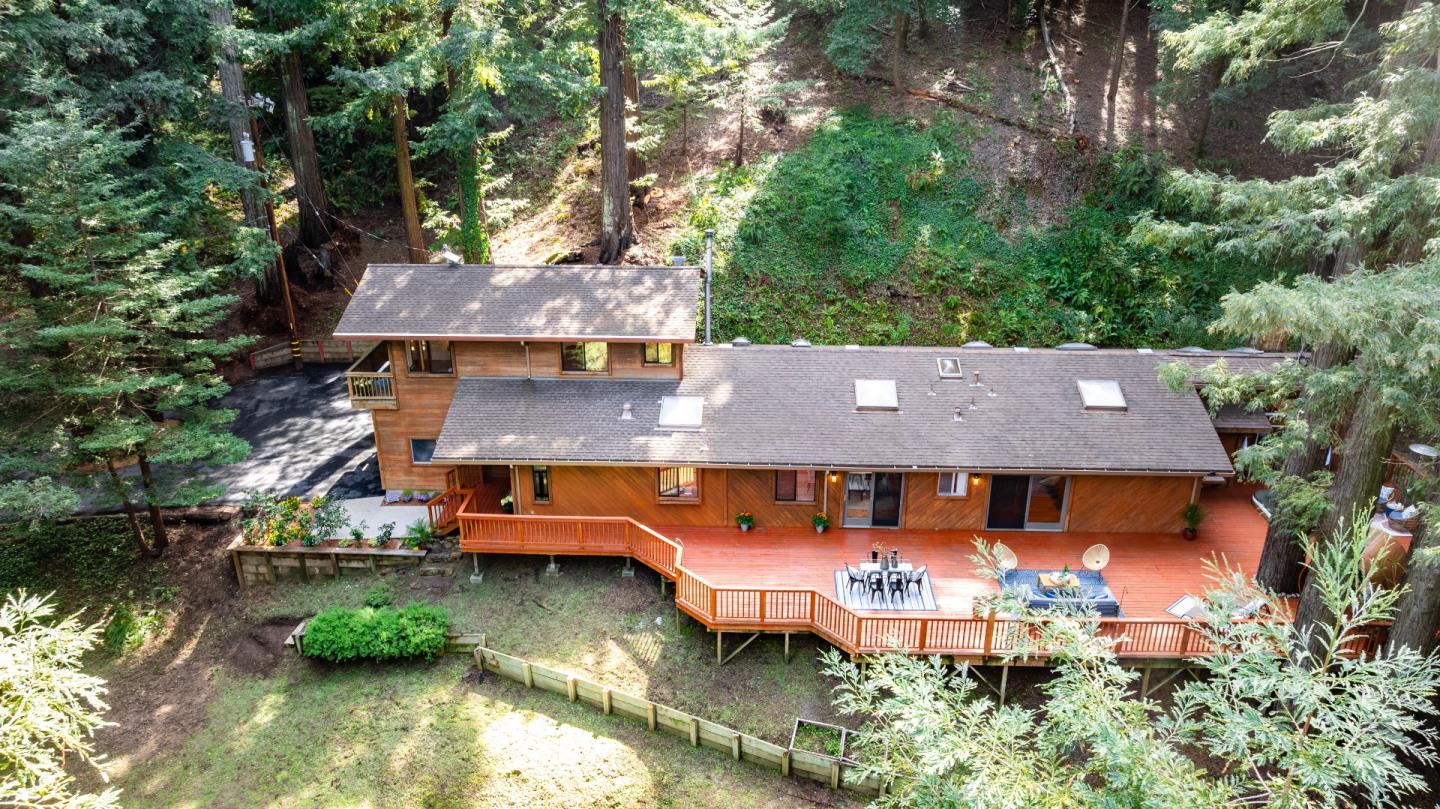
$1,598,000
5
bds
|
3
ba
|
2,963
sqft
|
built
1984
17803 Upper East Zayante Rd, Los Gatos, CA 95033
$-3,802
Cash flow
-12.4%
Cash-on-Cash Return
3.2%
Cap rate
0.4%
Rent to Value Ratio
$1,049,888
2
bds
|
2
ba
|
1,440
sqft
|
built
1920
19495 Beardsley Rd, Los Gatos, CA 95033
$-2,825
Cash flow
-14.0%
Cash-on-Cash Return
2.8%
Cap rate
0.3%
Rent to Value Ratio

$849,888
3
bds
|
3
ba
|
2,108
sqft
|
built
2017
336 Wilmington Ct, Brentwood, CA 94513
$-1,883
Cash flow
-11.6%
Cash-on-Cash Return
3.4%
Cap rate
0.4%
Rent to Value Ratio
$879,000
4
bds
|
3
ba
|
2,501
sqft
|
built
1995
1205 Brookdale Dr, Brentwood, CA 94513
$-1,685
Cash flow
-10.0%
Cash-on-Cash Return
3.8%
Cap rate
0.5%
Rent to Value Ratio
$1,278,000
3
bds
|
2
ba
|
1,330
sqft
|
built
2022
1850 El Camino Real, Santa Clara, CA 95050
$-3,500
Cash flow
-14.3%
Cash-on-Cash Return
2.8%
Cap rate
0.4%
Rent to Value Ratio
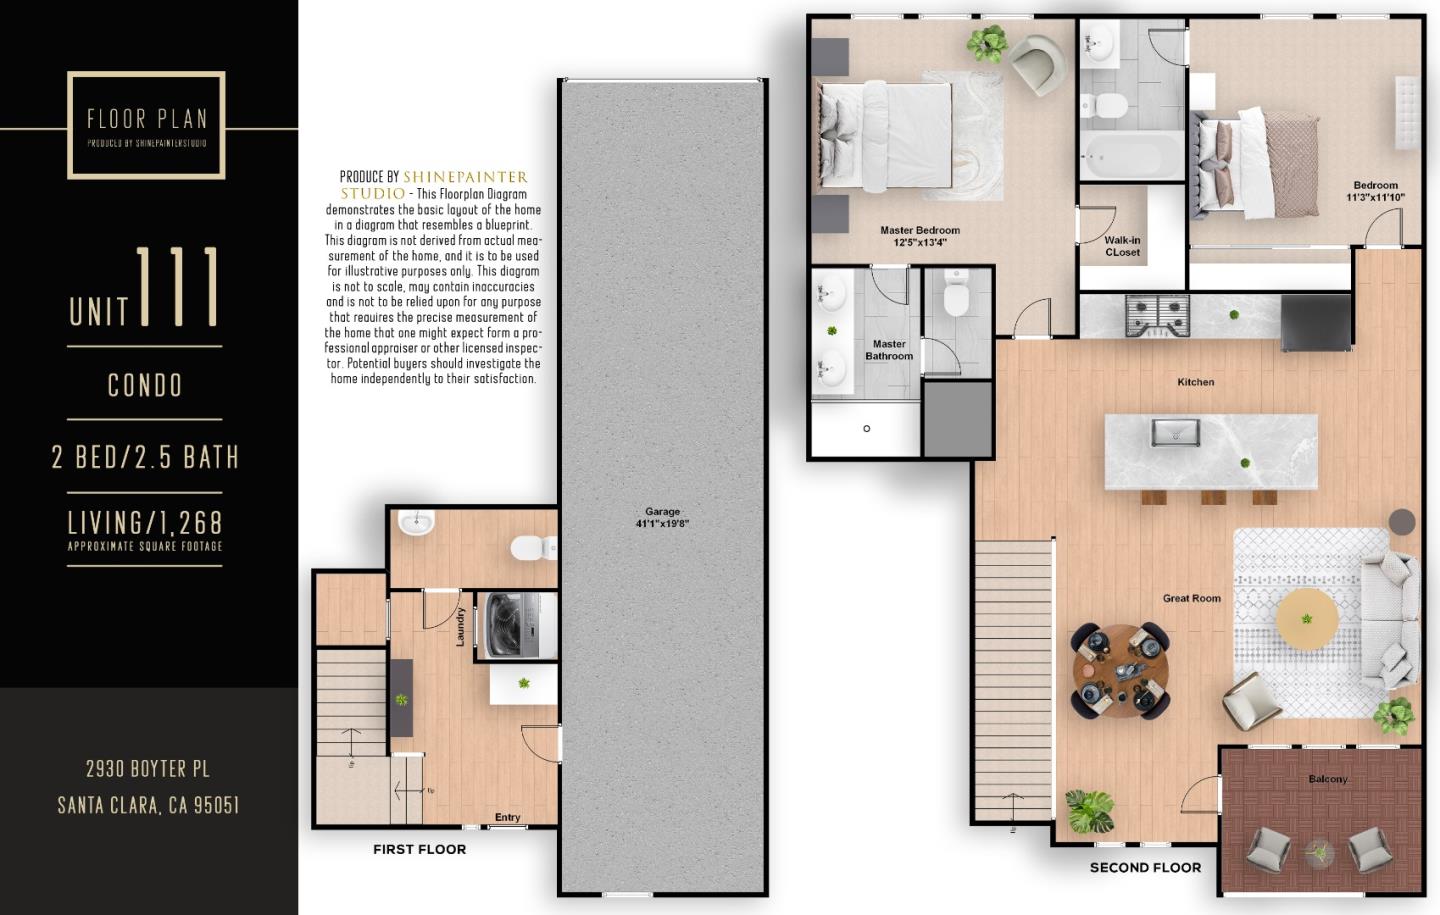
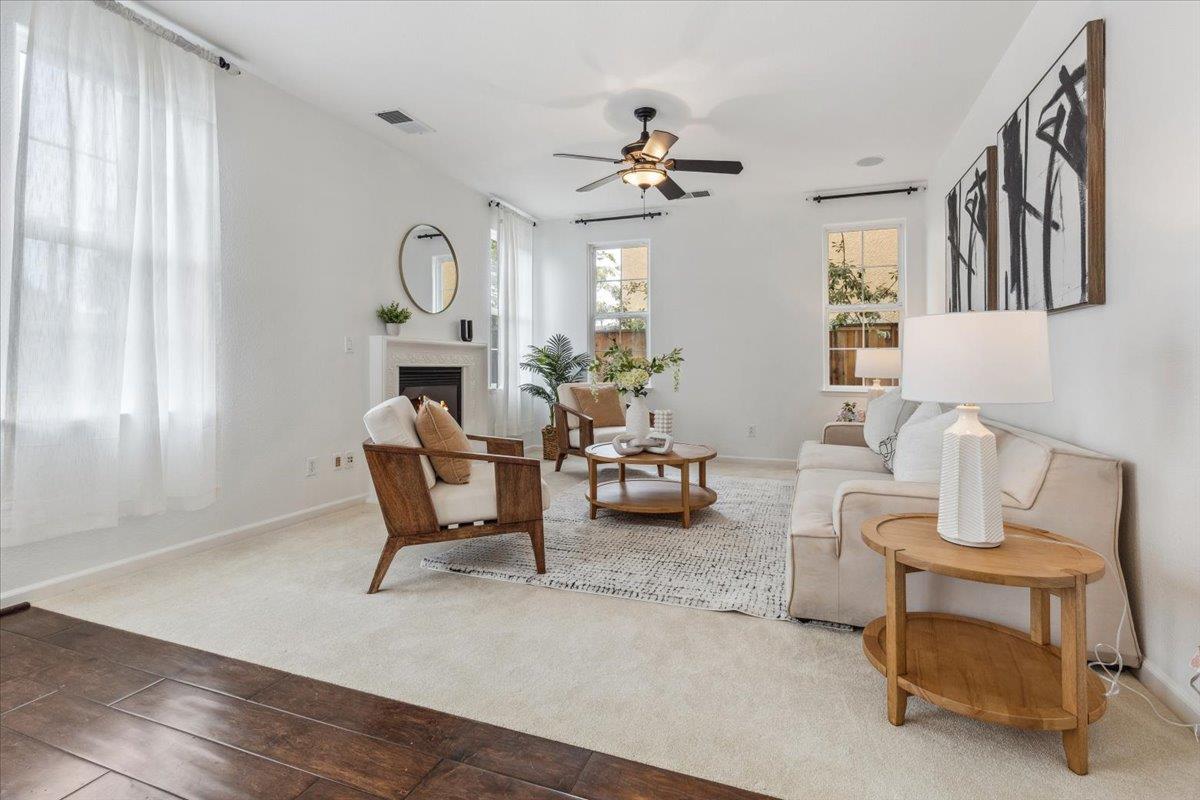
$1,249,000
2
bds
|
3
ba
|
1,268
sqft
|
built
2020
2930 Boyter Pl, Santa Clara, CA 95051
$-3,556
Cash flow
-14.9%
Cash-on-Cash Return
2.7%
Cap rate
0.3%
Rent to Value Ratio

$705,000
2
bds
|
2
ba
|
913
sqft
|
built
1987
2250 Monroe St, Santa Clara, CA 95050
$-1,932
Cash flow
-14.3%
Cash-on-Cash Return
2.8%
Cap rate
0.5%
Rent to Value Ratio
$1,750,000
4
bds
|
3
ba
|
2,000
sqft
|
built
2007
4730 Snead Dr, Santa Clara, CA 95054
$-5,330
Cash flow
-15.9%
Cash-on-Cash Return
2.4%
Cap rate
0.3%
Rent to Value Ratio

$549,000
1
bds
|
1
ba
|
602
sqft
|
built
1989
2225 23rd St, San Francisco, CA 94107
$-1,645
Cash flow
-15.6%
Cash-on-Cash Return
2.5%
Cap rate
0.5%
Rent to Value Ratio
$778,888
3
bds
|
2
ba
|
1,223
sqft
|
built
2018
10 Innes Ct, San Francisco, CA 94124
$-1,578
Cash flow
-10.6%
Cash-on-Cash Return
3.6%
Cap rate
0.6%
Rent to Value Ratio
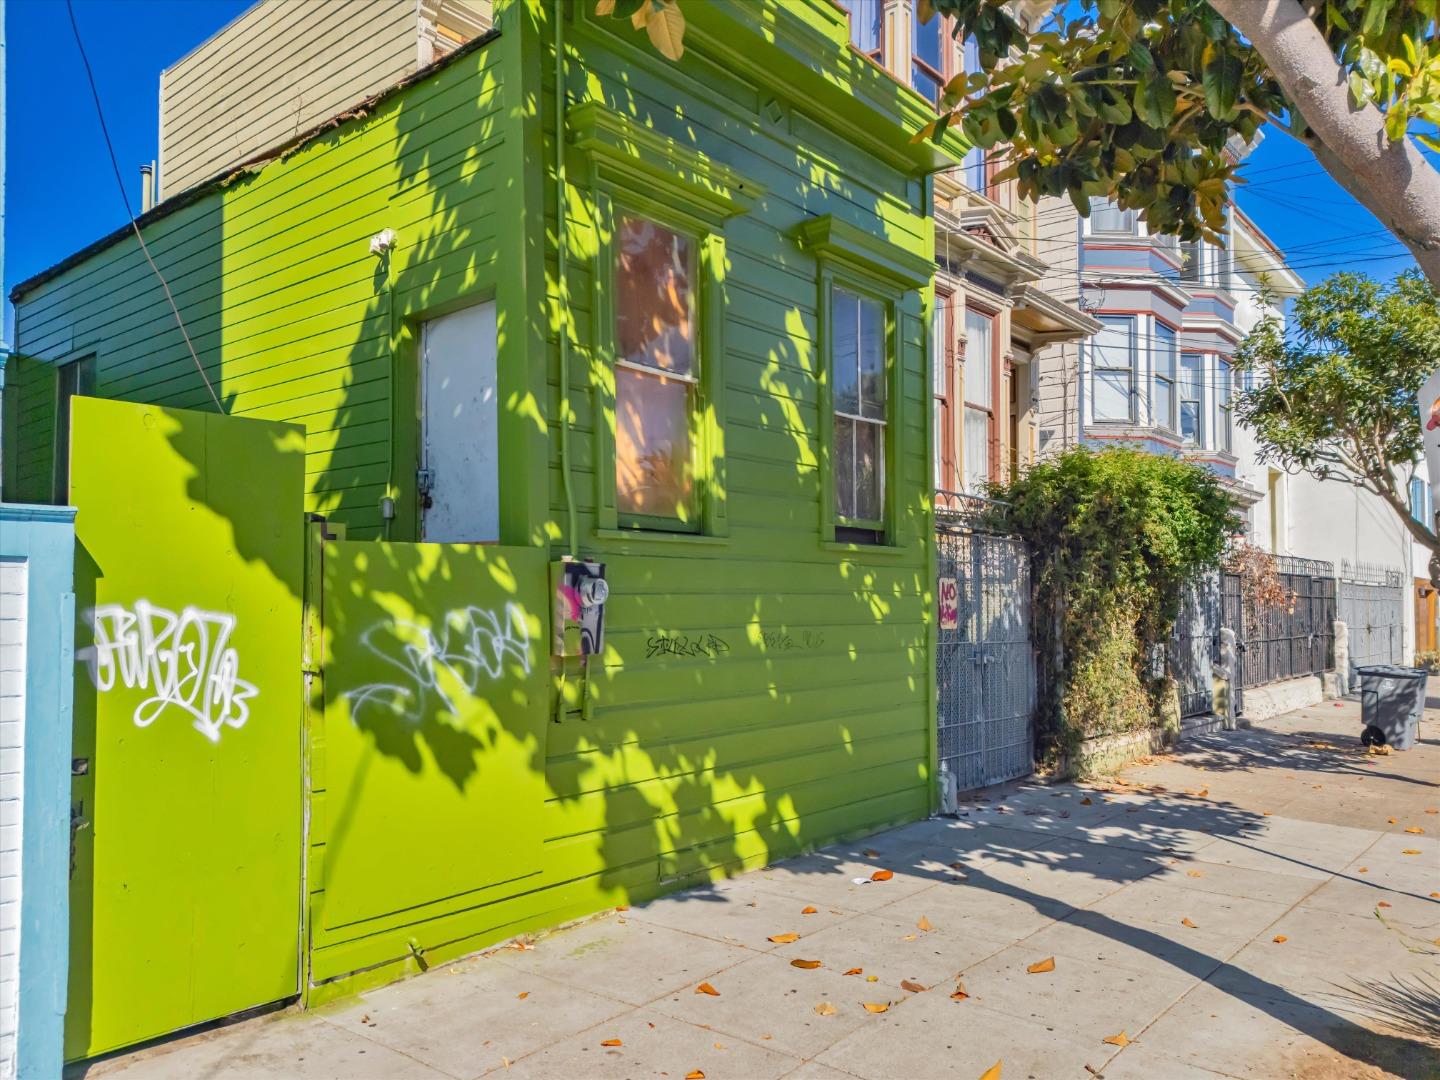
$559,888
1
bds
|
1
ba
|
476
sqft
|
built
1900
1180 Florida St, San Francisco, CA 94110
$-623
Cash flow
-5.8%
Cash-on-Cash Return
4.7%
Cap rate
0.6%
Rent to Value Ratio
$965,000
2
bds
|
2
ba
|
822
sqft
|
built
1908
277 Munich St, San Francisco, CA 94112
$-2,672
Cash flow
-14.4%
Cash-on-Cash Return
2.7%
Cap rate
0.3%
Rent to Value Ratio

$569,000
3
bds
|
2
ba
|
1,015
sqft
|
built
1972
1622 Ukiah Way, Salinas, CA 93906
$-462
Cash flow
-4.2%
Cash-on-Cash Return
5.1%
Cap rate
0.6%
Rent to Value Ratio
$699,000
2
bds
|
3
ba
|
1,204
sqft
|
built
1981
260 W Dunne Ave, Morgan Hill, CA 95037
$-1,578
Cash flow
-11.8%
Cash-on-Cash Return
3.4%
Cap rate
0.5%
Rent to Value Ratio

$750,000
2
bds
|
2
ba
|
1,036
sqft
|
built
1985
350 Creekview Dr, Morgan Hill, CA 95037
$-1,984
Cash flow
-13.8%
Cash-on-Cash Return
2.9%
Cap rate
0.4%
Rent to Value Ratio
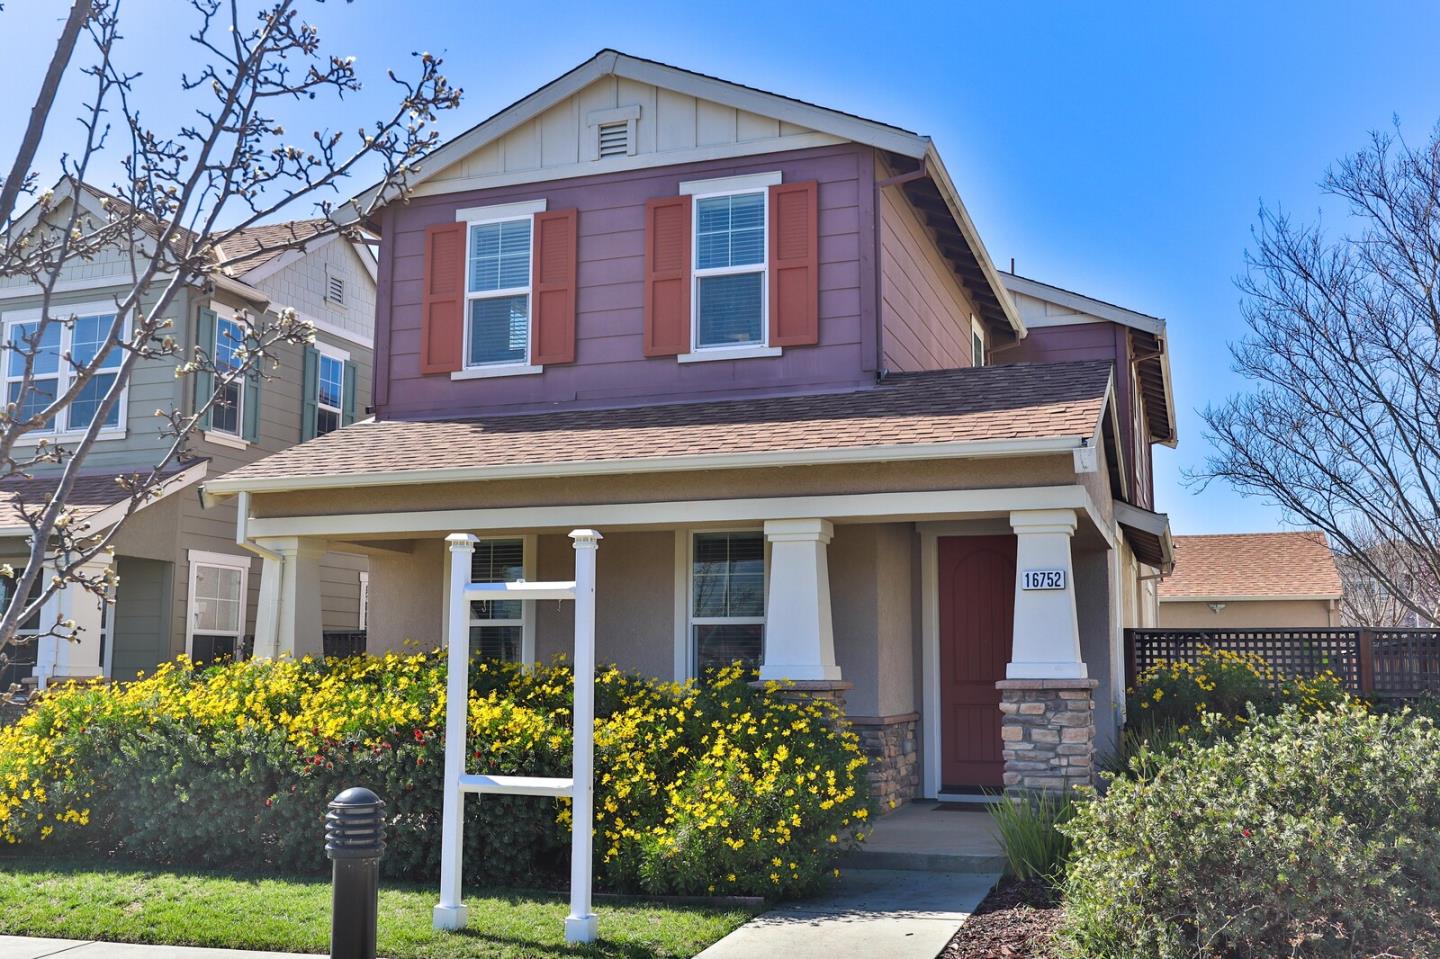
$1,350,000
3
bds
|
3
ba
|
2,180
sqft
|
built
2014
16752 San Clemente Ln, Morgan Hill, CA 95037
$-3,879
Cash flow
-15.0%
Cash-on-Cash Return
2.6%
Cap rate
0.3%
Rent to Value Ratio
$2,468,888
4
bds
|
3
ba
|
3,281
sqft
|
built
2000
15860 Sunnyside Ave, Morgan Hill, CA 95037
$-7,723
Cash flow
-16.3%
Cash-on-Cash Return
2.3%
Cap rate
0.3%
Rent to Value Ratio

$1,195,000
3
bds
|
3
ba
|
1,771
sqft
|
built
2019
810 Saint Rufina Ln, Morgan Hill, CA 95037
$-3,534
Cash flow
-15.4%
Cash-on-Cash Return
2.5%
Cap rate
0.3%
Rent to Value Ratio

$1,596,000
4
bds
|
3
ba
|
2,320
sqft
|
built
2013
655 San Marino Ct, Morgan Hill, CA 95037
$-5,080
Cash flow
-16.6%
Cash-on-Cash Return
2.2%
Cap rate
0.3%
Rent to Value Ratio

$1,179,975
4
bds
|
3
ba
|
2,378
sqft
|
built
2020
1266 Canopy Ln, Morgan Hill, CA 95037
$-3,026
Cash flow
-13.4%
Cash-on-Cash Return
3.0%
Cap rate
0.4%
Rent to Value Ratio
$750,000
3
bds
|
2
ba
|
1,157
sqft
|
built
1973
4008 Farm Hill Blvd, Redwood City, CA 94061
$-1,842
Cash flow
-12.8%
Cash-on-Cash Return
3.1%
Cap rate
0.5%
Rent to Value Ratio

$3,598,000
5
bds
|
3
ba
|
3,060
sqft
|
built
1989
602 Harbor Colony Ct, Redwood City, CA 94065
$-13,242
Cash flow
-19.2%
Cash-on-Cash Return
1.7%
Cap rate
0.2%
Rent to Value Ratio
$1,448,000
3
bds
|
3
ba
|
1,625
sqft
|
built
1997
600 Baltic Cir, Redwood City, CA 94065
$-4,378
Cash flow
-15.8%
Cash-on-Cash Return
2.4%
Cap rate
0.4%
Rent to Value Ratio
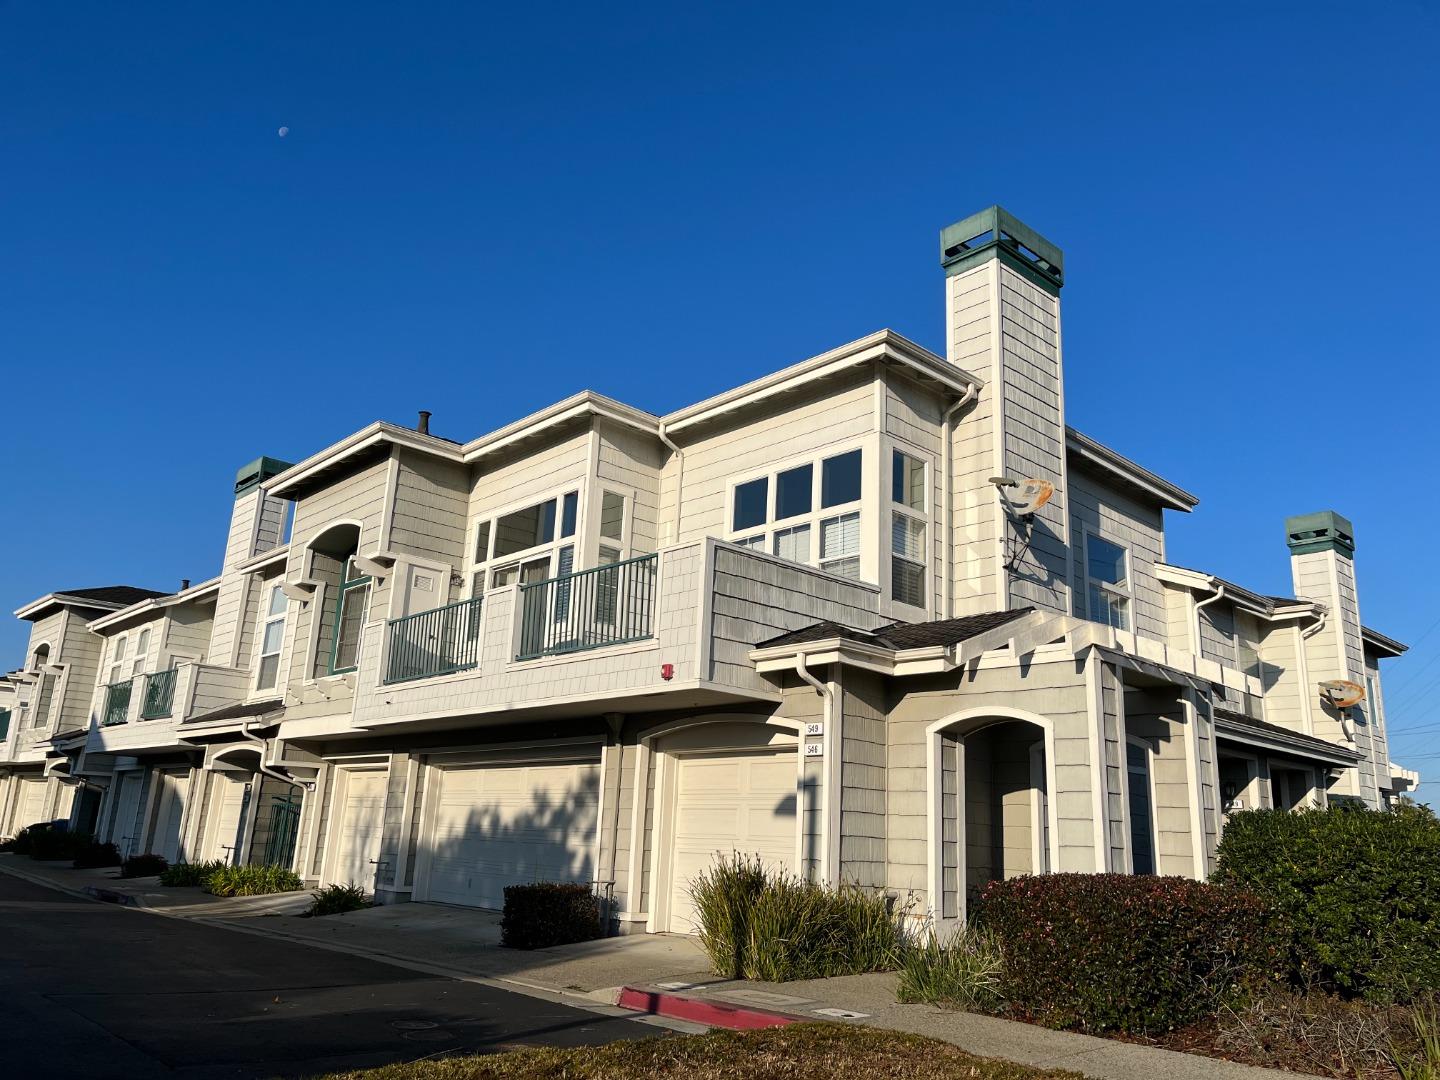
$998,000
1
bds
|
2
ba
|
1,323
sqft
|
built
1992
549 Shoal Cir, Redwood City, CA 94065
$-2,706
Cash flow
-14.1%
Cash-on-Cash Return
2.8%
Cap rate
0.4%
Rent to Value Ratio

$2,300,000
4
bds
|
3
ba
|
3,110
sqft
|
built
1967
46 Morse Ln, Redwood City, CA 94062
$-7,214
Cash flow
-16.4%
Cash-on-Cash Return
2.3%
Cap rate
0.3%
Rent to Value Ratio

$749,000
3
bds
|
2
ba
|
1,530
sqft
|
built
1992
530 Chardonnay Way, Hollister, CA 95023
$-1,579
Cash flow
-11.0%
Cash-on-Cash Return
3.5%
Cap rate
0.4%
Rent to Value Ratio
$975,000
4
bds
|
3
ba
|
2,700
sqft
|
built
1998
2180 Clearview Dr, Hollister, CA 95023
$-2,101
Cash flow
-11.2%
Cash-on-Cash Return
3.5%
Cap rate
0.4%
Rent to Value Ratio

$830,000
5
bds
|
3
ba
|
2,139
sqft
|
built
1997
1261 Crestview Dr, Hollister, CA 95023
$-1,437
Cash flow
-9.0%
Cash-on-Cash Return
4.0%
Cap rate
0.5%
Rent to Value Ratio

$839,999
3
bds
|
2
ba
|
2,027
sqft
|
built
1983
725 Ridgemark Dr, Hollister, CA 95023
$-1,871
Cash flow
-11.6%
Cash-on-Cash Return
3.4%
Cap rate
0.4%
Rent to Value Ratio

$940,000
4
bds
|
2
ba
|
2,866
sqft
|
built
2019
691 Toledo Dr, Hollister, CA 95023
$-1,522
Cash flow
-8.4%
Cash-on-Cash Return
4.1%
Cap rate
0.5%
Rent to Value Ratio