Maryland Investment Properties for Sale
Browse homes for sale and investment properties in Maryland. Refine your search by price, property type, or more.
Best cash flowing properties in Maryland

$88,000
5
bds
|
3
ba
|
1,981
sqft
|
built
1920
1824 Ashburton St, Baltimore, MD 21216
$776
Cash flow
46.0%
Cash-on-Cash Return
16.3%
Cap rate
2.3%
Rent to Value Ratio
$95,000
3
bds
|
1
ba
|
1,224
sqft
|
built
1960
2105 Braddish Ave, Baltimore, MD 21216
$765
Cash flow
42.0%
Cash-on-Cash Return
15.3%
Cap rate
2.0%
Rent to Value Ratio
13 out of 9,400 properties for sale in Maryland
Limited Results Shown
Create a free account, or log in to reveal all property listings and enjoy the complete experience.
$180,000
2
bds
|
1
ba
|
672
sqft
|
built
1941
52 Left Wing Dr, Baltimore, MD 21220
$130
Cash flow
3.8%
Cash-on-Cash Return
6.5%
Cap rate
0.9%
Rent to Value Ratio

$228,500
3
bds
|
2
ba
|
1,216
sqft
|
built
1972
27 Stonehenge Cir, Baltimore, MD 21208
$-291
Cash flow
-6.6%
Cash-on-Cash Return
4.1%
Cap rate
1.0%
Rent to Value Ratio
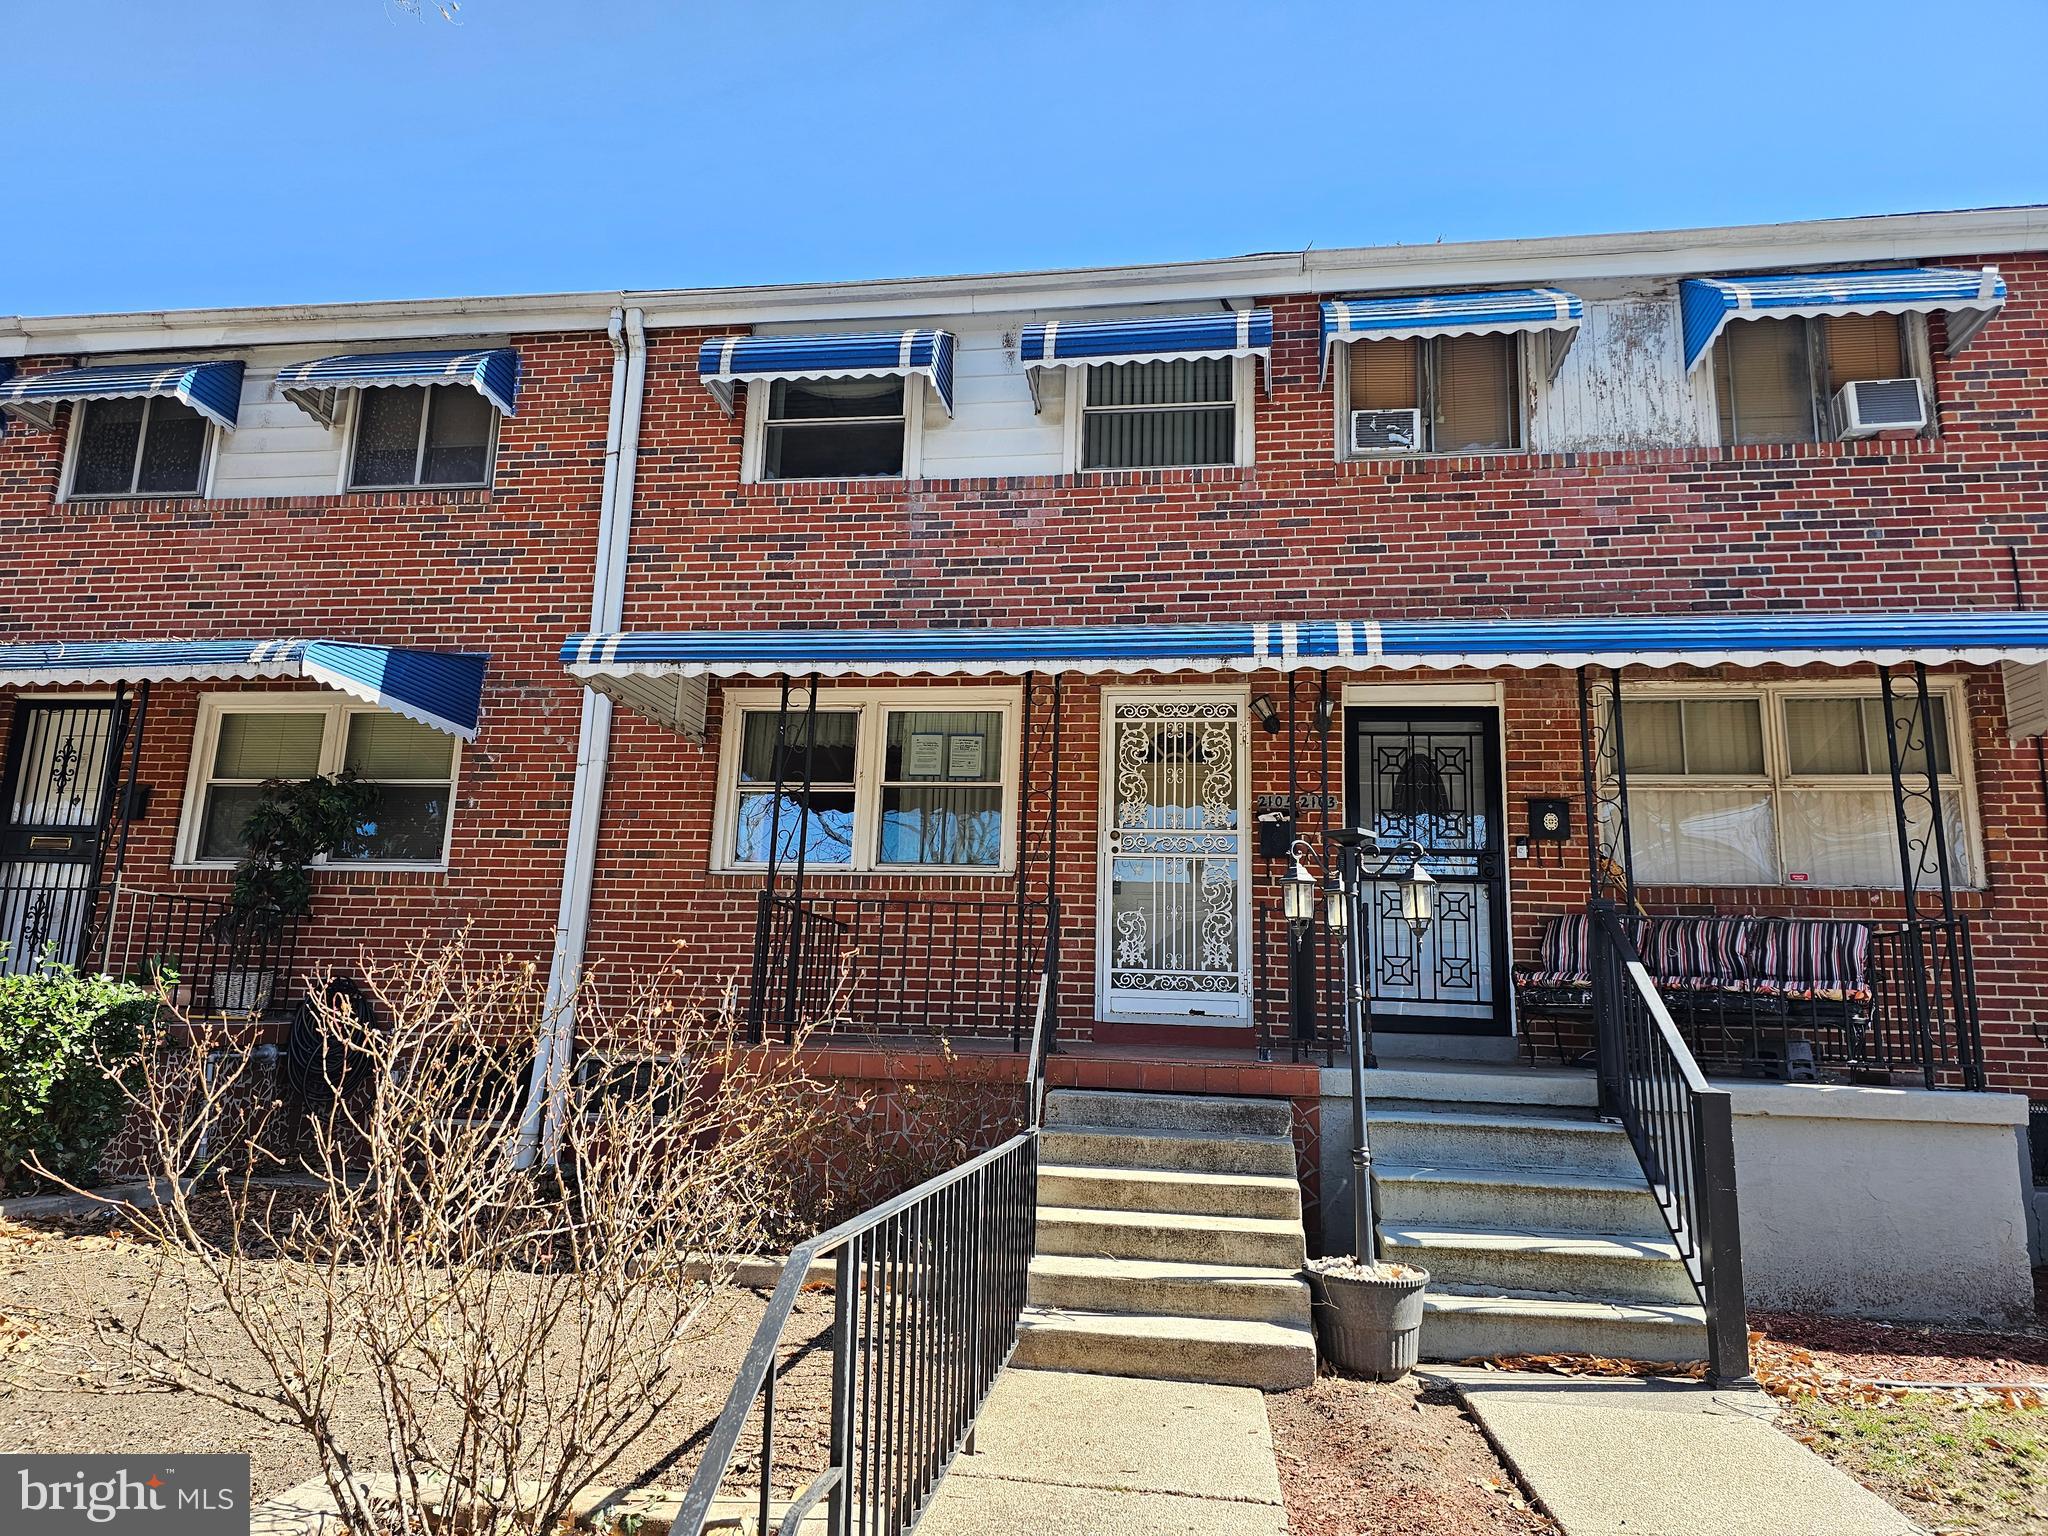
$95,000
3
bds
|
1
ba
|
1,224
sqft
|
built
1960
2105 Braddish Ave, Baltimore, MD 21216
$765
Cash flow
42.0%
Cash-on-Cash Return
15.3%
Cap rate
2.0%
Rent to Value Ratio

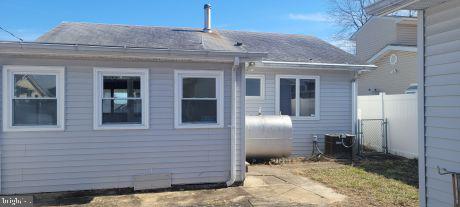
$148,000
3
bds
|
2
ba
|
0
sqft
|
built
1913
1737 E Lafayette Ave, Baltimore, MD 21213
$631
Cash flow
22.2%
Cash-on-Cash Return
10.8%
Cap rate
1.4%
Rent to Value Ratio

$350,000
5
bds
|
2
ba
|
2,471
sqft
|
built
1954
957 Rosedale Ave, Baltimore, MD 21237
$78
Cash flow
1.2%
Cash-on-Cash Return
5.9%
Cap rate
0.8%
Rent to Value Ratio
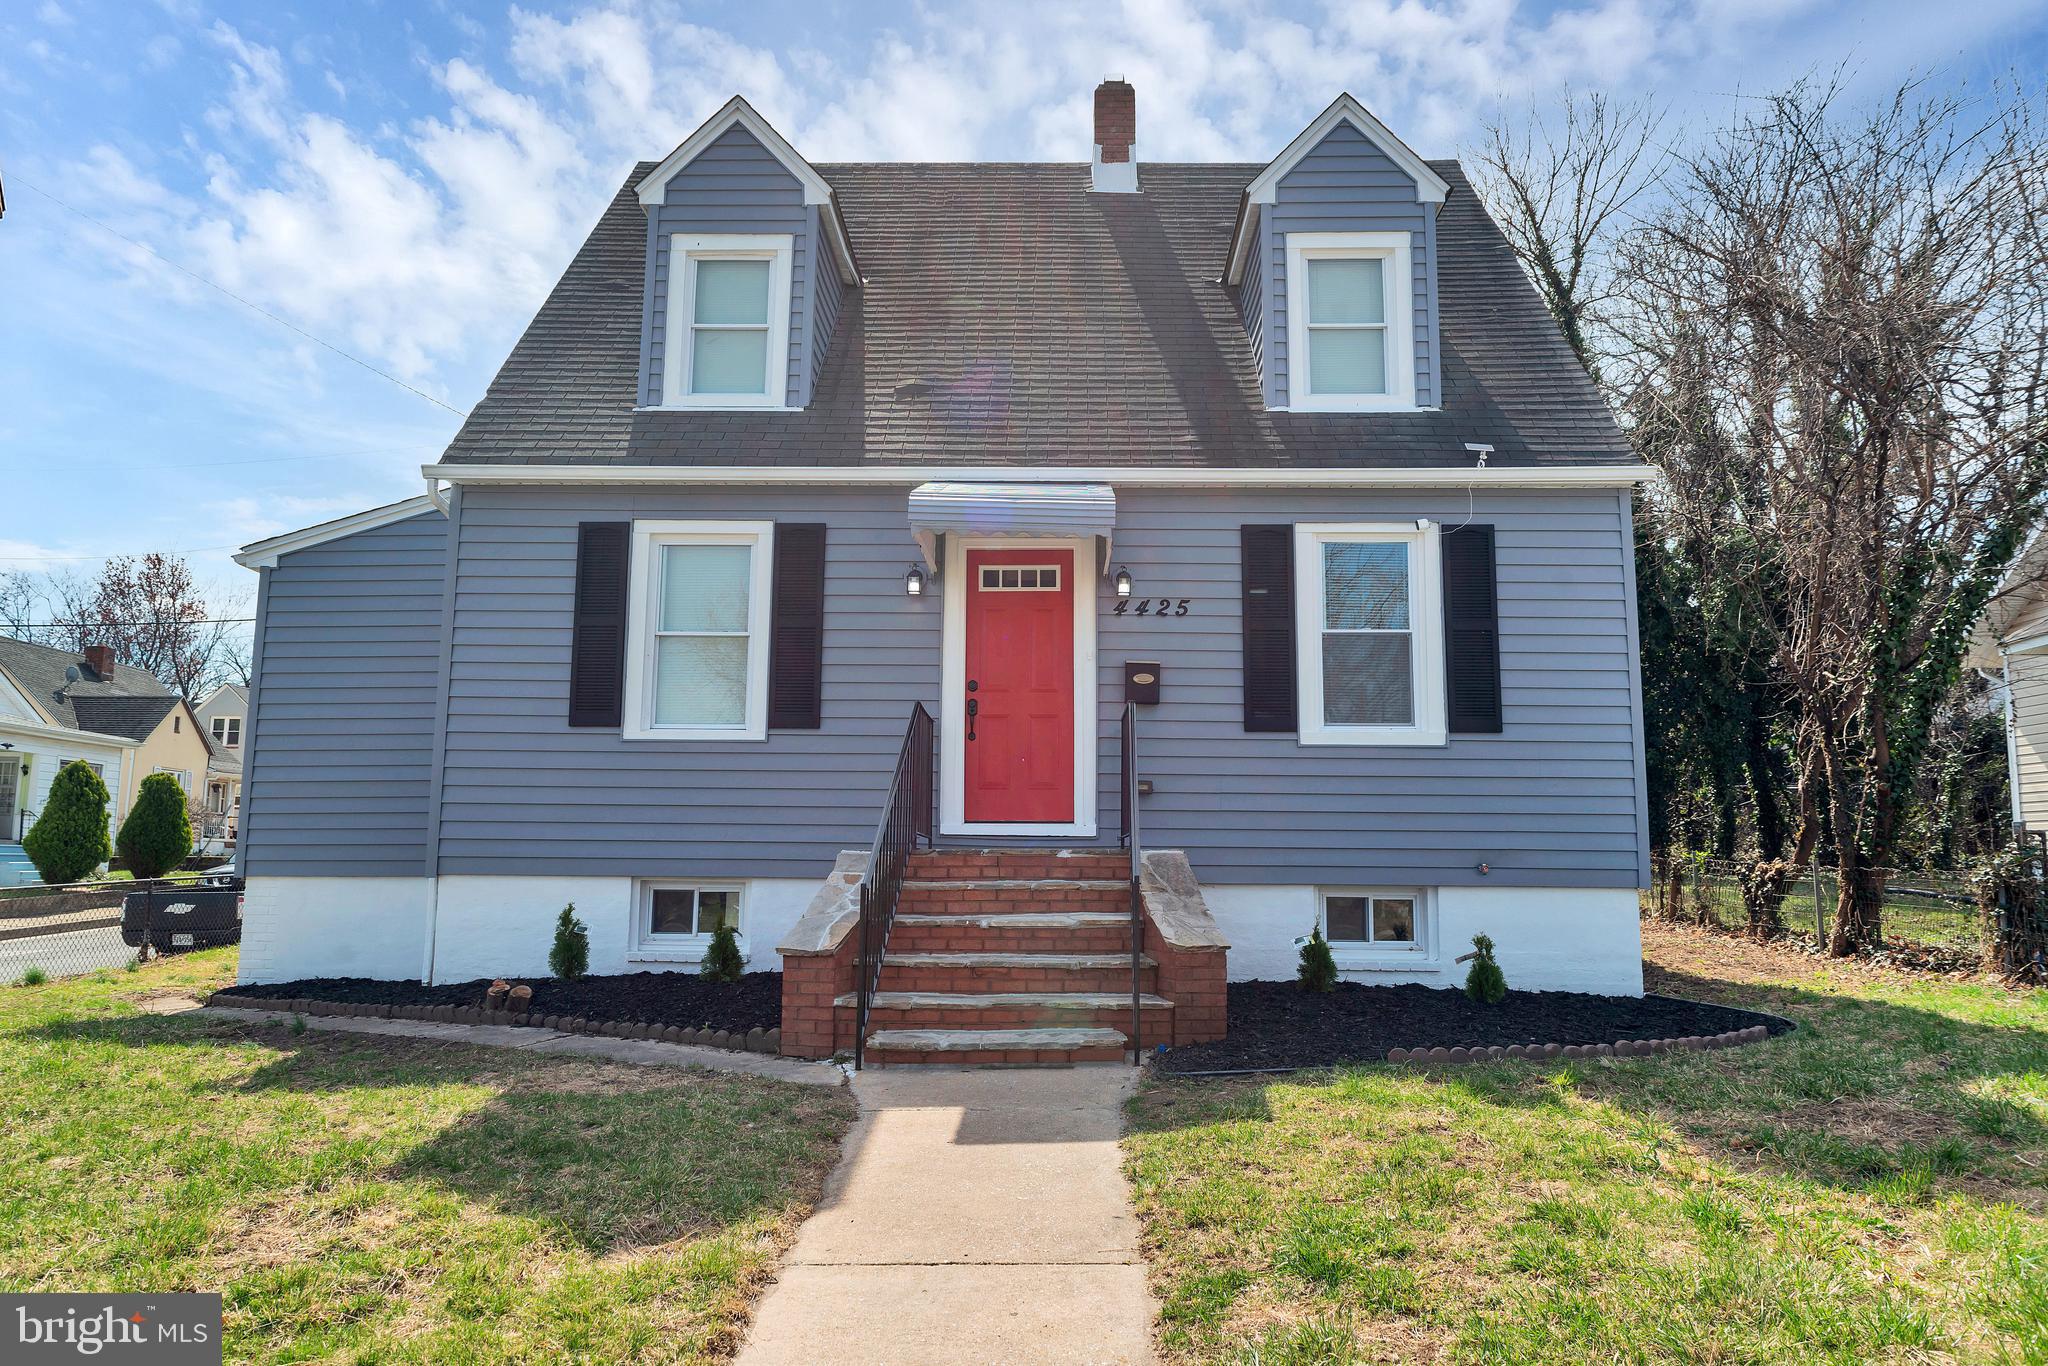
$309,000
3
bds
|
2
ba
|
1,645
sqft
|
built
1942
4425 Furley Ave, Baltimore, MD 21206
$-18
Cash flow
-0.3%
Cash-on-Cash Return
5.6%
Cap rate
0.8%
Rent to Value Ratio
$185,850
4
bds
|
3
ba
|
3,319
sqft
|
built
1920
3703 6th St, Baltimore, MD 21225
$260
Cash flow
7.3%
Cash-on-Cash Return
7.4%
Cap rate
0.9%
Rent to Value Ratio
$230,000
3
bds
|
3
ba
|
1,413
sqft
|
built
1924
3202 Mc Elderry St, Baltimore, MD 21205
$-118
Cash flow
-2.7%
Cash-on-Cash Return
5.1%
Cap rate
0.7%
Rent to Value Ratio
$2,125,000
2
bds
|
3
ba
|
3,742
sqft
|
built
1928
3908 N Charles St, Baltimore, MD 21218
$-11,823
Cash flow
-29.0%
Cash-on-Cash Return
-1.0%
Cap rate
0.3%
Rent to Value Ratio

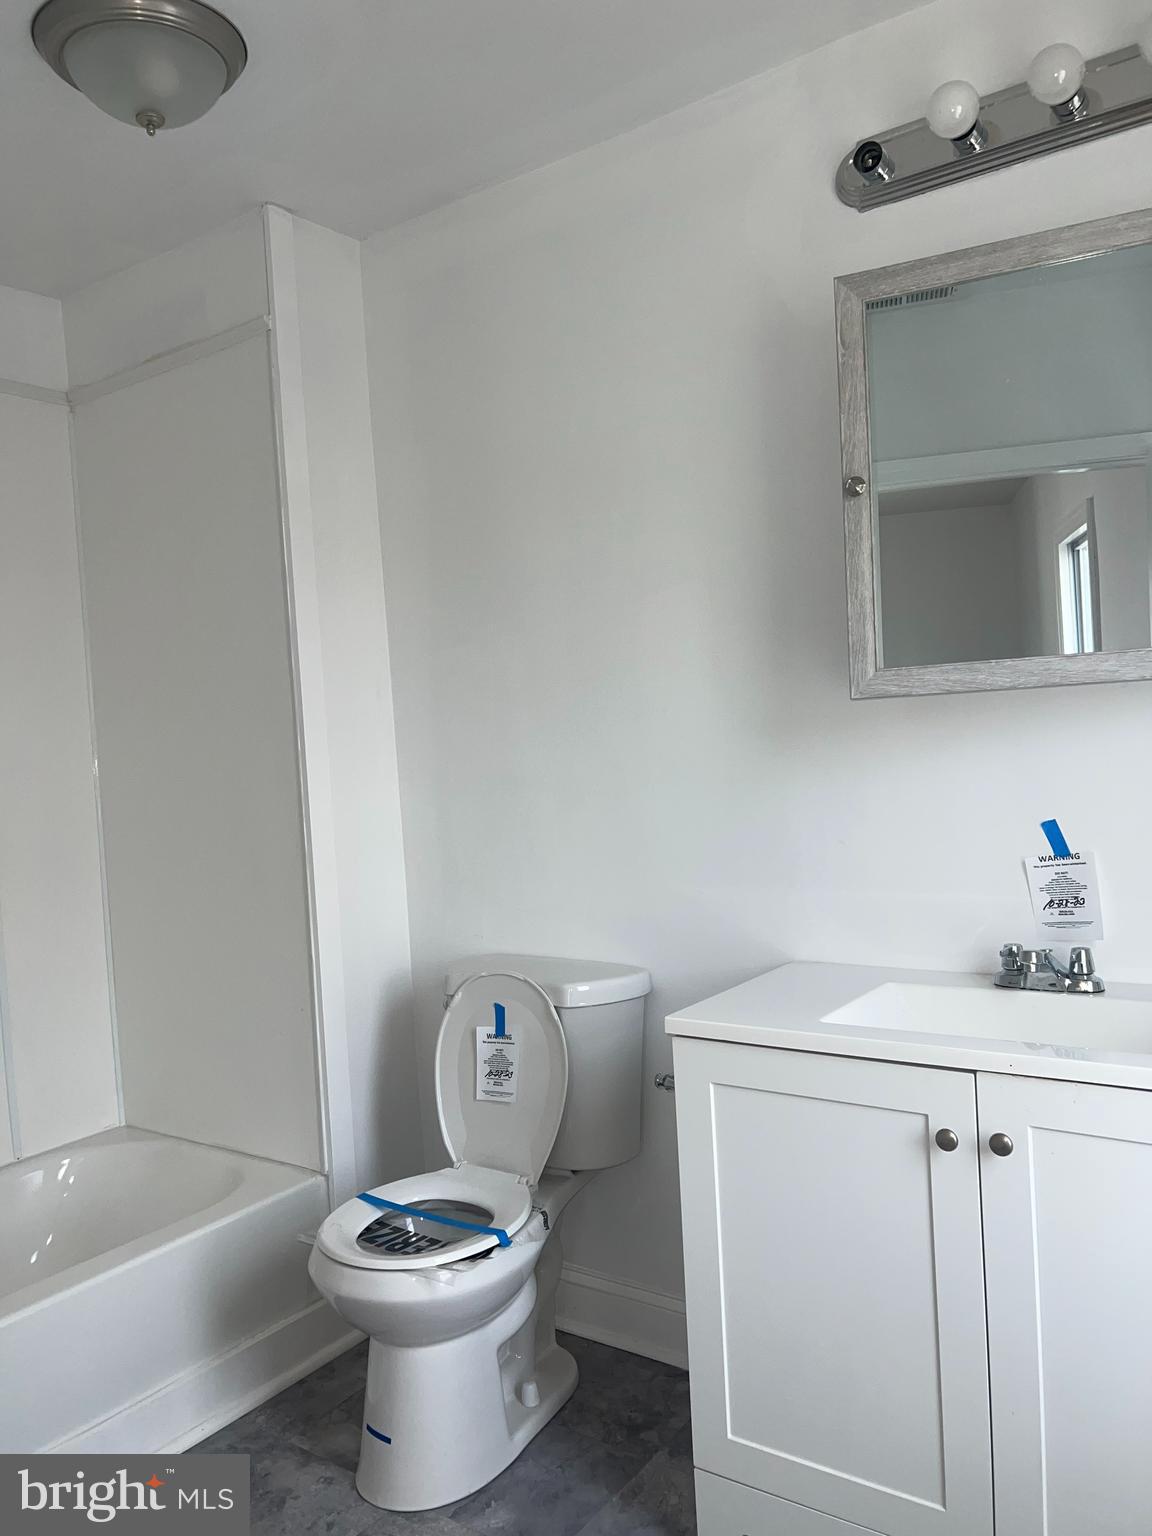
$255,000
3
bds
|
2
ba
|
1,050
sqft
|
built
1954
5901 Shoshone Dr, Oxon Hill, MD 20745
$-73
Cash flow
-1.5%
Cash-on-Cash Return
5.3%
Cap rate
0.9%
Rent to Value Ratio

$96,200
3
bds
|
1
ba
|
0
sqft
|
built
1920
4506 Reisterstown Rd, Baltimore, MD 21215
$681
Cash flow
36.9%
Cash-on-Cash Return
14.2%
Cap rate
1.9%
Rent to Value Ratio
$88,000
5
bds
|
3
ba
|
1,981
sqft
|
built
1920
1824 Ashburton St, Baltimore, MD 21216
$776
Cash flow
46.0%
Cash-on-Cash Return
16.3%
Cap rate
2.3%
Rent to Value Ratio
$402,000
3
bds
|
3
ba
|
1,320
sqft
|
built
1990
17903 Cottonwood Ter, Gaithersburg, MD 20877
$-558
Cash flow
-7.2%
Cash-on-Cash Return
4.0%
Cap rate
0.6%
Rent to Value Ratio