Brandon, MS Investment Properties for Sale
Browse homes for sale and investment properties in Brandon, MS. Refine your search by price, property type, or more.
Best cash flowing properties in Brandon, MS

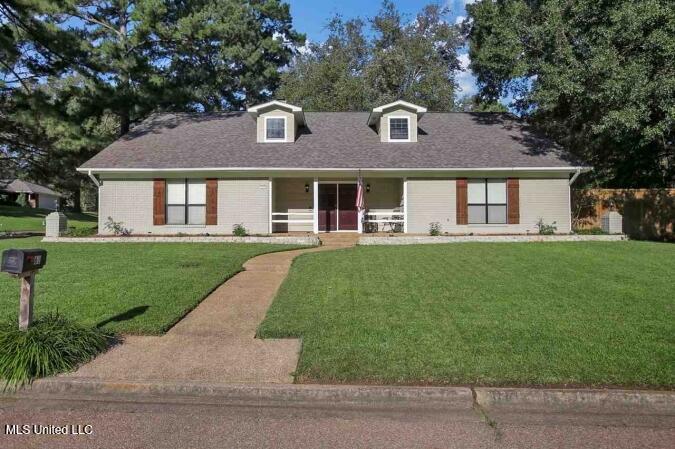
$209,900
4
bds
|
3
ba
|
0
sqft
|
built
1984
545 Dixton Dr, Brandon, MS 39047
$518
Cash flow
12.9%
Cash-on-Cash Return
8.6%
Cap rate
1.2%
Rent to Value Ratio
$200,000
3
bds
|
3
ba
|
0
sqft
|
built
1975
109 Park Ln, Brandon, MS 39047
$439
Cash flow
11.5%
Cash-on-Cash Return
8.3%
Cap rate
1.2%
Rent to Value Ratio
32 out of 198 properties for sale in Brandon, MS
Limited Results Shown
Create a free account, or log in to reveal all property listings and enjoy the complete experience.

$445,000
4
bds
|
5
ba
|
0
sqft
|
built
2005
168 Woodlands Glen Cir, Brandon, MS 39047
$-192
Cash flow
-2.3%
Cash-on-Cash Return
5.2%
Cap rate
0.8%
Rent to Value Ratio
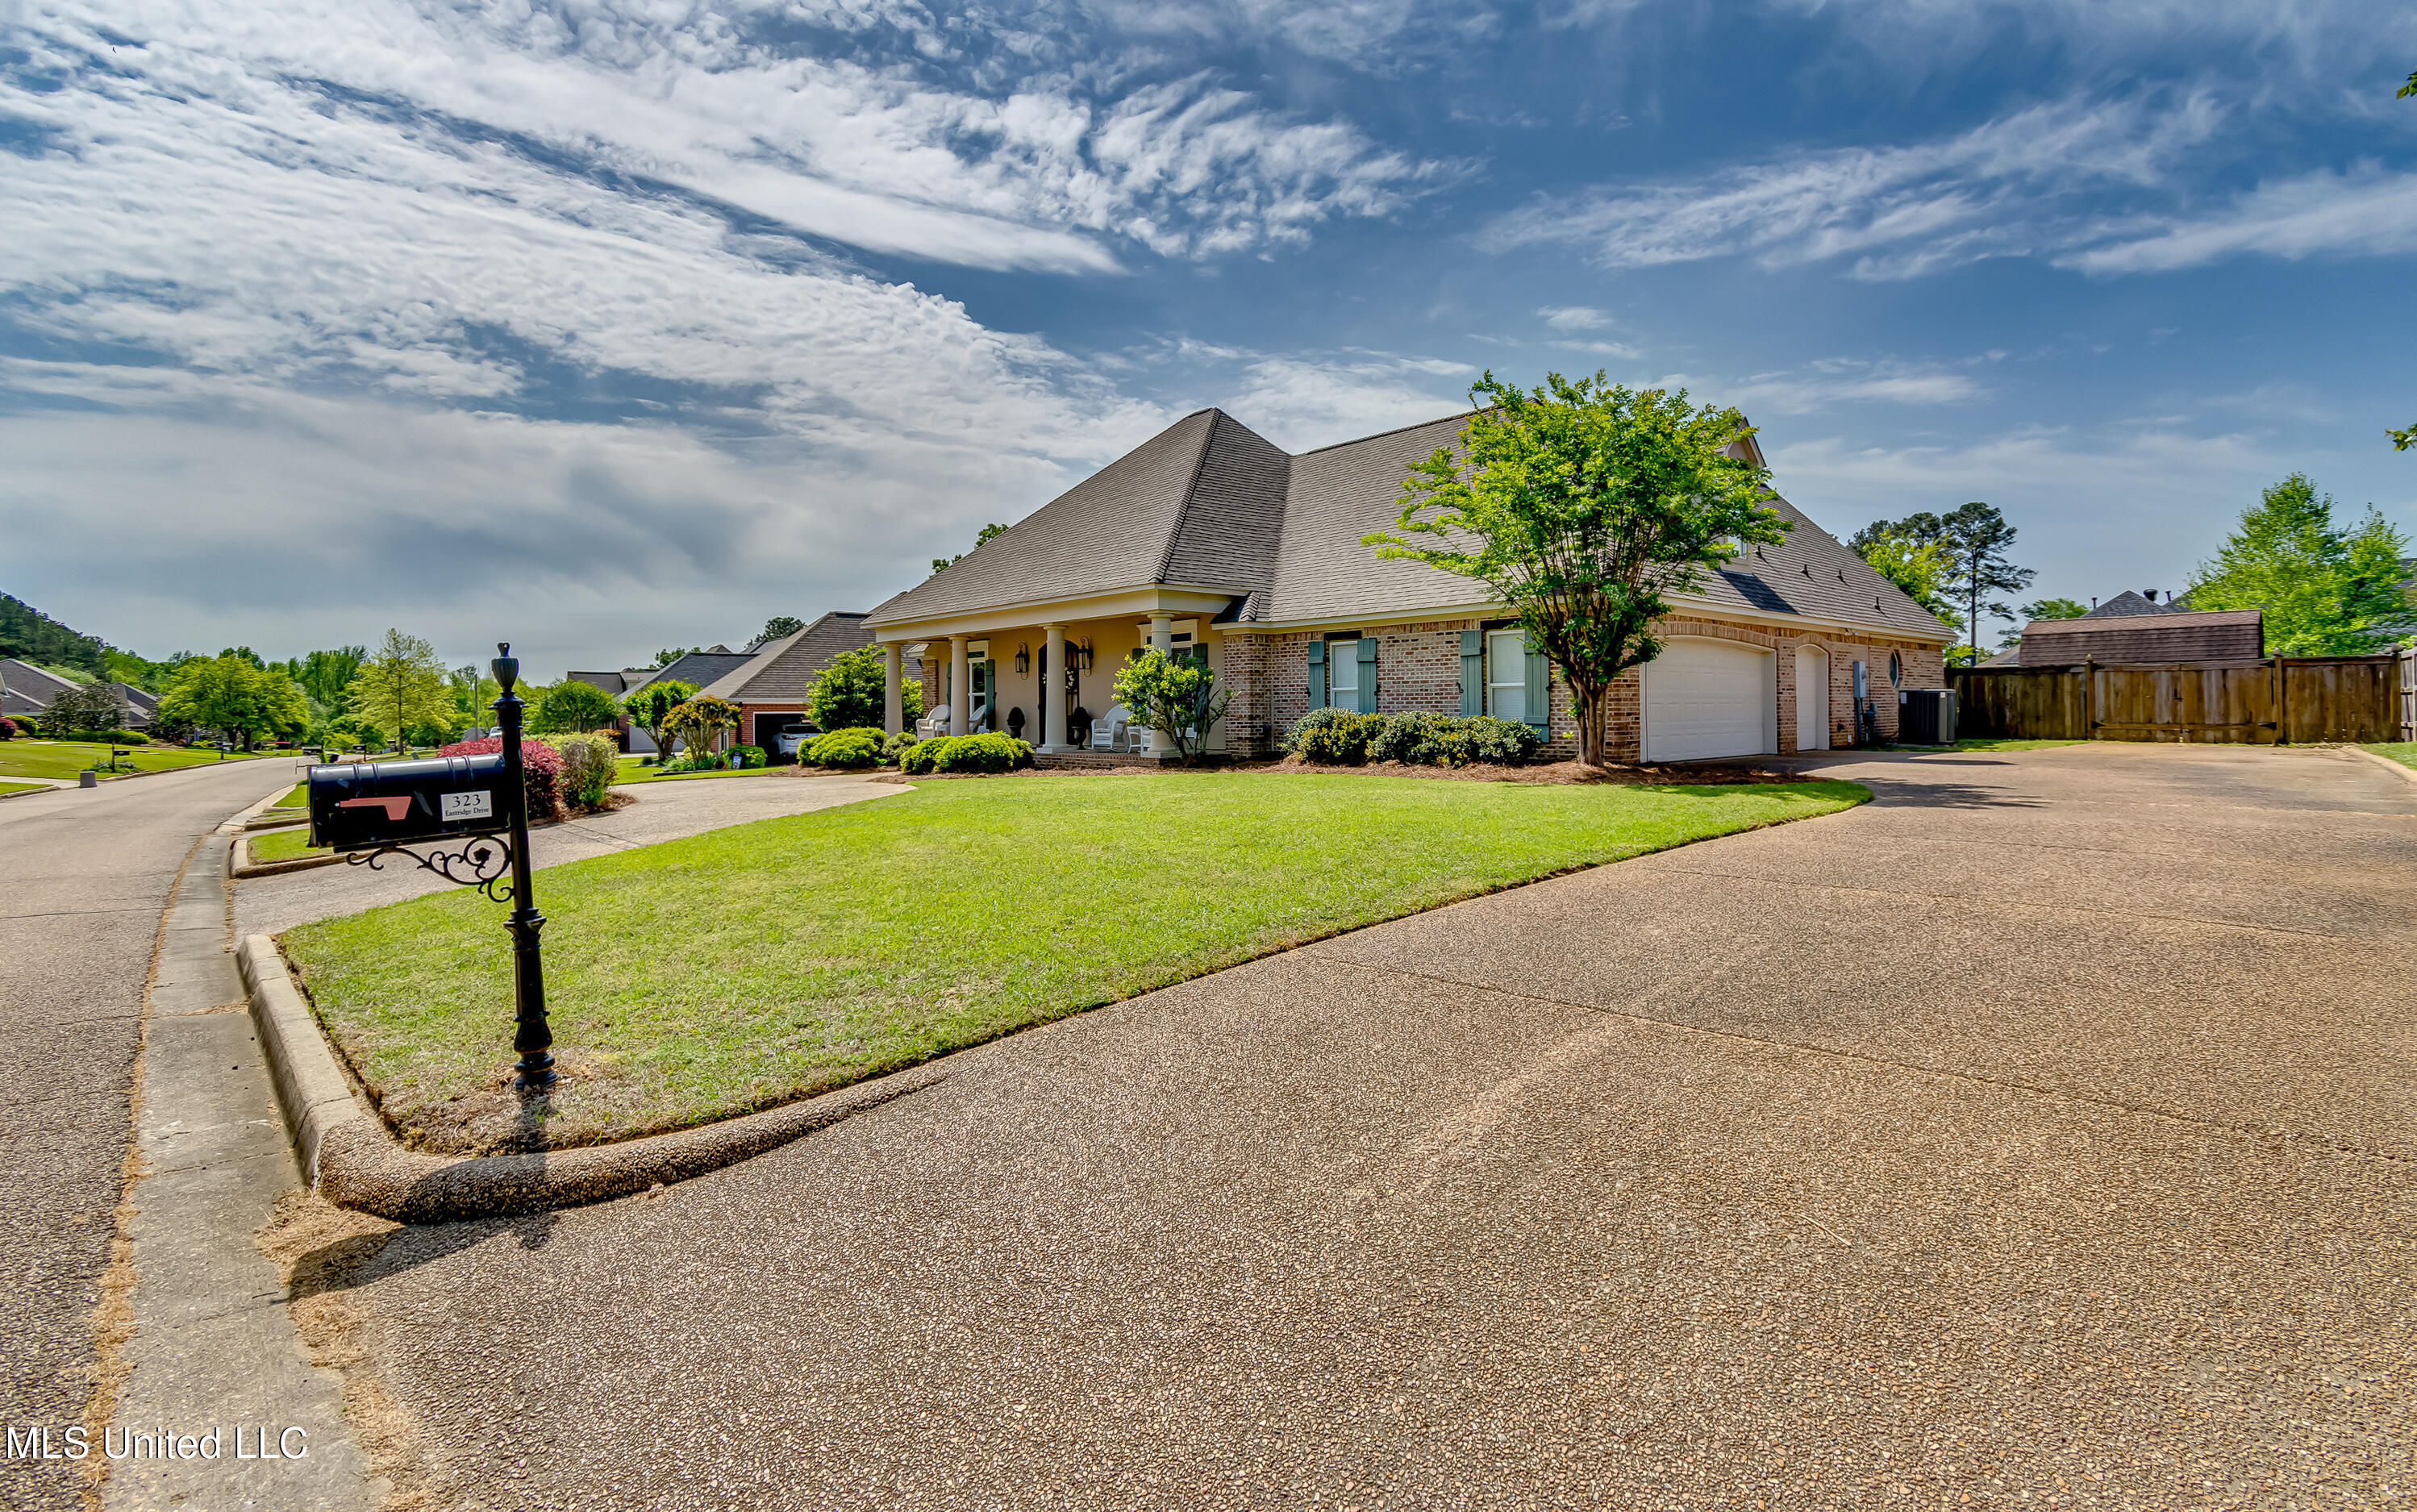
$469,900
5
bds
|
3
ba
|
0
sqft
|
built
2002
323 Eastridge Dr, Brandon, MS 39042
$-493
Cash flow
-5.5%
Cash-on-Cash Return
4.4%
Cap rate
0.6%
Rent to Value Ratio
$315,000
4
bds
|
3
ba
|
0
sqft
|
built
1979
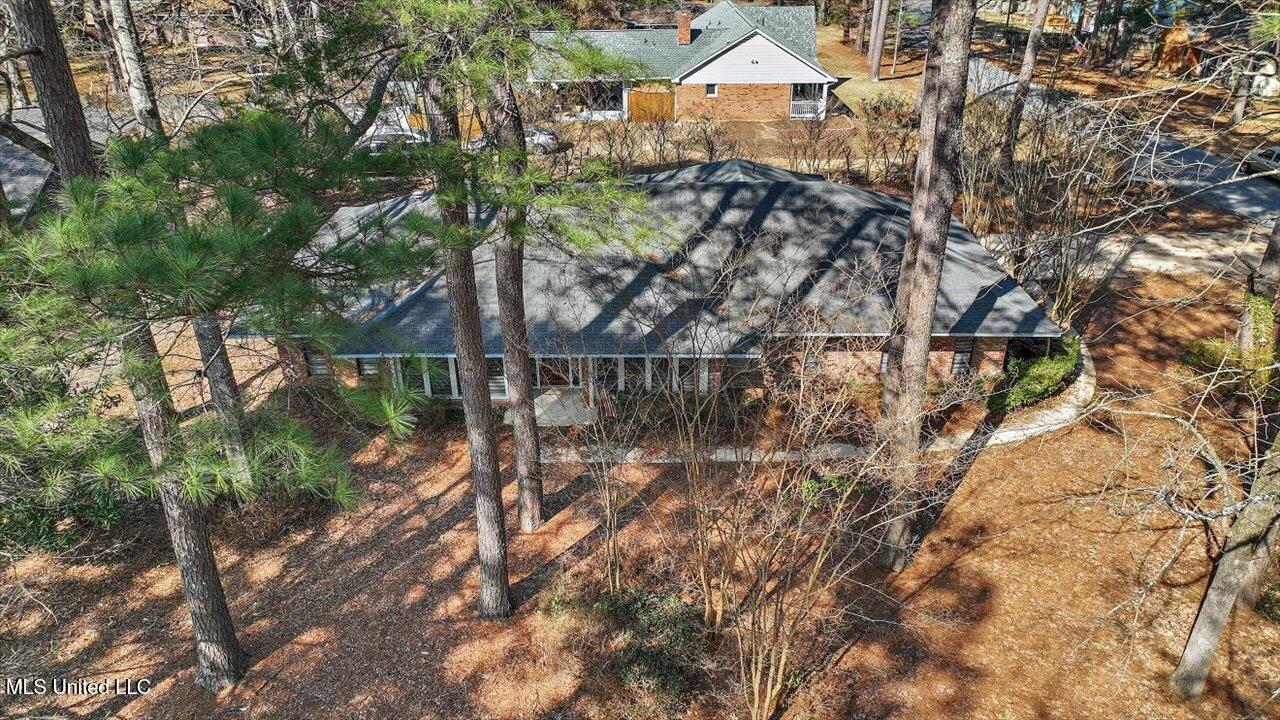
61 Sunline Dr, Brandon, MS 39042
$-60
Cash flow
-1.0%
Cash-on-Cash Return
5.5%
Cap rate
0.8%
Rent to Value Ratio

$265,000
4
bds
|
3
ba
|
0
sqft
|
built
1976
1109 Martin Dr, Brandon, MS 39047
$416
Cash flow
8.2%
Cash-on-Cash Return
7.6%
Cap rate
0.9%
Rent to Value Ratio

$649,900
4
bds
|
4
ba
|
0
sqft
|
built
2017
34 Savannah Cir, Brandon, MS 39047
$-486
Cash flow
-3.9%
Cash-on-Cash Return
4.8%
Cap rate
0.7%
Rent to Value Ratio

$524,900
4
bds
|
3
ba
|
0
sqft
|
built
2006
1012 Woodbridge Dr, Brandon, MS 39047
$-339
Cash flow
-3.4%
Cash-on-Cash Return
4.9%
Cap rate
0.7%
Rent to Value Ratio

$849,999
4
bds
|
4
ba
|
0
sqft
|
built
2022
180 Plantation Blvd, Brandon, MS 39047
$-1,113
Cash flow
-6.8%
Cash-on-Cash Return
4.1%
Cap rate
0.6%
Rent to Value Ratio
$640,000
4
bds
|
4
ba
|
0
sqft
|
built
1960
223 Gulde Rd, Brandon, MS 39042
$-372
Cash flow
-3.0%
Cash-on-Cash Return
5.0%
Cap rate
0.6%
Rent to Value Ratio

$320,000
3
bds
|
2
ba
|
0
sqft
|
built
2011
116 Belle Oak Dr, Brandon, MS 39042
$9
Cash flow
0.1%
Cash-on-Cash Return
5.7%
Cap rate
0.8%
Rent to Value Ratio
$380,000
4
bds
|
3
ba
|
0
sqft
|
built
1999
123 Linwood Dr, Brandon, MS 39042
$-339
Cash flow
-4.7%
Cash-on-Cash Return
4.6%
Cap rate
0.7%
Rent to Value Ratio
$550,000
4
bds
|
4
ba
|
0
sqft
|
built
1986
6076 Grants Ferry Rd, Brandon, MS 39047
$-1,075
Cash flow
-10.2%
Cash-on-Cash Return
3.3%
Cap rate
0.5%
Rent to Value Ratio
$220,000
3
bds
|
2
ba
|
0
sqft
|
built
2004
130 Basswood Cir, Brandon, MS 39047
$296
Cash flow
7.0%
Cash-on-Cash Return
7.3%
Cap rate
0.9%
Rent to Value Ratio
$705,000
5
bds
|
3
ba
|
0
sqft
|
built
2018
708 Falcon Way, Brandon, MS 39047
$-697
Cash flow
-5.2%
Cash-on-Cash Return
4.5%
Cap rate
0.6%
Rent to Value Ratio
$189,900
2
bds
|
2
ba
|
0
sqft
|
built
1978
321 Harbor Ln, Brandon, MS 39047
$289
Cash flow
7.9%
Cash-on-Cash Return
7.5%
Cap rate
0.9%
Rent to Value Ratio
$1,199,000
5
bds
|
5
ba
|
0
sqft
|
built
1999
116 Port Ln, Brandon, MS 39047
$-2,317
Cash flow
-10.1%
Cash-on-Cash Return
3.4%
Cap rate
0.5%
Rent to Value Ratio
$1,375,000
4
bds
|
5
ba
|
0
sqft
|
built
2023
107 Arrowhead Trl, Brandon, MS 39047
$-4,698
Cash flow
-17.8%
Cash-on-Cash Return
1.6%
Cap rate
0.3%
Rent to Value Ratio
$249,500
4
bds
|
2
ba
|
0
sqft
|
built
1970
45 Stonegate Dr, Brandon, MS 39042
$186
Cash flow
3.9%
Cash-on-Cash Return
6.6%
Cap rate
1.0%
Rent to Value Ratio

$295,000
3
bds
|
2
ba
|
0
sqft
|
built
2006
623 Chambord Dr, Brandon, MS 39042
$13
Cash flow
0.2%
Cash-on-Cash Return
5.7%
Cap rate
0.8%
Rent to Value Ratio
$575,000
5
bds
|
4
ba
|
0
sqft
|
built
1975
100 Sandpiper Rd, Brandon, MS 39047
$-813
Cash flow
-7.4%
Cash-on-Cash Return
4.0%
Cap rate
0.5%
Rent to Value Ratio

$635,000
3
bds
|
4
ba
|
0
sqft
|
built
2001
211 Lake Terrace Pl, Brandon, MS 39047
$-819
Cash flow
-6.7%
Cash-on-Cash Return
4.1%
Cap rate
0.6%
Rent to Value Ratio
$312,000
3
bds
|
2
ba
|
0
sqft
|
built
2010
518 Springhill Xing, Brandon, MS 39047
$88
Cash flow
1.5%
Cash-on-Cash Return
6.0%
Cap rate
0.8%
Rent to Value Ratio
$249,900
3
bds
|
2
ba
|
0
sqft
|
built
1980
211 Magnolia Trl, Brandon, MS 39047
$361
Cash flow
7.5%
Cash-on-Cash Return
7.4%
Cap rate
0.9%
Rent to Value Ratio
$274,500
3
bds
|
2
ba
|
0
sqft
|
built
2000
290 Azalea Ct, Brandon, MS 39047
$233
Cash flow
4.4%
Cash-on-Cash Return
6.7%
Cap rate
0.9%
Rent to Value Ratio
$282,500
4
bds
|
2
ba
|
0
sqft
|
built
2020
1514 Arcadia Ln, Brandon, MS 39042
$-47
Cash flow
-0.9%
Cash-on-Cash Return
5.5%
Cap rate
0.8%
Rent to Value Ratio
$315,000
3
bds
|
2
ba
|
0
sqft
|
built
1997
177 Apple Blossom Dr, Brandon, MS 39047
$-278
Cash flow
-4.6%
Cash-on-Cash Return
4.6%
Cap rate
0.7%
Rent to Value Ratio
$725,000
4
bds
|
4
ba
|
0
sqft
|
built
2004
1109 Foxpoint, Brandon, MS 39047
$-617
Cash flow
-4.4%
Cash-on-Cash Return
4.7%
Cap rate
0.6%
Rent to Value Ratio

$519,500
4
bds
|
4
ba
|
0
sqft
|
built
2022
1003 Crepe Myrtle Dr, Brandon, MS 39047
$-323
Cash flow
-3.2%
Cash-on-Cash Return
4.9%
Cap rate
0.7%
Rent to Value Ratio
$215,800
3
bds
|
3
ba
|
0
sqft
|
built
1980
29 Lake Barnett Dr, Brandon, MS 39047
$-62
Cash flow
-1.5%
Cash-on-Cash Return
5.3%
Cap rate
0.9%
Rent to Value Ratio
$374,900
3
bds
|
3
ba
|
0
sqft
|
built
1994
199 Mandarin Dr, Brandon, MS 39047
$-362
Cash flow
-5.0%
Cash-on-Cash Return
4.5%
Cap rate
0.6%
Rent to Value Ratio
$209,900
4
bds
|
3
ba
|
0
sqft
|
built
1984
545 Dixton Dr, Brandon, MS 39047
$518
Cash flow
12.9%
Cash-on-Cash Return
8.6%
Cap rate
1.2%
Rent to Value Ratio
$200,000
3
bds
|
3
ba
|
0
sqft
|
built
1975
109 Park Ln, Brandon, MS 39047
$439
Cash flow
11.5%
Cash-on-Cash Return
8.3%
Cap rate
1.2%
Rent to Value Ratio
$312,000
3
bds
|
2
ba
|
0
sqft
|
built
2003
412 Dunlin Ct, Brandon, MS 39047
$277
Cash flow
4.6%
Cash-on-Cash Return
6.7%
Cap rate
0.9%
Rent to Value Ratio