$1,199,000
Investment Summary
- Monthly Cash Flow
- -$2,317
- Cap Rate
- 3.4%
- Cash-on-Cash Return
- -10.1%
- Debt Coverage Ratio
- 0.59
- Internal Rate of Return (5 years)
- -5.8%
Cash Flow
Net Operating Income (NOI) minus mortgage payments.
Calculation:
NOI - Mortgage Payments
Cap Rate (Market Value)
Capitalization Rate is a rate of return that compares the yearly Net Operating Income (NOI) to the market value.
Calculation:
NOI / Market Value
Cash-on-Cash Return (CoC)
Annual cash flow divided by initial cash invested.
Calculation:
Annual Cash Flow / Cash Invested
Debt Coverage Ratio (DCR)
Net Operating Income (NOI) divided by total debt payments.
Calculation:
NOI / Total Debt Payments
Internal Rate of Return (IRR)
A metric for assessing profitability over time. IRR is the discount rate at which the net present value (NPV) of all future cash flows (positive and negative) from an investment equals zero — including both periodic cash flow (such as rent) and a projected sale at the end of the holding period. It represents the expected annualized return, accounting for income, expenses, and the recovery of capital through a future sale.
Calculation:
(Future Value / Present Value) ** (1 / Years) - 1
Property Description
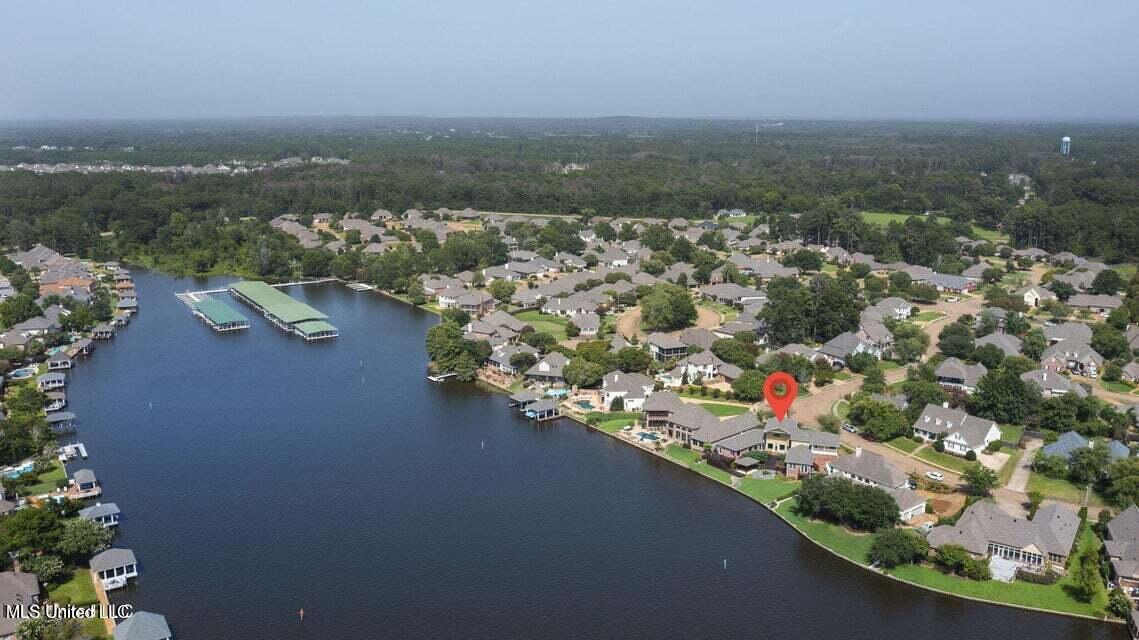
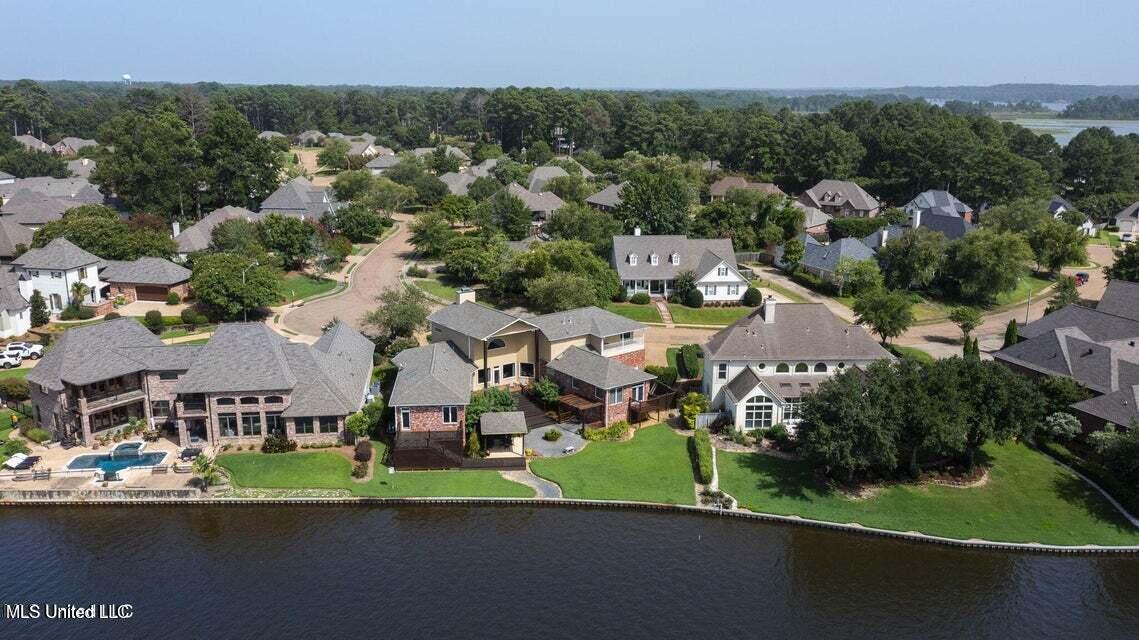
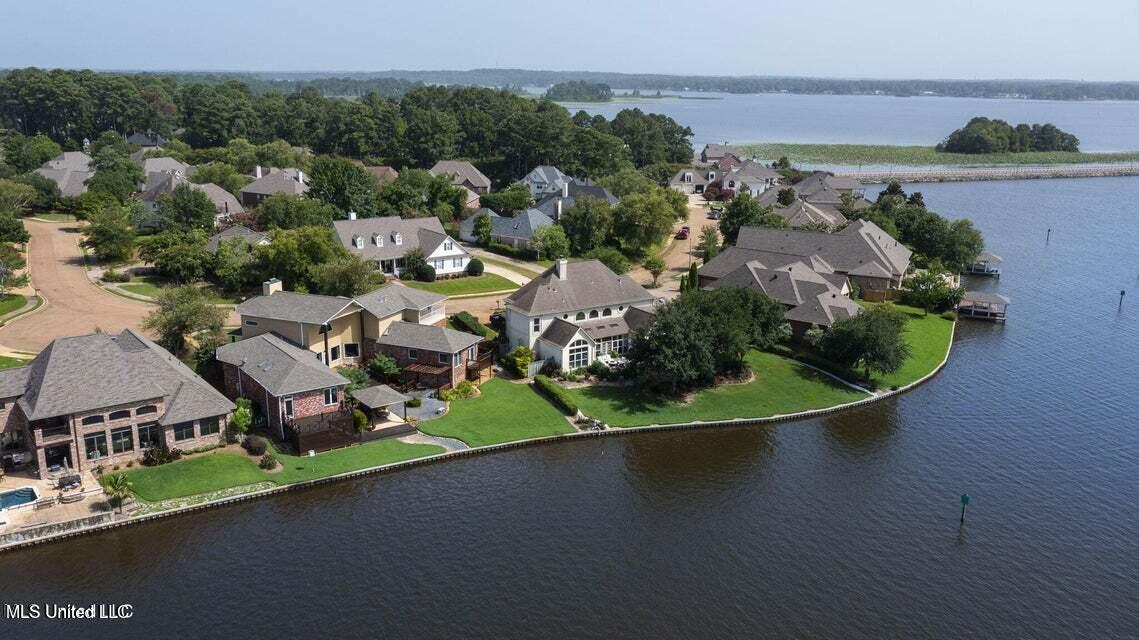
Southern Waterfront Elegance: A Hidden Gem on Ross Barnett Reservoir Nestled within an exclusive, gated community on the shimmering shoreline of the Ross Barnett Reservoir in Brandon, Mississippi, a masterpiece of architecture and craftsmanship awaits its next chapter. With nearly 5,200 square feet of meticulously designed living space, 116 Port Lane is more than just a home—it's a statement. From the moment you step through the front doors, it's clear this residence is unlike anything else on the water. Guests are welcomed into a striking brick-floored foyer, where a dramatic 30-foot ceiling sets the tone for the grandeur to come. The space opens into a light-filled living and dining area, framed by expansive windows that capture sweeping, uninterrupted views of the reservoir. This home doesn't whisper elegance—it speaks it fluently. The layout unfolds in a unique horseshoe design, allowing for bold architectural lines, beautiful sightlines, and the perfect balance of privacy and openness. Constructed with a 12-foot deep foundation and reinforced with metal infrastructure, the build quality is not only impressive—it's exceptional. Stability, longevity, and peace of mind were clearly top priorities. At the heart of the home is a gourmet kitchen that dreams are made of. Outfitted with premium stainless steel appliances—including a professional-grade Wolf double oven with six gas burners and a griddle—it's a space built for both serious cooking and casual gathering. A handcrafted island, topped with rare exotic woods, anchors the kitchen and serves as a true conversation piece. Just steps away, a full wet bar with a custom-built wine rack, cooler, and pecan wood countertop promises effortless entertaining. The residence boasts five spacious bedrooms, each with its own private en-suite bathroom. Two luxurious master suites offer serene waterfront views and access to private porches, perfect for enjoying morning coffee as the sun rises over the reservoir. The primary master bathroom features a spa-like design with a soaking tub and separate shower. While the interiors impress at every turn, the lifestyle this property affords is what truly sets it apart. Step outside to the community marina and you'll find your private, covered boat slip—ideal for impromptu sunset cruises or weekend fishing trips. Whether you prefer to relax with a book on the porch or entertain guests with panoramic water views as your backdrop, this home offers the perfect blend of luxury and leisure. In a world of cookie-cutter construction, 116 Port Lane stands tall as a custom creation of rare character, high-end finishes, and timeless design. With over $150,000 in thoughtful renovations, this home is a testament to the idea that exceptional living begins with exceptional vision. Waterfront luxury has found its finest expression here. The only thing missing is you.
Build Your Team
Quickly find investor-friendly professionals who can help you succeed in real estate investing at any stage of the investing journey.


Agents
Match with investor-friendly agents who can help you find, analyze, and close your next deal


Lenders
Get the best funding…find investor-friendly lenders who specialize in your deal strategy


Property Managers
Transition to passive investing. Find a trusted property management partnership that lasts.


Tax Pros & Accountants
Taxes and financial reporting made easy—find experts to create tax savings strategies, file taxes, and more
Location
Property Details
Parking
- Description: Attached, Garage Door Opener
- Details: Garage Door Opener, Storage, Concrete
- Garage Spaces: 2
- Spaces Total: 0
Bedroom Information
- # of Bedrooms: 5
Bathroom Information
- # of Baths (Full): 5
- # of Baths (Total): 5.0
Interior Features
- # of Rooms: 12
- # of Stories: 1
- Fireplace: Yes
Exterior Features
- Exterior Walls Materials: Brick Veneer
- Foundation: Slab
- Roof Type: Hip
HOA
- Has HOA: Yes
- HOA Fee: $335/semi-annually
Land Information
- Land Use: Residential
- Land Use Subtype: Single Family Residential
Lot Information
- Parcel ID: H1300003400250
- Lot Size: 16988 sqft
Property Information
- Property Type: Single Family Residence
- Style: Mediterranean/Spanish
- Year Built: 1999
Tax Information
- Annual Tax: $5,406
Utilities
- Water & Sewer: Public
- Heating: Central, Fireplace(s)
- Cooling: Central Air, Ceiling Fan(s), Gas
Location
- County: Rankin
Listing Details
Investment Summary
- Monthly Cash Flow
- -$2,317
- Cap Rate
- 3.4%
- Cash-on-Cash Return
- -10.1%
- Debt Coverage Ratio
- 0.59
- Internal Rate of Return (5 years)
- -5.8%
Cash Flow
Net Operating Income (NOI) minus mortgage payments.
Calculation:
NOI - Mortgage Payments
Cap Rate (Market Value)
Capitalization Rate is a rate of return that compares the yearly Net Operating Income (NOI) to the market value.
Calculation:
NOI / Market Value
Cash-on-Cash Return (CoC)
Annual cash flow divided by initial cash invested.
Calculation:
Annual Cash Flow / Cash Invested
Debt Coverage Ratio (DCR)
Net Operating Income (NOI) divided by total debt payments.
Calculation:
NOI / Total Debt Payments
Internal Rate of Return (IRR)
A metric for assessing profitability over time. IRR is the discount rate at which the net present value (NPV) of all future cash flows (positive and negative) from an investment equals zero — including both periodic cash flow (such as rent) and a projected sale at the end of the holding period. It represents the expected annualized return, accounting for income, expenses, and the recovery of capital through a future sale.
Calculation:
(Future Value / Present Value) ** (1 / Years) - 1
Purchase Details
|
The price paid for the property. Purchase price:
| $1,199,000 |
|---|---|
|
The amount of the purchase financed through a loan. Amount financed:
| -$959,200 |
Down paymentThe initial payment made towards the purchase. Calculation:Purchase price - Amount financed Down payment:
| $239,800 |
Closing costsFees and expenses associated with purchasing a property, typically ranging from 2% to 5% of the home’s purchase price, paid at the end of a home purchase to cover services like lending, title transfer, and taxes. Closing costs:
| $35,970 |
|
Costs incurred to repair or improve the property. Rehab costs:
| $0 |
Initial cash investedTotal initial cash invested in the property. Calculation:Down payment + Buying costs + Rehab costs Initial cash invested:
| $275,770 |
|
The total square footage (SQFT) of the property. Square feet:
| 0 |
|
Cost per square foot of the property. Calculation:Purchase price / Square feet Cost per square foot:
| n/a |
|
Monthly rent divided by square footage. Calculation:Monthly rent / Square feet Monthly rent per square foot:
| n/a |
Financing Details
Loan amountThe total sum of money borrowed from a lender to finance a property purchase. Calculation:Purchase Price - Down Payment
Loan amount:
| $959,200 |
|---|---|
Loan to Value Ratio (LTV)Loan amount divided by the market value of the property. Calculation:Loan Amount / Market Value
Loan to value ratio:
| 80.0% |
Loan typeThe type of loan (e.g., fixed, adjustable).
Loan type:
| Amortizing |
TermThe loan repayment period in years.
Term:
| 30 years |
Interest RateThe percentage a lender charges on the borrowed amount of a loan, determining the cost of borrowing money.
Interest rate:
| 5.875% |
Principle & Interest (PI)The principle is the portion of the loan payment that reduces the loan balance. The interest is the lender's charge for borrowing money.
Principle & interest:
| $5,674 |
Property TaxesAnnual taxes levied by local governments on real estate properties. These taxes fund public services like schools, roads, and emergency services. Calculation:Assumes 12% of gross rental income, unless public tax records are available.
Property tax:
| $451 |
InsuranceThe costs for insurance coverage to protect against financial losses due to risks like fire, natural disasters, theft, liability, or tenant-related damages. Calculation:Assumes 7% of gross rental income, unless insurance rates are specified.
Insurance:
| $392 |
Private Mortgage Insurance (PMI)A fee that borrowers pay when they take out a conventional loan with a loan-to-value (LTV) ratio above 80%.
Private mortgage insurance (PMI):
| $0 |
|
The fixed amount a borrower pays each month to repay a loan. It typically includes principal and interest (P&I) and may also cover property taxes, insurance, HOA fees, and PMI if escrowed. Monthly payment:
| $6,517 |
Operating Income
| % Rent | Monthly | Yearly | |
|---|---|---|---|
Gross RentThe total rental income received from tenants before deducting any expenses. Includes base rent, late fees, pet fees, parking fees, and other recurring charges.
Gross rent:
| $5,600 | $67,200 | |
Vacancy LossExpected loss of rent due to vacancies.
Vacancy loss:
(6%)
| 6% | -$336 | -$4,032 |
Operating IncomeGross rental income minus vacancy loss. Calculation:Gross rent - Vacancy loss
Operating income:
| $5,264 | $63,168 |
Operating Expenses
| % Rent | Monthly | Yearly | |
|---|---|---|---|
Property TaxesAnnual taxes levied by local governments on real estate properties. These taxes fund public services like schools, roads, and emergency services. Calculation:Assumes 12% of gross rental income, unless public tax records are available. | 8% | -$451 | -$5,406 |
InsuranceThe costs for insurance coverage to protect against financial losses due to risks like fire, natural disasters, theft, liability, or tenant-related damages. Calculation:Assumes 7% of gross rental income, unless insurance rates are specified. | 7% | -$392 | -$4,704 |
Property ManagementThe costs associated with hiring a property manager to handle the day-to-day operations of a rental property. Includes management fees, leasing fes, eviction fees, etc. Calculation:Assumes 8% of gross rental income. | 8% | -$448 | -$5,376 |
Repairs & MaintenanceOngoing costs for routine upkeep and minor fixes needed to keep a property in good working condition. Calculation:Assumes 5% of gross rental income. Varies by property age and condition. | 5% | -$280 | -$3,360 |
Capital ExpensesLarge, infrequent costs for major improvements or replacements, like a new roof, HVAC system, or appliances. Calculation:Assumes 5% of gross rental income. Varies by property age. | 5% | -$280 | -$3,360 |
HOA FeesRegular dues paid to a Homeowners Association for community maintenance, amenities, and management. Similar fees include: Condo Association Fees, Co-op Maintenance Fees, etc. Calculation:Assumes 0% gross rental income, unless specified.. | 1% | -$56 | -$672 |
Operating ExpensesRecurring costs required to maintain and manage a rental property, including property taxes, insurance, maintenance, repairs, utilities (if paid by the owner), property management fees, and other day-to-day expenses. Calculation:Insurance + Property Taxes + Property Management + Repairs & Maintenance + Capital Expenditures + HOA Fees | 34% | -$1,907 | -$22,878 |
Cash Flow
| Monthly | Yearly | |
|---|---|---|
Net Operating Income (NOI)The income generated from a property after deducting all operating expenses but before deducting mortgage payments, taxes, and capital expenditures. Calculation:Gross Operating Income - Operating Expenses
Net operating income:
| $3,357 | $40,284 |
Mortgage PaymentThe fixed amount a borrower pays each month to repay a loan. It typically includes principal and interest (P&I) and may also cover property taxes, insurance, HOA fees, and PMI if escrowed. | -$5,674 | -$68,088 |
Cash FlowNet Operating Income (NOI) minus mortgage payments. Calculation:NOI - Mortgage Payments | $2,317 | $27,804 |