Box Elder County Investment Properties for Sale
Browse homes for sale and investment properties in Box Elder County. Refine your search by price, property type, or more.
Best cash flowing properties in Box Elder County

$550,000
4
bds
|
4
ba
|
3,915
sqft
|
built
1999
1035 N Valley View Dr, Tremonton, UT 84337
$-456
Cash flow
-4.3%
Cash-on-Cash Return
5.3%
Cap rate
0.6%
Rent to Value Ratio
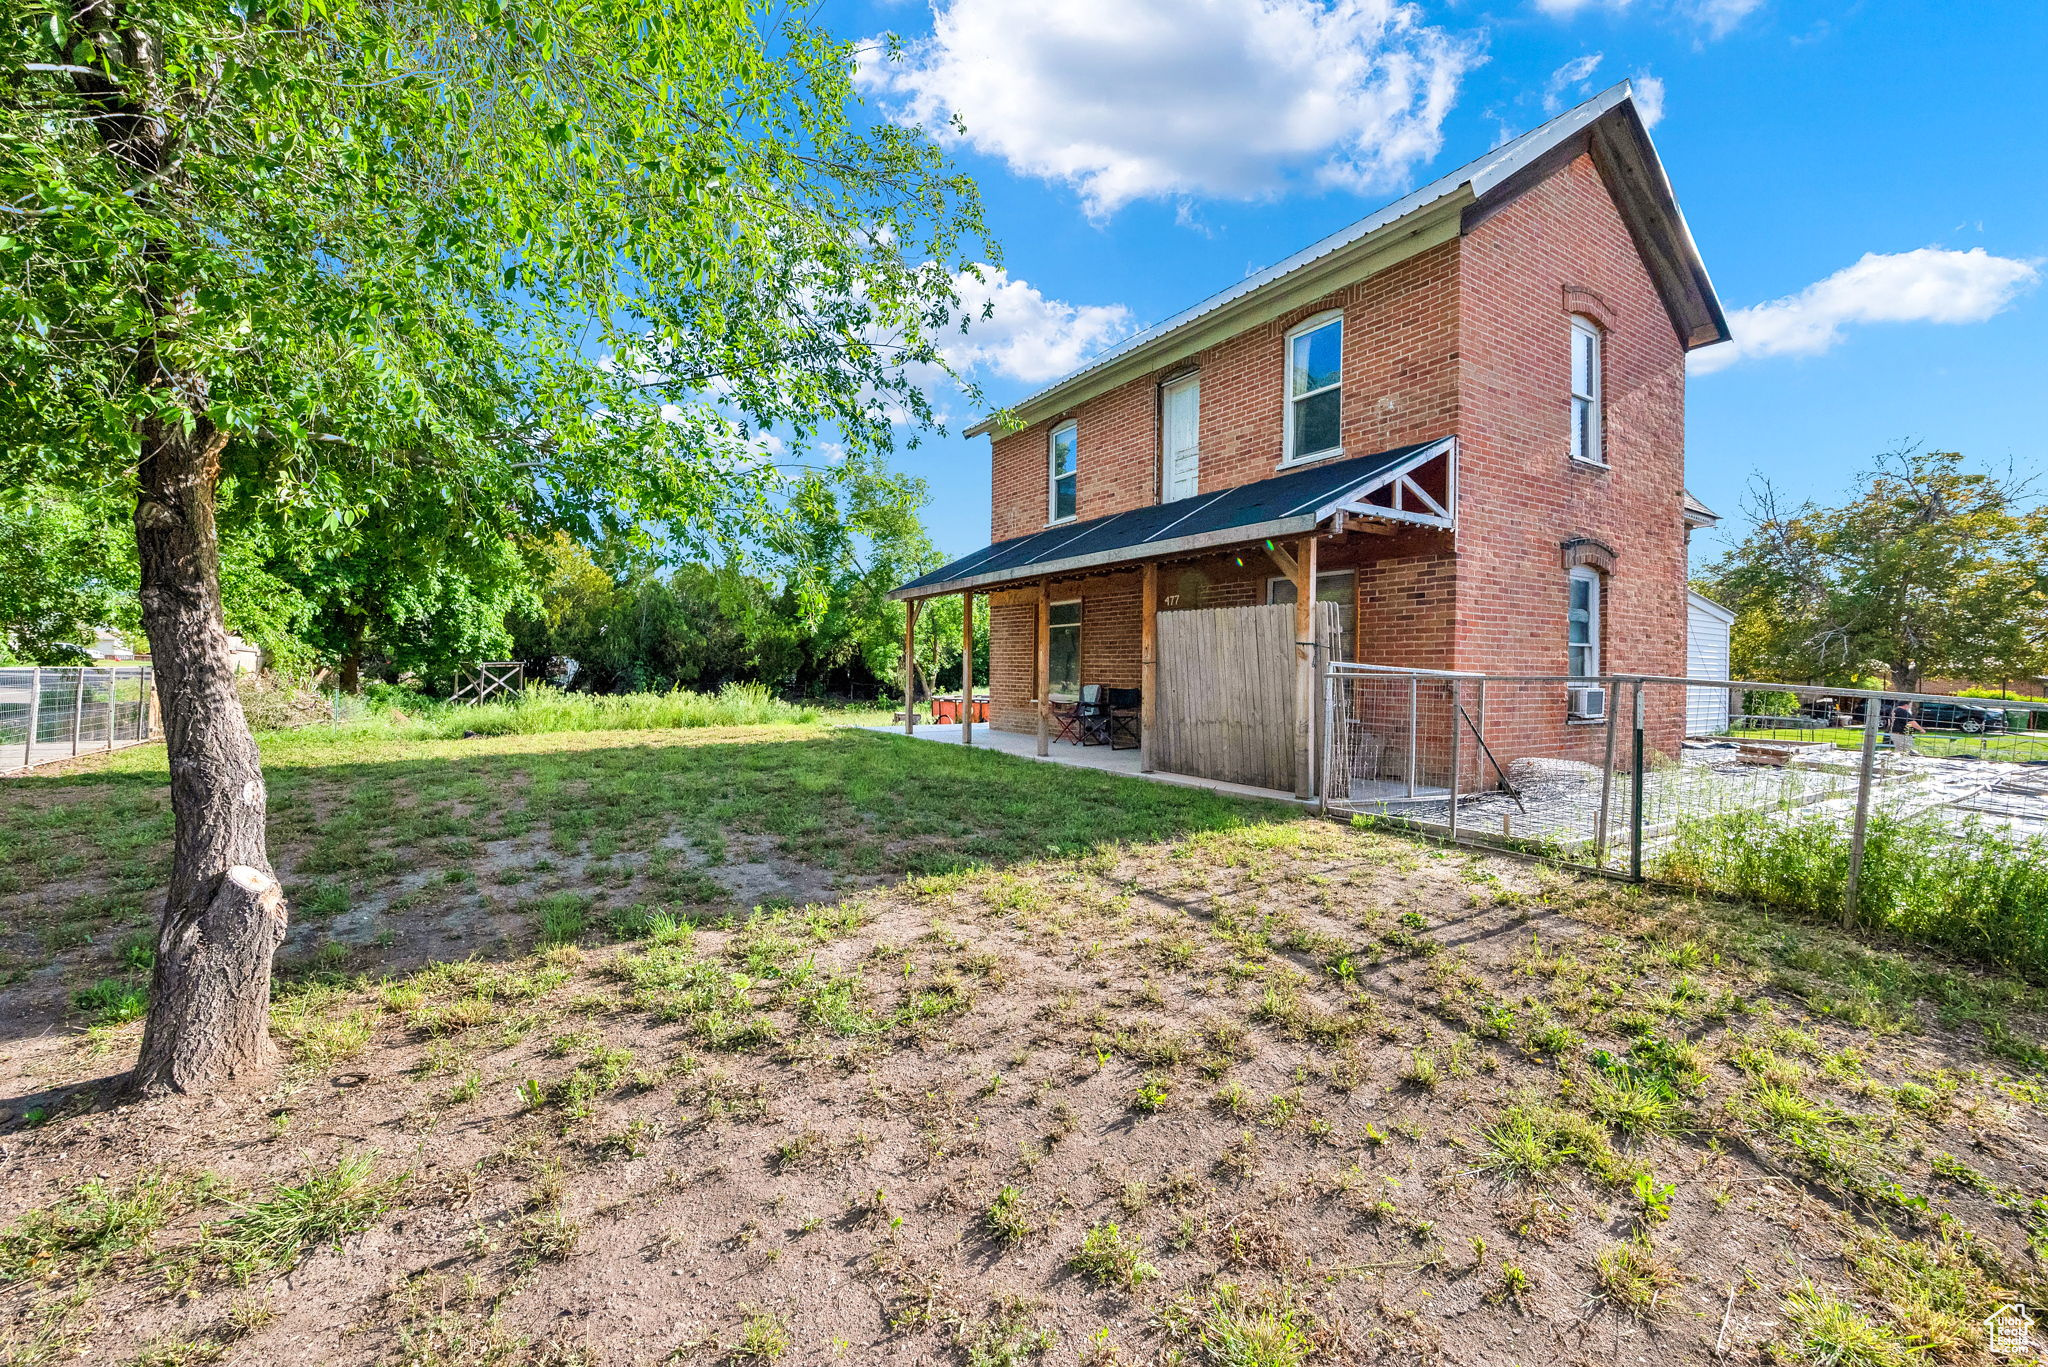
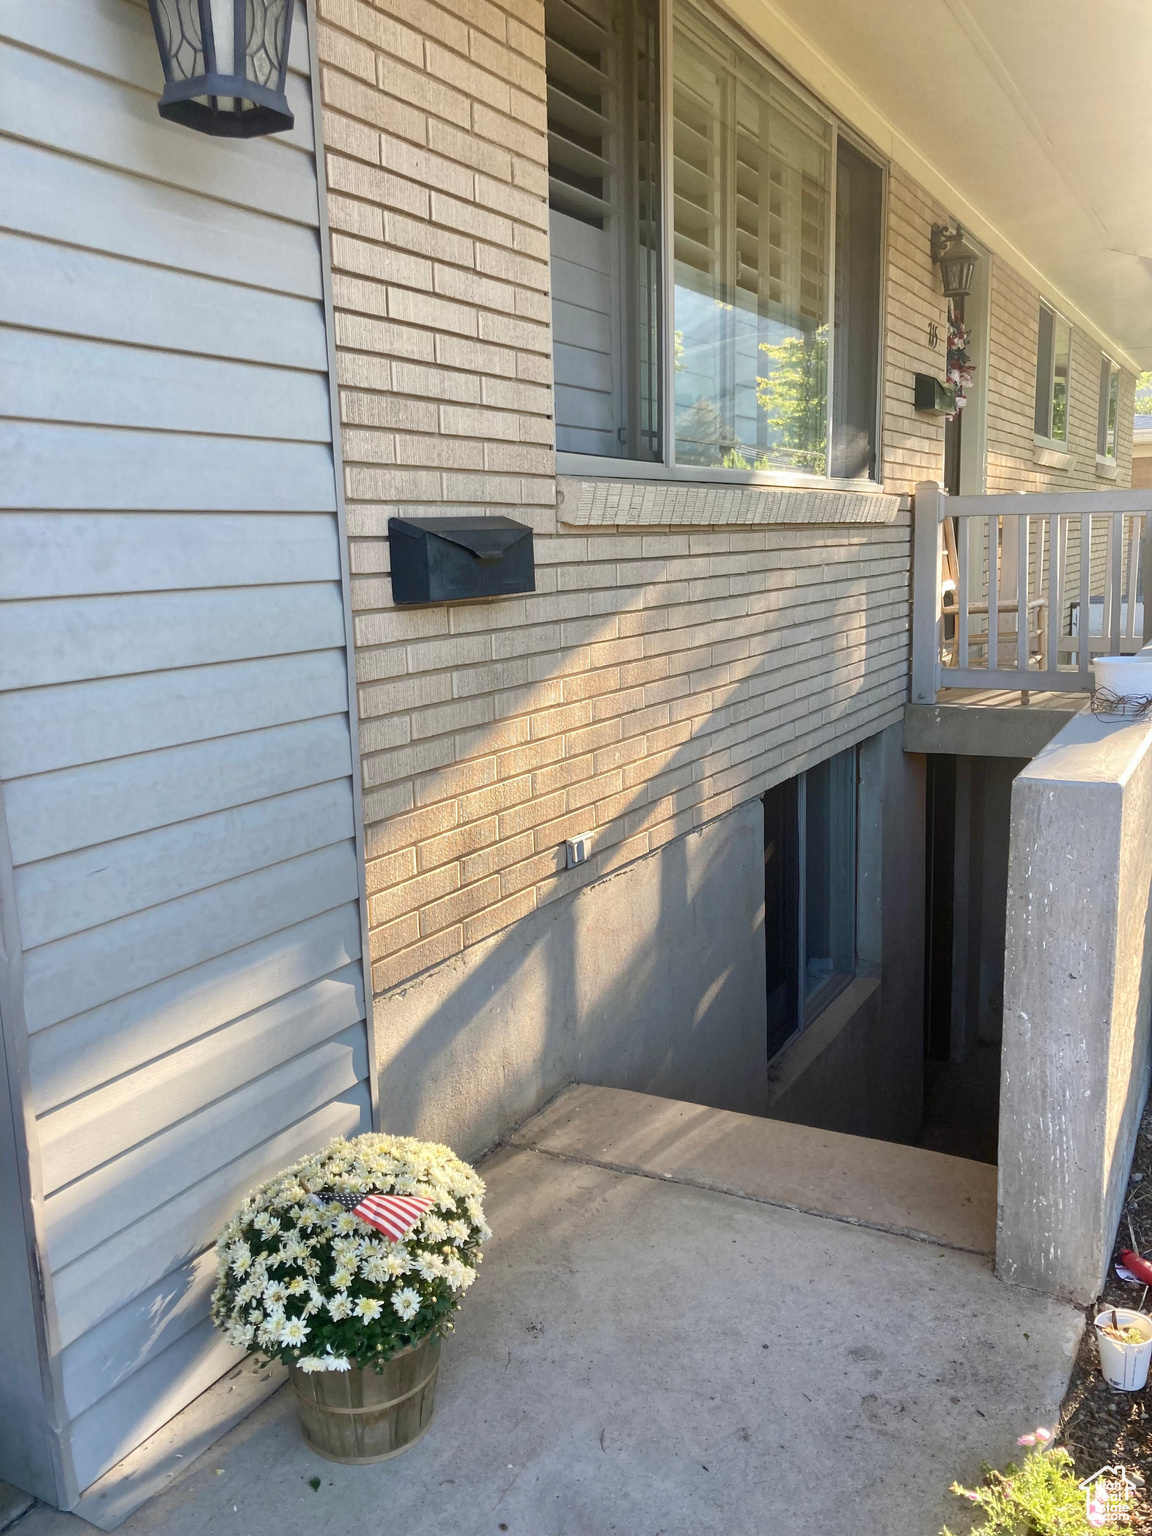
$315,000
3
bds
|
1
ba
|
1,775
sqft
|
built
1918
477 N 300 W, Brigham City, UT 84302
$-476
Cash flow
-7.9%
Cash-on-Cash Return
4.5%
Cap rate
0.6%
Rent to Value Ratio
40 out of 189 properties for sale in Box Elder County
Limited Results Shown
Create a free account, or log in to reveal all property listings and enjoy the complete experience.

$499,900
3
bds
|
2
ba
|
2,442
sqft
|
built
1913
453 N 200 W, Brigham City, UT 84302
$-1,160
Cash flow
-12.1%
Cash-on-Cash Return
3.5%
Cap rate
0.5%
Rent to Value Ratio

$2,190,000
7
bds
|
7
ba
|
7,049
sqft
|
built
2018
1930 W 5900 N, Brigham City, UT 84302
$-9,926
Cash flow
-23.6%
Cash-on-Cash Return
0.8%
Cap rate
0.1%
Rent to Value Ratio
$484,000
5
bds
|
3
ba
|
2,200
sqft
|
built
1961
715 Oak Dr, Brigham City, UT 84302
$-1,299
Cash flow
-14.0%
Cash-on-Cash Return
3.0%
Cap rate
0.4%
Rent to Value Ratio
$599,900
4
bds
|
3
ba
|
2,661
sqft
|
built
1898
4740 N Highway 38, Brigham City, UT 84302
$-1,614
Cash flow
-14.0%
Cash-on-Cash Return
3.0%
Cap rate
0.4%
Rent to Value Ratio

$415,000
5
bds
|
4
ba
|
2,610
sqft
|
built
1959
548 E 500 N, Brigham City, UT 84302
$-759
Cash flow
-9.5%
Cash-on-Cash Return
4.1%
Cap rate
0.6%
Rent to Value Ratio
$389,000
3
bds
|
2
ba
|
1,399
sqft
|
built
2004
1608 W 125 N, Tremonton, UT 84337
$-1,087
Cash flow
-14.6%
Cash-on-Cash Return
2.9%
Cap rate
0.4%
Rent to Value Ratio
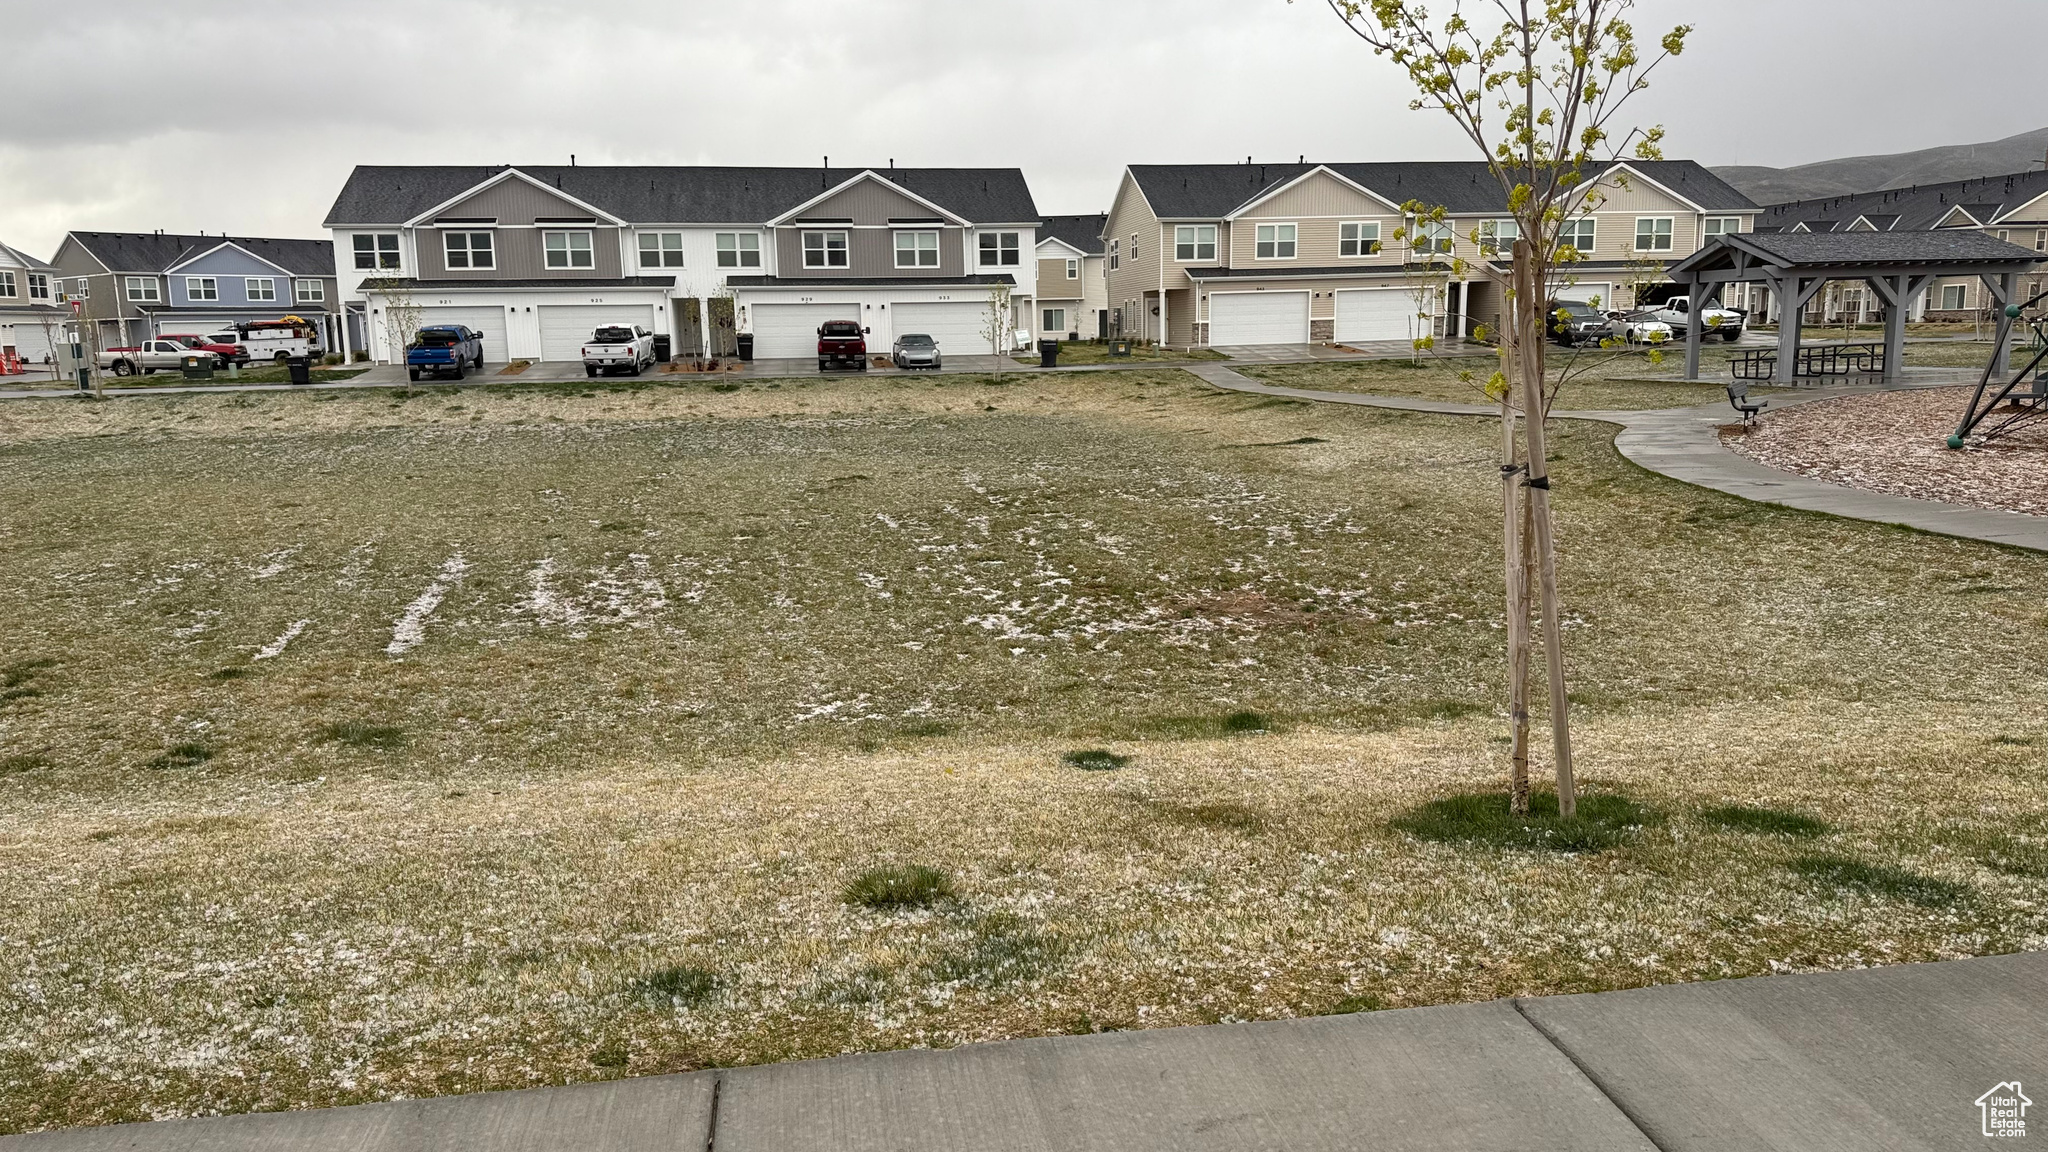
$295,000
3
bds
|
3
ba
|
1,476
sqft
|
built
2023
932 N 935 W, Tremonton, UT 84337
$-553
Cash flow
-9.8%
Cash-on-Cash Return
4.0%
Cap rate
0.6%
Rent to Value Ratio
$359,900
3
bds
|
2
ba
|
1,152
sqft
|
built
1998
736 W 325 N, Brigham City, UT 84302
$-881
Cash flow
-12.8%
Cash-on-Cash Return
3.3%
Cap rate
0.4%
Rent to Value Ratio
$440,000
3
bds
|
2
ba
|
1,262
sqft
|
built
1918
11796 N 4800 W, Tremonton, UT 84337
$-1,305
Cash flow
-15.5%
Cash-on-Cash Return
2.7%
Cap rate
0.4%
Rent to Value Ratio

$475,000
4
bds
|
2
ba
|
3,693
sqft
|
built
1961
65 N 700 E, Brigham City, UT 84302
$-1,359
Cash flow
-14.9%
Cash-on-Cash Return
2.8%
Cap rate
0.4%
Rent to Value Ratio

$399,900
5
bds
|
2
ba
|
2,444
sqft
|
built
1962
141 W 500 S, Tremonton, UT 84337
$-908
Cash flow
-11.8%
Cash-on-Cash Return
3.5%
Cap rate
0.5%
Rent to Value Ratio
$349,900
3
bds
|
2
ba
|
1,324
sqft
|
built
1999
319 N 800 W, Brigham City, UT 84302
$-843
Cash flow
-12.6%
Cash-on-Cash Return
3.4%
Cap rate
0.5%
Rent to Value Ratio

$355,000
3
bds
|
2
ba
|
1,358
sqft
|
built
1978
564 N 200 E, Tremonton, UT 84337
$-967
Cash flow
-14.2%
Cash-on-Cash Return
3.0%
Cap rate
0.4%
Rent to Value Ratio
$469,000
5
bds
|
3
ba
|
2,372
sqft
|
built
2010
458 W 275 S, Tremonton, UT 84337
$-1,394
Cash flow
-15.5%
Cash-on-Cash Return
2.7%
Cap rate
0.4%
Rent to Value Ratio
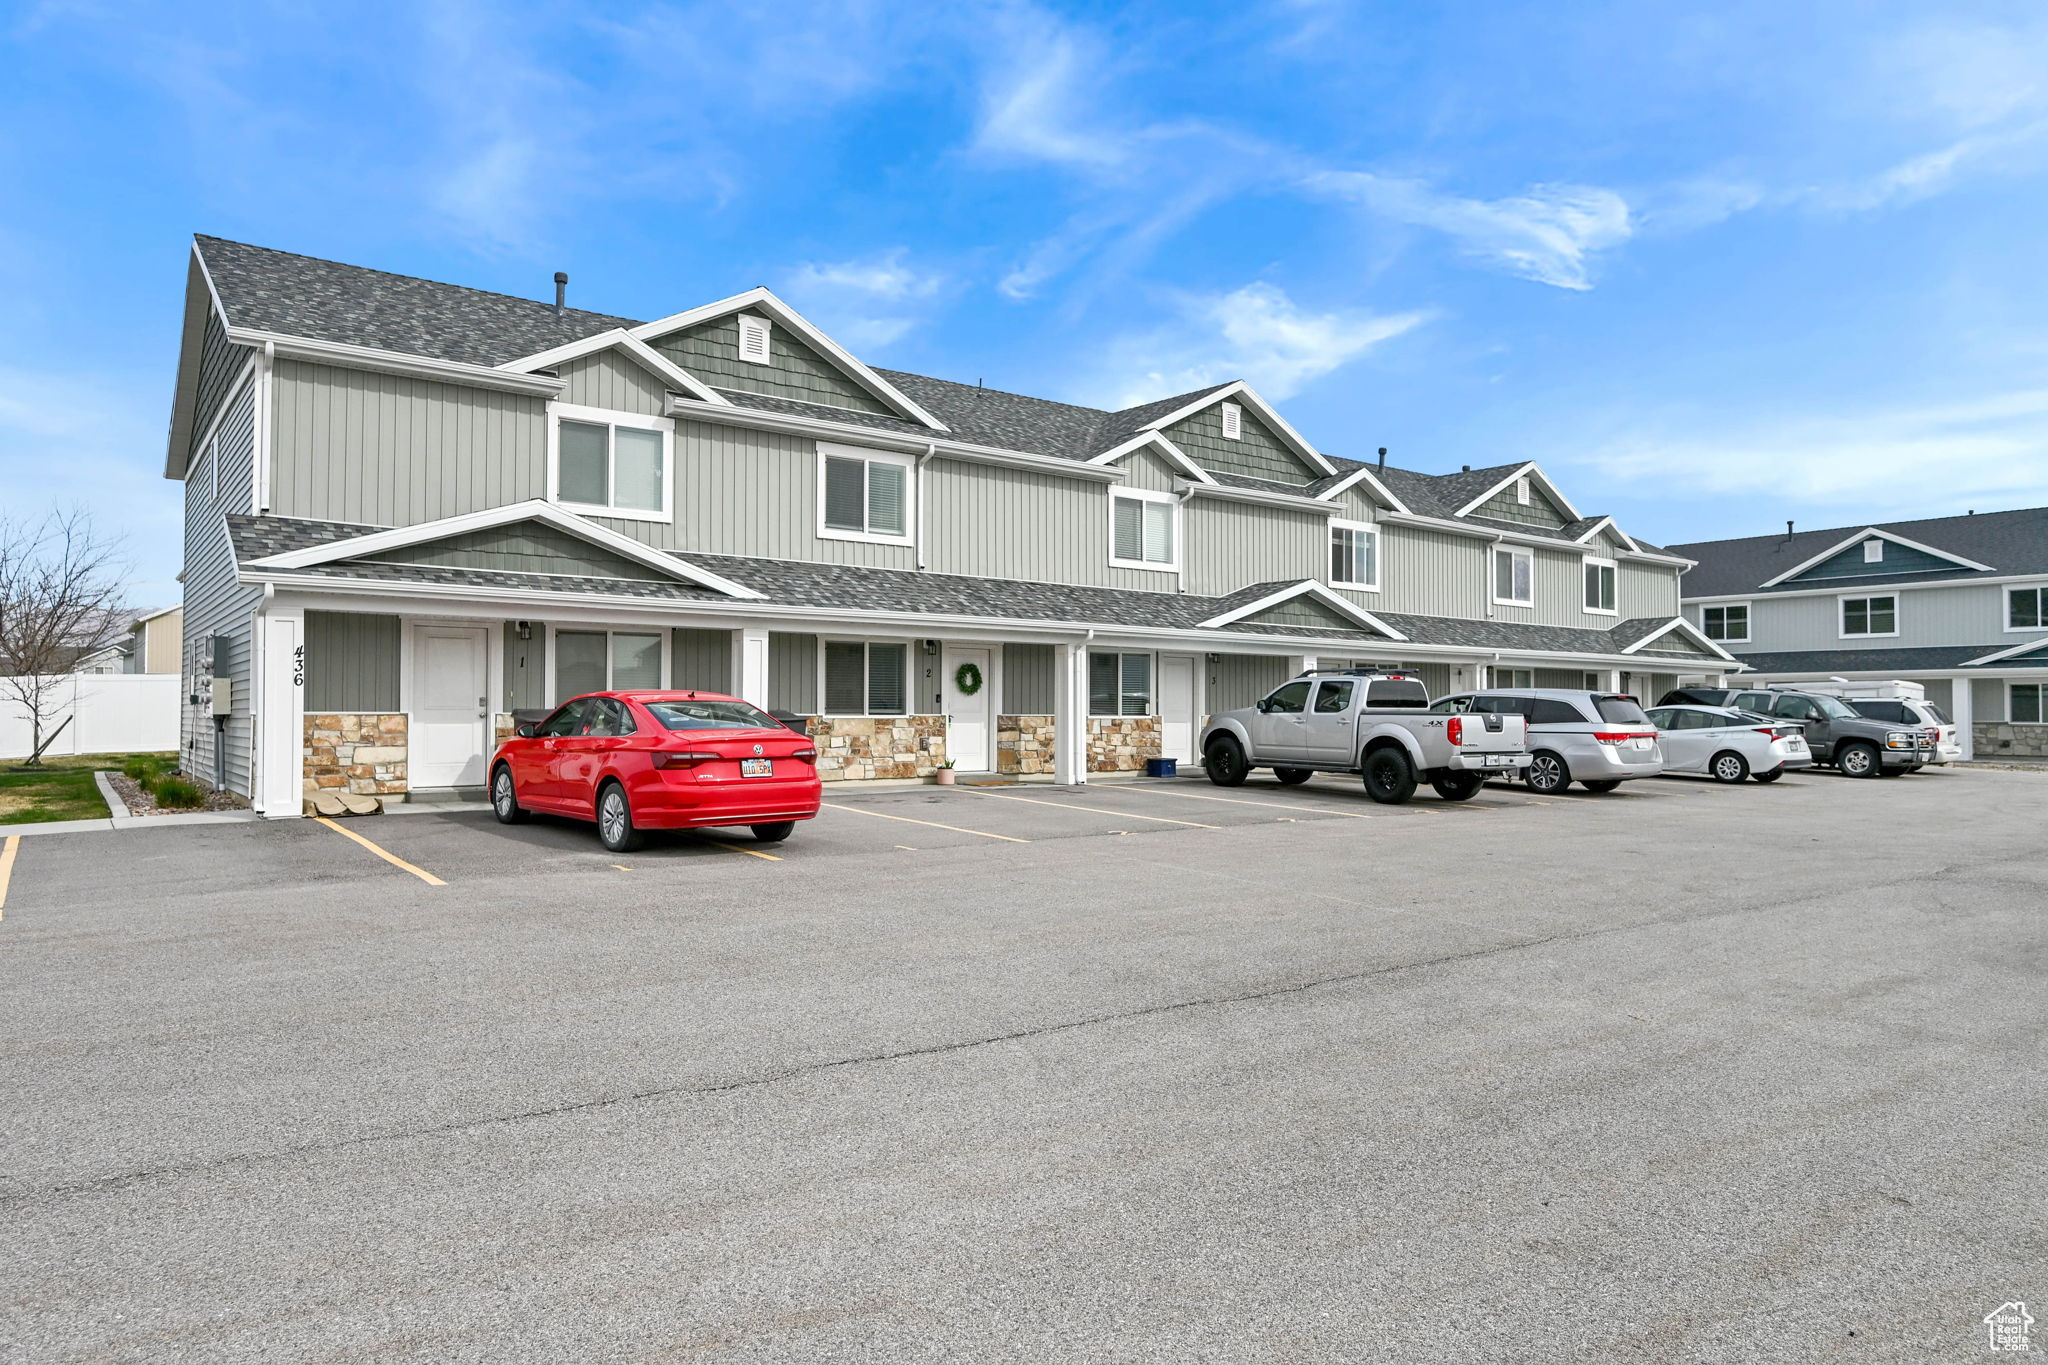
$260,000
3
bds
|
2
ba
|
1,255
sqft
|
built
2020
436 N 2650 W, Tremonton, UT 84337
$-646
Cash flow
-13.0%
Cash-on-Cash Return
3.3%
Cap rate
0.5%
Rent to Value Ratio
$550,000
4
bds
|
4
ba
|
3,915
sqft
|
built
1999
1035 N Valley View Dr, Tremonton, UT 84337
$-456
Cash flow
-4.3%
Cash-on-Cash Return
5.3%
Cap rate
0.6%
Rent to Value Ratio
$549,900
5
bds
|
4
ba
|
2,562
sqft
|
built
1997
929 Medical Dr, Brigham City, UT 84302
$-1,946
Cash flow
-18.5%
Cash-on-Cash Return
2.0%
Cap rate
0.3%
Rent to Value Ratio
$515,000
6
bds
|
3
ba
|
3,869
sqft
|
built
1975
485 N 400 W, Tremonton, UT 84337
$-984
Cash flow
-10.0%
Cash-on-Cash Return
4.0%
Cap rate
0.5%
Rent to Value Ratio
$299,900
3
bds
|
3
ba
|
1,570
sqft
|
built
2023
250 W 1200 S, Tremonton, UT 84337
$-947
Cash flow
-16.5%
Cash-on-Cash Return
2.5%
Cap rate
0.4%
Rent to Value Ratio
$455,000
3
bds
|
2
ba
|
2,658
sqft
|
built
2017
1086 S 150 W, Tremonton, UT 84337
$-1,188
Cash flow
-13.6%
Cash-on-Cash Return
3.1%
Cap rate
0.4%
Rent to Value Ratio
$339,900
3
bds
|
1
ba
|
1,872
sqft
|
built
1993
530 W 800 S, Tremonton, UT 84337
$-970
Cash flow
-14.9%
Cash-on-Cash Return
2.8%
Cap rate
0.4%
Rent to Value Ratio
$299,900
3
bds
|
3
ba
|
1,476
sqft
|
built
2021
917 W 1000 N, Tremonton, UT 84337
$-586
Cash flow
-10.2%
Cash-on-Cash Return
3.9%
Cap rate
0.6%
Rent to Value Ratio
$315,000
3
bds
|
1
ba
|
1,775
sqft
|
built
1918
477 N 300 W, Brigham City, UT 84302
$-476
Cash flow
-7.9%
Cash-on-Cash Return
4.5%
Cap rate
0.6%
Rent to Value Ratio

$629,900
5
bds
|
3
ba
|
3,628
sqft
|
built
2020
1190 N 2650 W, Tremonton, UT 84337
$-1,657
Cash flow
-13.7%
Cash-on-Cash Return
3.1%
Cap rate
0.4%
Rent to Value Ratio

$339,000
3
bds
|
1
ba
|
1,708
sqft
|
built
1952
613 N 200 E, Tremonton, UT 84337
$-748
Cash flow
-11.5%
Cash-on-Cash Return
3.6%
Cap rate
0.5%
Rent to Value Ratio

$515,000
3
bds
|
2
ba
|
3,100
sqft
|
built
2012
2749 W Valley View Dr, Tremonton, UT 84337
$-1,431
Cash flow
-14.5%
Cash-on-Cash Return
2.9%
Cap rate
0.4%
Rent to Value Ratio
$659,900
5
bds
|
3
ba
|
2,883
sqft
|
built
2025
64 N Bywater Way, Brigham City, UT 84302
$-1,927
Cash flow
-15.2%
Cash-on-Cash Return
2.8%
Cap rate
0.3%
Rent to Value Ratio
$515,000
5
bds
|
3
ba
|
2,658
sqft
|
built
1960
126 E 700 N, Brigham City, UT 84302
$-1,415
Cash flow
-14.3%
Cash-on-Cash Return
3.0%
Cap rate
0.4%
Rent to Value Ratio

$325,000
3
bds
|
2
ba
|
1,295
sqft
|
built
1947
219 N 300 W, Tremonton, UT 84337
$-592
Cash flow
-9.5%
Cash-on-Cash Return
4.1%
Cap rate
0.6%
Rent to Value Ratio
$429,900
5
bds
|
2
ba
|
2,222
sqft
|
built
1993
224 W 400 N, Brigham City, UT 84302
$-1,020
Cash flow
-12.4%
Cash-on-Cash Return
3.4%
Cap rate
0.5%
Rent to Value Ratio
$342,300
3
bds
|
3
ba
|
1,523
sqft
|
built
2021
1059 W 600 S, Brigham City, UT 84302
$-927
Cash flow
-14.1%
Cash-on-Cash Return
3.0%
Cap rate
0.5%
Rent to Value Ratio
$439,000
5
bds
|
3
ba
|
2,592
sqft
|
built
1976
613 N 100 E, Brigham City, UT 84302
$-891
Cash flow
-10.6%
Cash-on-Cash Return
3.8%
Cap rate
0.5%
Rent to Value Ratio
$384,900
3
bds
|
2
ba
|
1,900
sqft
|
built
1959
789 N 100 W, Tremonton, UT 84337
$-1,099
Cash flow
-14.9%
Cash-on-Cash Return
2.8%
Cap rate
0.4%
Rent to Value Ratio
$485,000
6
bds
|
3
ba
|
2,558
sqft
|
built
2006
162 S 500 W, Tremonton, UT 84337
$-1,014
Cash flow
-10.9%
Cash-on-Cash Return
3.8%
Cap rate
0.5%
Rent to Value Ratio

$244,900
2
bds
|
2
ba
|
955
sqft
|
built
2019
483 N 2650 W, Tremonton, UT 84337
$-517
Cash flow
-11.0%
Cash-on-Cash Return
3.7%
Cap rate
0.6%
Rent to Value Ratio

$339,900
3
bds
|
2
ba
|
2,006
sqft
|
built
1940
352 S 100 W, Tremonton, UT 84337
$-830
Cash flow
-12.7%
Cash-on-Cash Return
3.3%
Cap rate
0.5%
Rent to Value Ratio

$449,900
5
bds
|
3
ba
|
2,938
sqft
|
built
1960
736 N 100 W, Tremonton, UT 84337
$-1,045
Cash flow
-12.1%
Cash-on-Cash Return
3.5%
Cap rate
0.5%
Rent to Value Ratio

$600,000
3
bds
|
2
ba
|
3,496
sqft
|
built
2020
1081 N 2800 W, Tremonton, UT 84337
$-1,493
Cash flow
-13.0%
Cash-on-Cash Return
3.3%
Cap rate
0.5%
Rent to Value Ratio
$464,000
3
bds
|
3
ba
|
1,526
sqft
|
built
2023
706 E 500 N, Brigham City, UT 84302
$-1,408
Cash flow
-15.8%
Cash-on-Cash Return
2.6%
Cap rate
0.4%
Rent to Value Ratio
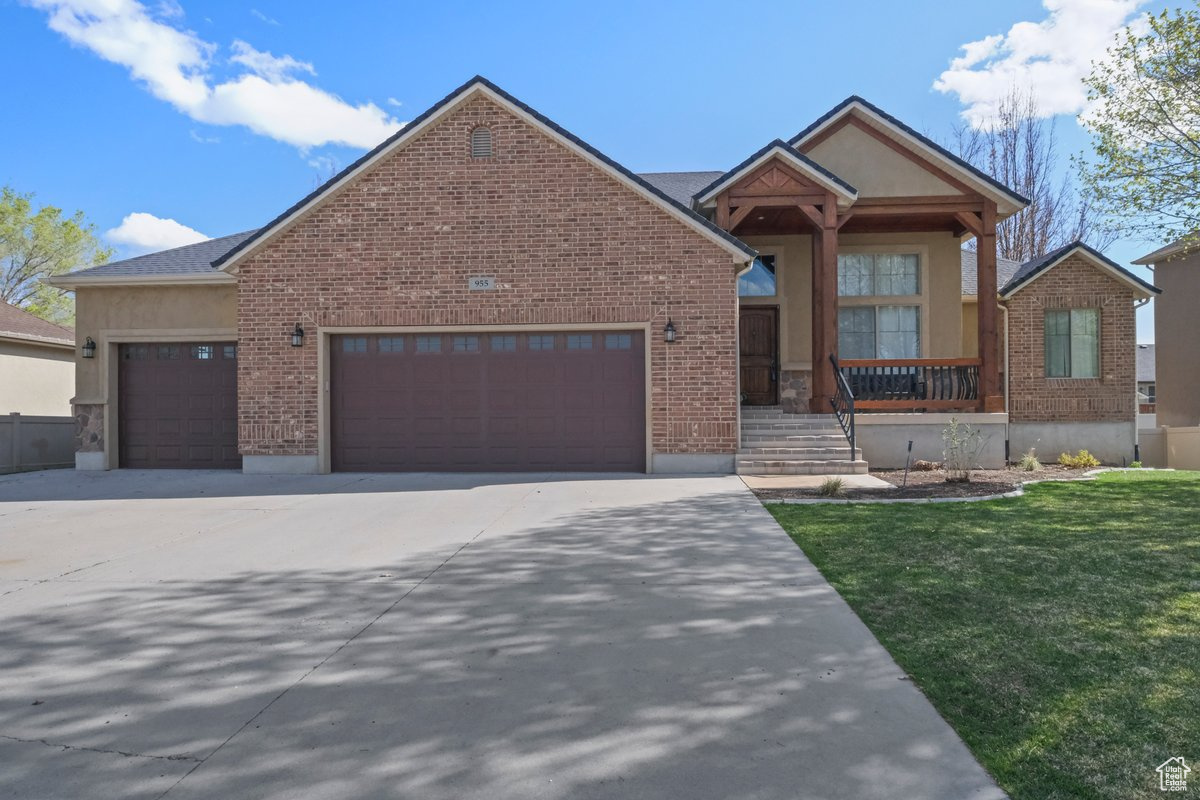
$665,000
6
bds
|
4
ba
|
3,834
sqft
|
built
2005
955 W 720 N, Tremonton, UT 84337
$-1,988
Cash flow
-15.6%
Cash-on-Cash Return
2.7%
Cap rate
0.4%
Rent to Value Ratio