Raleigh, NC Investment Properties for Sale
Browse homes for sale and investment properties in Raleigh, NC. Refine your search by price, property type, or more.
Best cash flowing properties in Raleigh, NC
Active
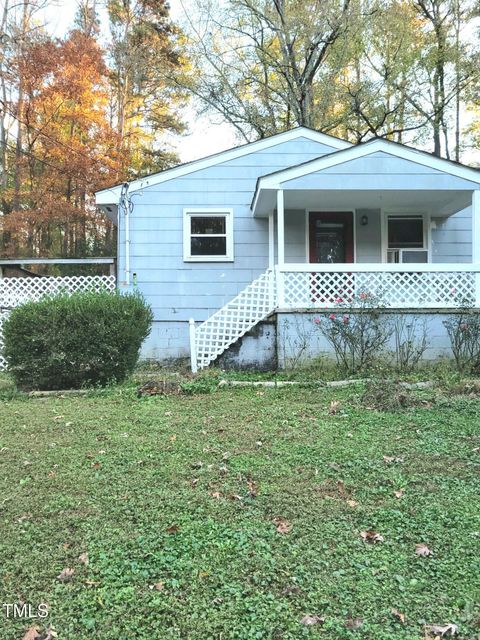
$219,900
2
bds
|
1
ba
|
918
sqft
|
built
1959
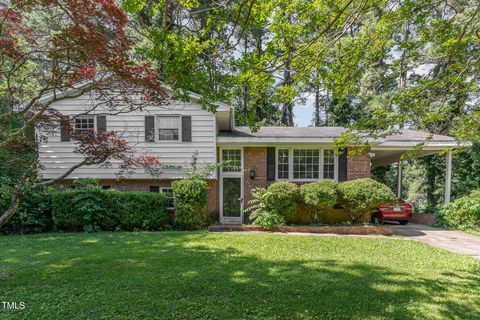
327 Ranch Farm Rd, Raleigh, NC 27603
$-171
Cash flow
-4.1%
Cash-on-Cash Return
4.7%
Cap rate
0.6%
Rent to Value Ratio

Active
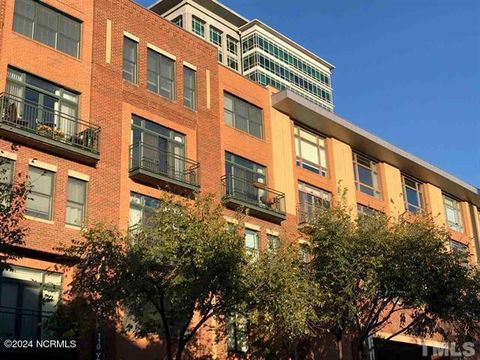
$200,000
1
bds
|
2
ba
|
1,038
sqft
|
built
2002
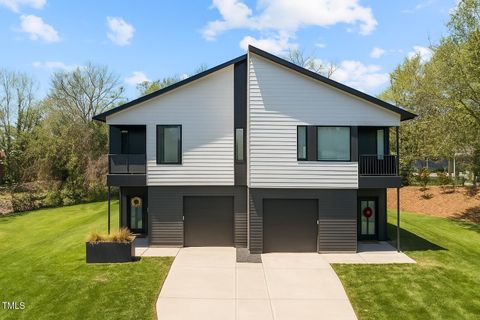
2500 Huntscroft Ln, Raleigh, NC 27617
$-212
Cash flow
-5.5%
Cash-on-Cash Return
4.4%
Cap rate
0.8%
Rent to Value Ratio
87 out of 1,286 properties for sale in Raleigh, NC
Limited Results Shown
Create a free account, or log in to reveal all property listings and enjoy the complete experience.

Active
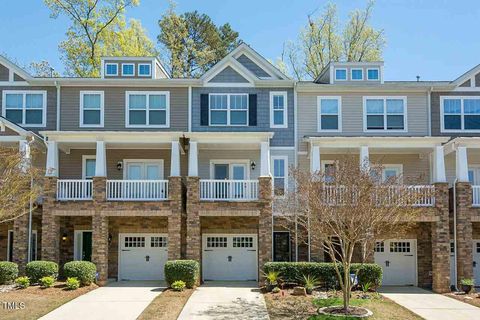
$978,000
5
bds
|
4
ba
|
4,644
sqft
|
built
2002
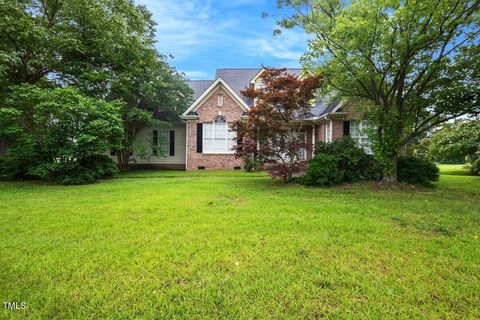
9220 Meadow Mist Ct, Raleigh, NC 27617
$-2,514
Cash flow
-13.4%
Cash-on-Cash Return
2.6%
Cap rate
0.4%
Rent to Value Ratio

Active
$774,900
4
bds
|
4
ba
|
3,148
sqft
|
built
2012
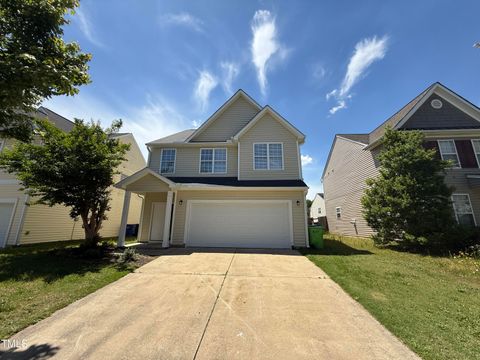
3612 Griffice Mill Rd, Raleigh, NC 27610
$-2,374
Cash flow
-16.0%
Cash-on-Cash Return
2.0%
Cap rate
0.3%
Rent to Value Ratio

Active
$342,500
3
bds
|
4
ba
|
1,857
sqft
|
built
2023
5432 Crescent Square St, Raleigh, NC 27616
$-465
Cash flow
-7.1%
Cash-on-Cash Return
4.1%
Cap rate
0.6%
Rent to Value Ratio

Active
$425,000
3
bds
|
3
ba
|
1,859
sqft
|
built
2012
2459 Memory Ridge Dr, Raleigh, NC 27606
$-1,097
Cash flow
-13.5%
Cash-on-Cash Return
2.6%
Cap rate
0.5%
Rent to Value Ratio

Active
$749,900
3
bds
|
3
ba
|
2,070
sqft
|
built
1961
1205 Glen Eden Dr, Raleigh, NC 27612
$-1,831
Cash flow
-12.7%
Cash-on-Cash Return
2.7%
Cap rate
0.4%
Rent to Value Ratio
Active
$465,000
2
bds
|
3
ba
|
1,457
sqft
|
built
2006
444 S Blount St, Raleigh, NC 27601
$-1,613
Cash flow
-18.1%
Cash-on-Cash Return
1.5%
Cap rate
0.4%
Rent to Value Ratio
Active
$360,000
3
bds
|
2
ba
|
1,318
sqft
|
built
1986
468 Dickens Dr, Raleigh, NC 27610
$-688
Cash flow
-10.0%
Cash-on-Cash Return
3.4%
Cap rate
0.5%
Rent to Value Ratio

Active
$365,000
4
bds
|
2
ba
|
1,590
sqft
|
built
1969
323 Ranch Farm Rd, Raleigh, NC 27603
$-669
Cash flow
-9.6%
Cash-on-Cash Return
3.5%
Cap rate
0.5%
Rent to Value Ratio

Active
$245,000
3
bds
|
3
ba
|
1,336
sqft
|
built
2006
4000 Volkswalk Pl, Raleigh, NC 27610
$-342
Cash flow
-7.3%
Cash-on-Cash Return
4.0%
Cap rate
0.7%
Rent to Value Ratio

Active
$600,000
4
bds
|
3
ba
|
2,926
sqft
|
built
2001
2617 Charenson Pl, Raleigh, NC 27614
$-1,331
Cash flow
-11.6%
Cash-on-Cash Return
3.0%
Cap rate
0.5%
Rent to Value Ratio
Active
$358,900
3
bds
|
4
ba
|
1,571
sqft
|
built
2009
8016 Sycamore Hill Ln, Raleigh, NC 27612
$-875
Cash flow
-12.7%
Cash-on-Cash Return
2.8%
Cap rate
0.5%
Rent to Value Ratio

Active
$795,000
2
bds
|
1
ba
|
1,340
sqft
|
built
1920
521 E Edenton St, Raleigh, NC 27601
$-2,842
Cash flow
-18.7%
Cash-on-Cash Return
1.4%
Cap rate
0.3%
Rent to Value Ratio

Active
$625,000
5
bds
|
3
ba
|
3,152
sqft
|
built
1994
6008 Chittim Ct, Raleigh, NC 27616
$-1,504
Cash flow
-12.6%
Cash-on-Cash Return
2.8%
Cap rate
0.4%
Rent to Value Ratio

Active
$329,990
3
bds
|
2
ba
|
1,120
sqft
|
built
1989
4401 Liverpool Ln, Raleigh, NC 27604
$-570
Cash flow
-9.0%
Cash-on-Cash Return
3.6%
Cap rate
0.5%
Rent to Value Ratio

Active
$379,999
3
bds
|
3
ba
|
1,754
sqft
|
built
2008
9221 Calabria Dr, Raleigh, NC 27617
$-1,036
Cash flow
-14.2%
Cash-on-Cash Return
2.4%
Cap rate
0.6%
Rent to Value Ratio

Active
$454,000
3
bds
|
3
ba
|
2,477
sqft
|
built
1991
6245 Hampton Ridge Rd, Raleigh, NC 27603
$-785
Cash flow
-9.0%
Cash-on-Cash Return
3.6%
Cap rate
0.5%
Rent to Value Ratio

Active
$665,000
3
bds
|
2
ba
|
2,332
sqft
|
built
1973
6925 Valley Lake Dr, Raleigh, NC 27612
$-1,603
Cash flow
-12.6%
Cash-on-Cash Return
2.8%
Cap rate
0.4%
Rent to Value Ratio
Active
$424,900
3
bds
|
3
ba
|
2,360
sqft
|
built
1948
1410 Cross Link Rd, Raleigh, NC 27610
$-839
Cash flow
-10.3%
Cash-on-Cash Return
3.3%
Cap rate
0.5%
Rent to Value Ratio

Active
$465,000
1
bds
|
1
ba
|
906
sqft
|
built
2020
523 S West St, Raleigh, NC 27601
$-1,444
Cash flow
-16.2%
Cash-on-Cash Return
2.0%
Cap rate
0.5%
Rent to Value Ratio

Active
$490,000
4
bds
|
3
ba
|
2,873
sqft
|
built
2002
6101 Clarks Fork Dr, Raleigh, NC 27616
$-982
Cash flow
-10.5%
Cash-on-Cash Return
3.3%
Cap rate
0.5%
Rent to Value Ratio
Active
$364,000
2
bds
|
2
ba
|
1,614
sqft
|
built
2007
4712 Fox Fern Ln, Raleigh, NC 27604
$-1,034
Cash flow
-14.8%
Cash-on-Cash Return
2.3%
Cap rate
0.5%
Rent to Value Ratio

Active
$469,000
4
bds
|
4
ba
|
2,258
sqft
|
built
2006
5003 Celtic Ct, Raleigh, NC 27612
$-995
Cash flow
-11.1%
Cash-on-Cash Return
3.1%
Cap rate
0.5%
Rent to Value Ratio
Active
$240,000
3
bds
|
3
ba
|
1,319
sqft
|
built
1978
4600 Millstone Dr, Raleigh, NC 27604
$-363
Cash flow
-7.9%
Cash-on-Cash Return
3.9%
Cap rate
0.7%
Rent to Value Ratio
Active
$1,499,000
4
bds
|
5
ba
|
5,718
sqft
|
built
2005
1300 Caistor Ln, Raleigh, NC 27614
$-3,949
Cash flow
-13.7%
Cash-on-Cash Return
2.5%
Cap rate
0.4%
Rent to Value Ratio

Active
$514,000
4
bds
|
3
ba
|
3,022
sqft
|
built
2018
2005 Ernesto Ln, Raleigh, NC 27603
$-1,270
Cash flow
-12.9%
Cash-on-Cash Return
2.7%
Cap rate
0.4%
Rent to Value Ratio

Active
$750,000
3
bds
|
3
ba
|
2,466
sqft
|
built
2002
9413 Lake Villa Way, Raleigh, NC 27614
$-2,641
Cash flow
-18.4%
Cash-on-Cash Return
1.5%
Cap rate
0.3%
Rent to Value Ratio

Active
$395,000
3
bds
|
2
ba
|
1,145
sqft
|
built
1990
413 Top Greene Ln, Raleigh, NC 27601
$-754
Cash flow
-10.0%
Cash-on-Cash Return
3.4%
Cap rate
0.5%
Rent to Value Ratio
Active
$325,000
3
bds
|
3
ba
|
1,927
sqft
|
built
1964
612 Locust Ln, Raleigh, NC 27603
$-324
Cash flow
-5.2%
Cash-on-Cash Return
4.5%
Cap rate
0.6%
Rent to Value Ratio
Active
$515,000
3
bds
|
3
ba
|
1,723
sqft
|
built
2021
2201 Millbank Village Ct, Raleigh, NC 27610
$-1,038
Cash flow
-10.5%
Cash-on-Cash Return
3.3%
Cap rate
0.5%
Rent to Value Ratio
Active
$460,000
3
bds
|
2
ba
|
2,535
sqft
|
built
2001
1016 Pasture View Ln, Raleigh, NC 27603
$-802
Cash flow
-9.1%
Cash-on-Cash Return
3.6%
Cap rate
0.5%
Rent to Value Ratio
Active
$395,000
4
bds
|
3
ba
|
1,920
sqft
|
built
2006
1618 Brownairs Ln, Raleigh, NC 27610
$-748
Cash flow
-9.9%
Cash-on-Cash Return
3.4%
Cap rate
0.5%
Rent to Value Ratio

Active
$349,900
2
bds
|
3
ba
|
1,042
sqft
|
built
1988
1442 Barton Place Dr, Raleigh, NC 27608
$-764
Cash flow
-11.4%
Cash-on-Cash Return
3.1%
Cap rate
0.6%
Rent to Value Ratio

Active
$2,000,000
5
bds
|
8
ba
|
6,897
sqft
|
built
2004
5768 Cavanaugh Dr, Raleigh, NC 27614
$-5,825
Cash flow
-15.2%
Cash-on-Cash Return
2.2%
Cap rate
0.3%
Rent to Value Ratio

Active
$320,000
2
bds
|
3
ba
|
1,350
sqft
|
built
2005
5229 Moonview Ct, Raleigh, NC 27606
$-392
Cash flow
-6.4%
Cash-on-Cash Return
4.2%
Cap rate
0.6%
Rent to Value Ratio
Active
$310,000
2
bds
|
3
ba
|
1,278
sqft
|
built
1985
7708 Falcon Rest Cir, Raleigh, NC 27615
$-573
Cash flow
-9.6%
Cash-on-Cash Return
3.5%
Cap rate
0.6%
Rent to Value Ratio

Active
$289,900
2
bds
|
2
ba
|
1,326
sqft
|
built
1999
1911 Falls Landing Dr, Raleigh, NC 27614
$-396
Cash flow
-7.1%
Cash-on-Cash Return
4.0%
Cap rate
0.6%
Rent to Value Ratio
Active
$574,900
4
bds
|
3
ba
|
2,700
sqft
|
built
2001
4211 Norman Ridge Ln, Raleigh, NC 27613
$-1,490
Cash flow
-13.5%
Cash-on-Cash Return
2.6%
Cap rate
0.5%
Rent to Value Ratio

Active
$500,000
3
bds
|
2
ba
|
1,807
sqft
|
built
1965
6813 W Lake Anne Dr, Raleigh, NC 27612
$-1,018
Cash flow
-10.6%
Cash-on-Cash Return
3.2%
Cap rate
0.5%
Rent to Value Ratio