Plymouth, MN Investment Properties for Sale
Browse homes for sale and investment properties in Plymouth, MN. Refine your search by price, property type, or more.
Best cash flowing properties in Plymouth, MN

$249,900
2
bds
|
2
ba
|
1,120
sqft
|
built
1983
1610 Merrimac Ln N, Plymouth, MN 55447
$-185
Cash flow
-3.9%
Cash-on-Cash Return
5.4%
Cap rate
0.9%
Rent to Value Ratio
$249,900
2
bds
|
2
ba
|
1,120
sqft
|
built
1983
1620 Merrimac Ln N, Plymouth, MN 55447
$-207
Cash flow
-4.3%
Cash-on-Cash Return
5.3%
Cap rate
0.9%
Rent to Value Ratio
30 out of 124 properties for sale in Plymouth, MN
Limited Results Shown
Create a free account, or log in to reveal all property listings and enjoy the complete experience.
$185,000
2
bds
|
1
ba
|
1,050
sqft
|
built
1990
14205 44th Pl N, Plymouth, MN 55446
$-392
Cash flow
-11.1%
Cash-on-Cash Return
3.7%
Cap rate
0.9%
Rent to Value Ratio

$125,000
1
bds
|
1
ba
|
710
sqft
|
built
1970
10720 Rockford Rd, Plymouth, MN 55442
$-322
Cash flow
-13.4%
Cash-on-Cash Return
3.2%
Cap rate
1.1%
Rent to Value Ratio
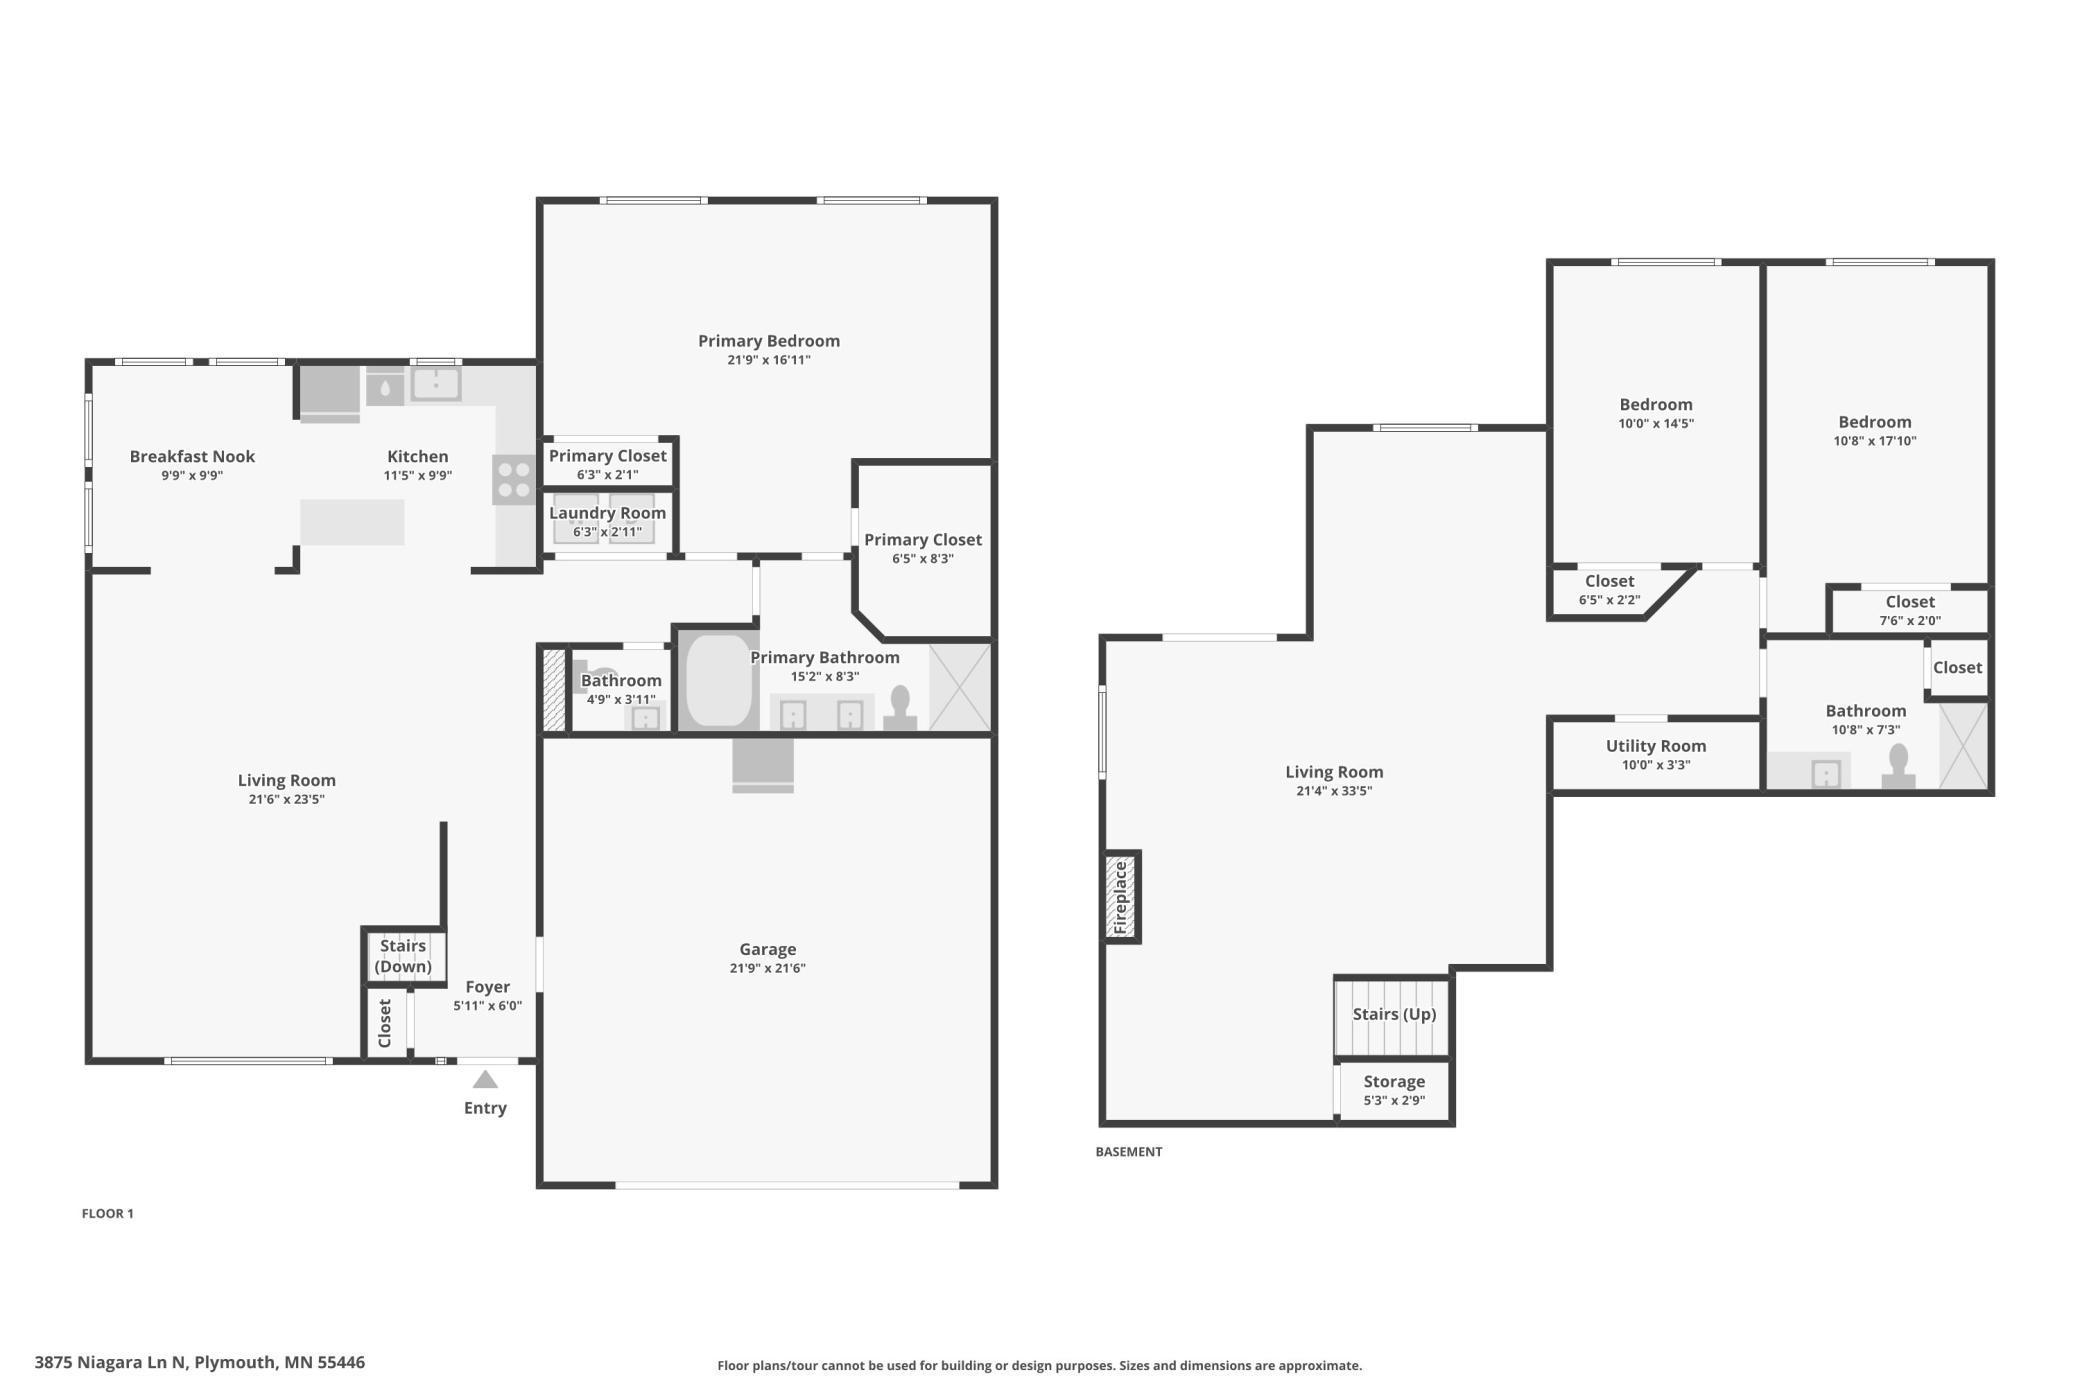
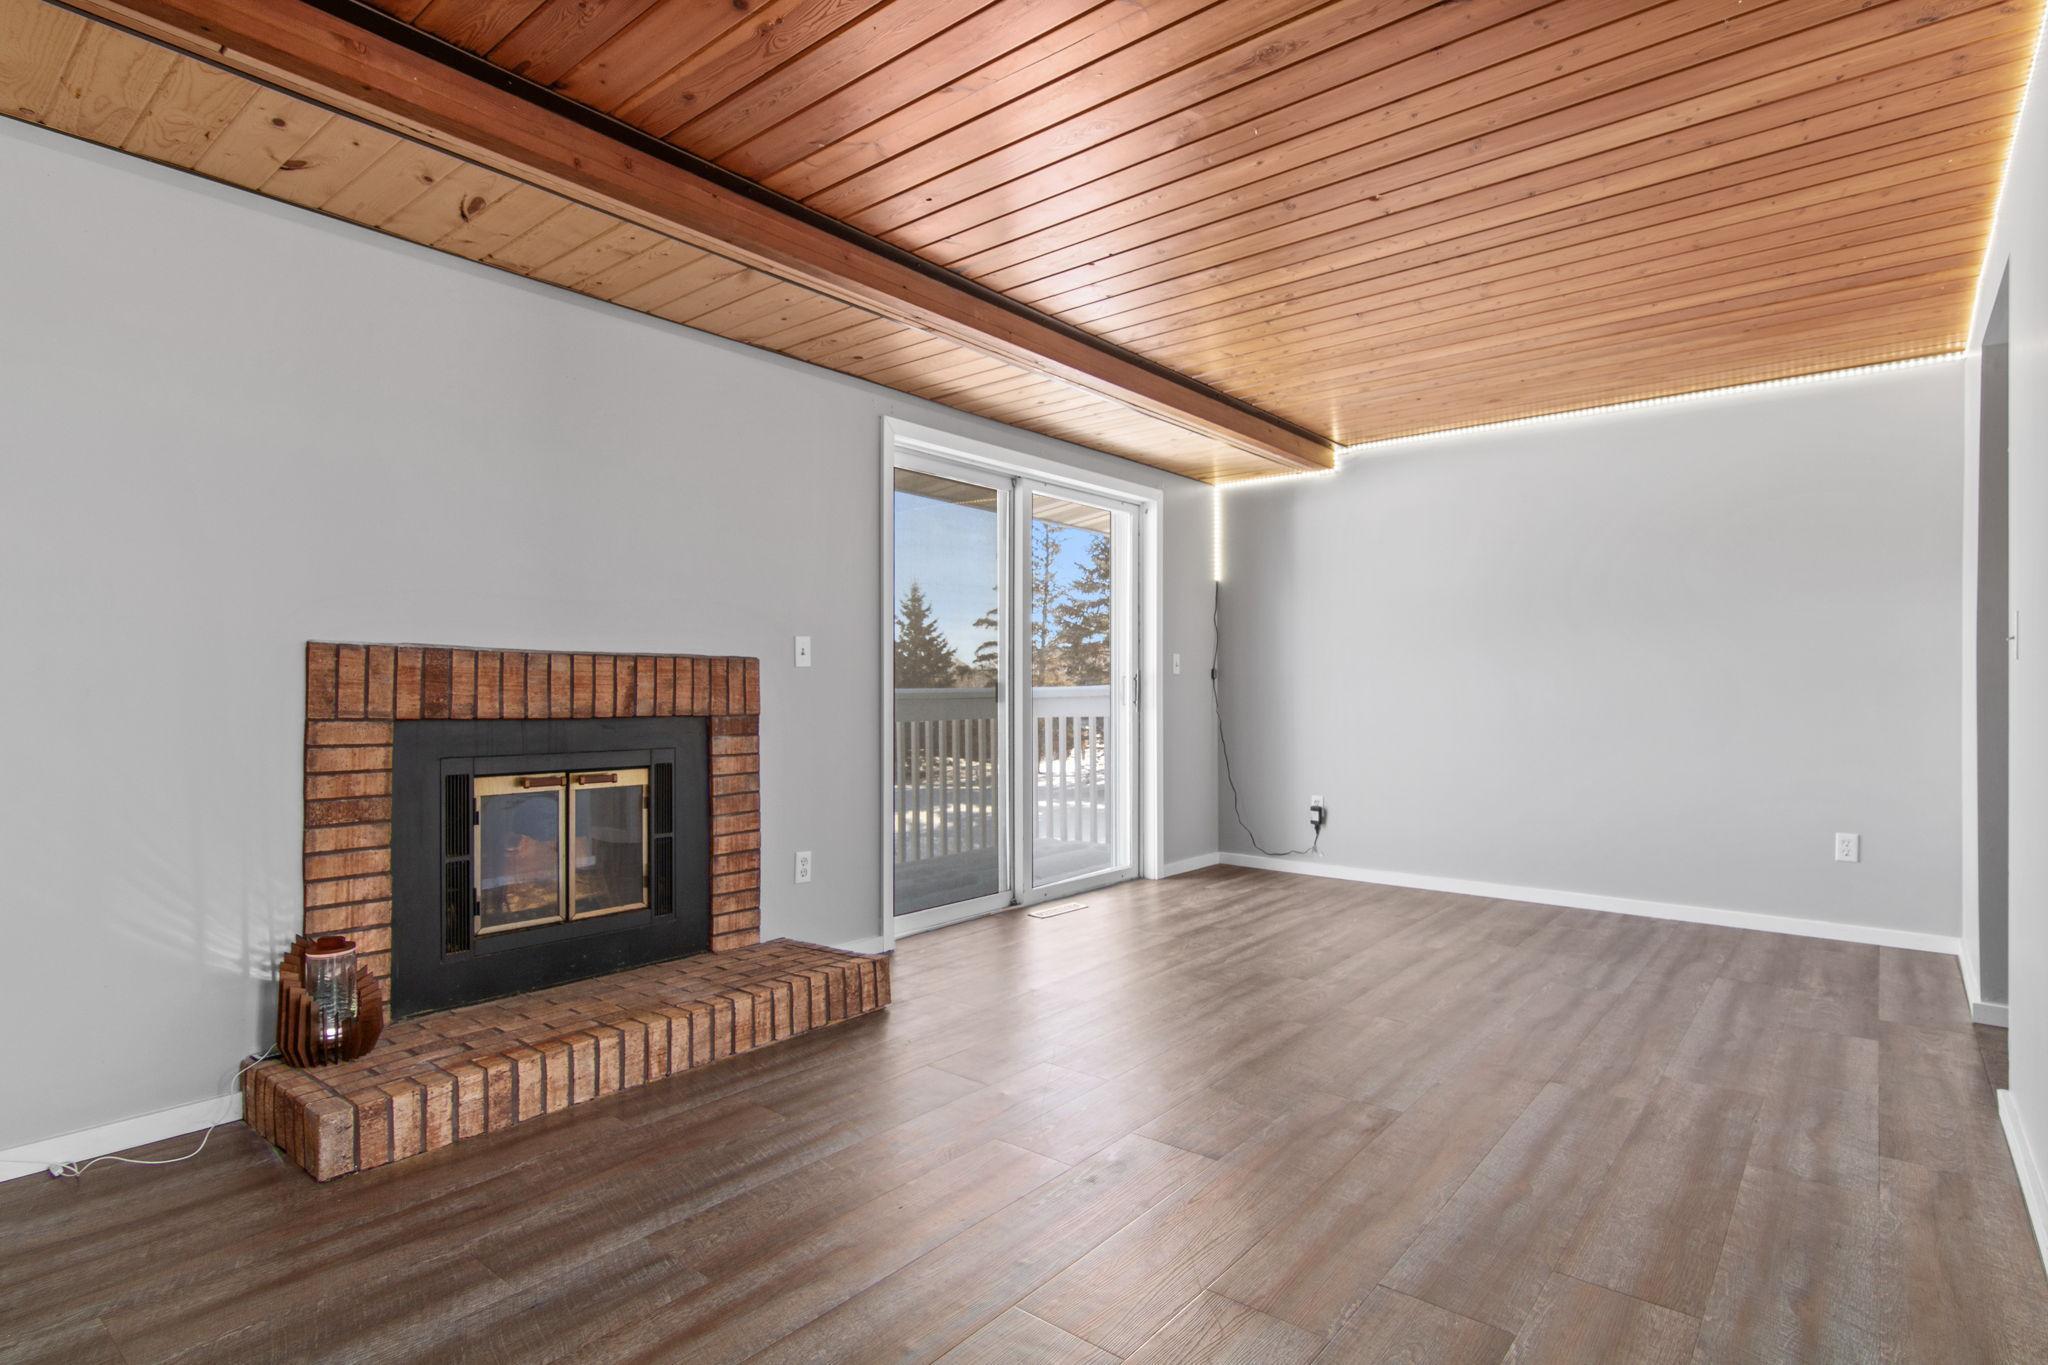
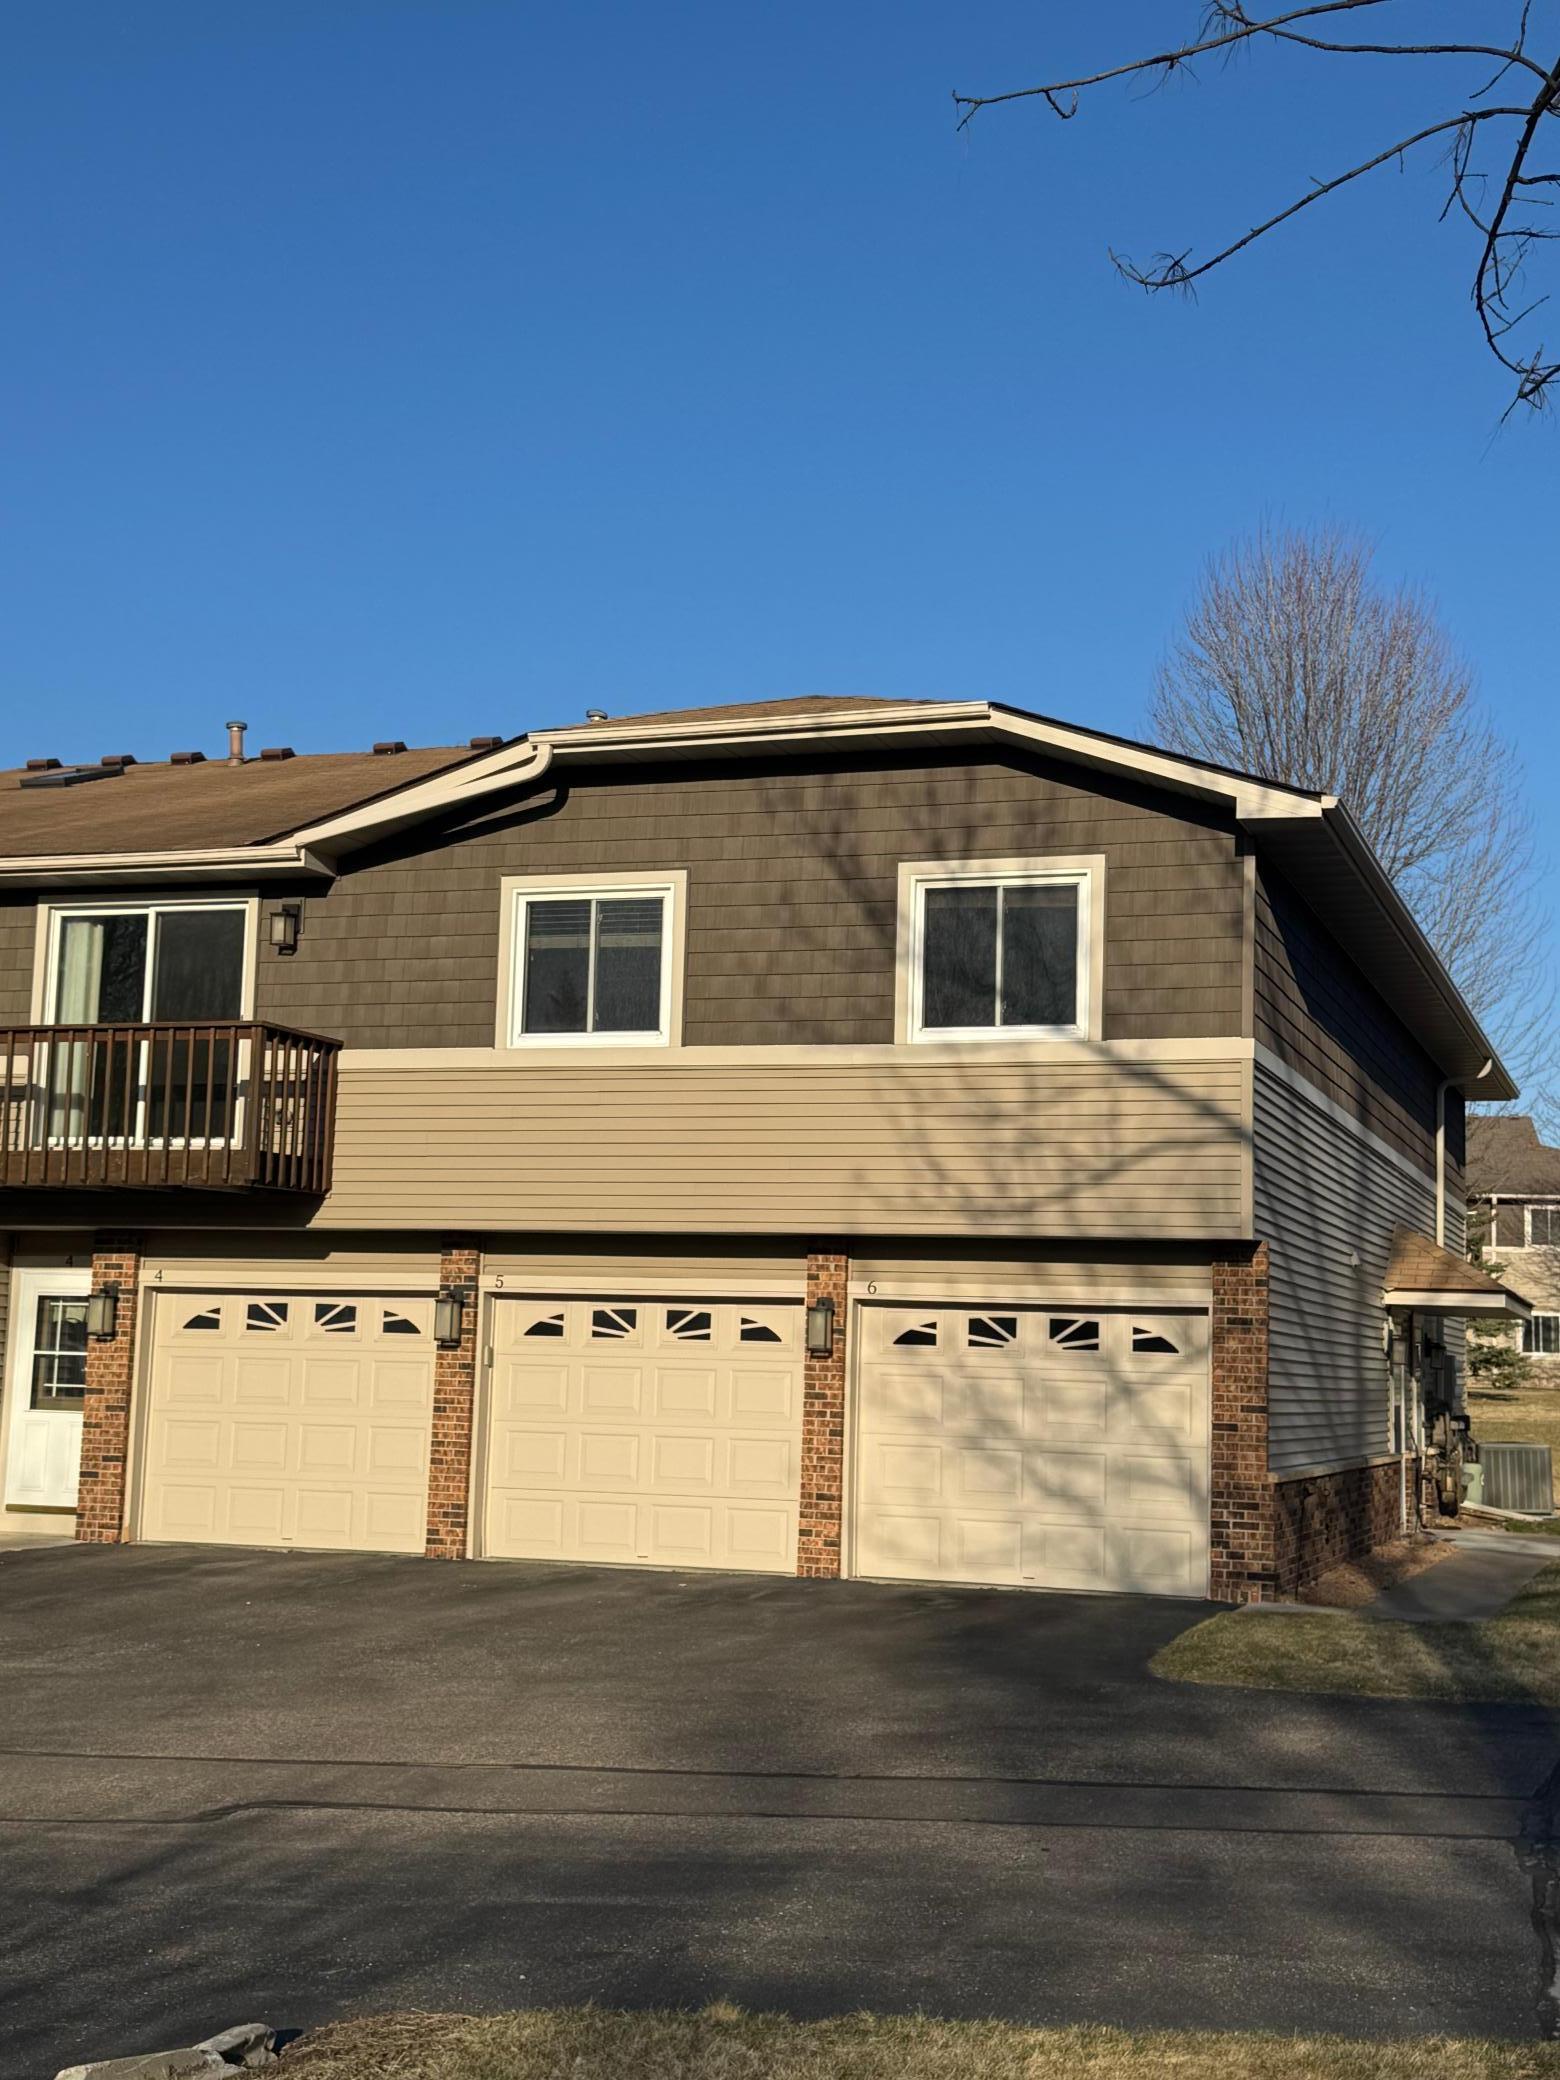
$399,900
3
bds
|
3
ba
|
2,358
sqft
|
built
1991
3875 Niagara Ln N, Plymouth, MN 55446
$-939
Cash flow
-12.3%
Cash-on-Cash Return
3.4%
Cap rate
0.7%
Rent to Value Ratio
$414,000
3
bds
|
4
ba
|
2,078
sqft
|
built
2005
5042 Everest Ln N, Plymouth, MN 55446
$-1,021
Cash flow
-12.9%
Cash-on-Cash Return
3.3%
Cap rate
0.6%
Rent to Value Ratio
$475,000
3
bds
|
3
ba
|
2,257
sqft
|
built
1986
1220 Sycamore Ln N, Plymouth, MN 55441
$-876
Cash flow
-9.6%
Cash-on-Cash Return
4.1%
Cap rate
0.6%
Rent to Value Ratio
$995,000
5
bds
|
5
ba
|
5,391
sqft
|
built
2012
16315 54th Ave N, Plymouth, MN 55446
$-2,845
Cash flow
-14.9%
Cash-on-Cash Return
2.8%
Cap rate
0.5%
Rent to Value Ratio

$445,000
3
bds
|
3
ba
|
1,840
sqft
|
built
2021
18522 60th Ave N, Plymouth, MN 55446
$-985
Cash flow
-11.5%
Cash-on-Cash Return
3.6%
Cap rate
0.7%
Rent to Value Ratio
$249,900
2
bds
|
2
ba
|
1,120
sqft
|
built
1983
1610 Merrimac Ln N, Plymouth, MN 55447
$-185
Cash flow
-3.9%
Cash-on-Cash Return
5.4%
Cap rate
0.9%
Rent to Value Ratio
$249,900
2
bds
|
2
ba
|
1,120
sqft
|
built
1983
1620 Merrimac Ln N, Plymouth, MN 55447
$-207
Cash flow
-4.3%
Cash-on-Cash Return
5.3%
Cap rate
0.9%
Rent to Value Ratio
$299,900
3
bds
|
3
ba
|
1,628
sqft
|
built
1999
16912 39th Ave N, Plymouth, MN 55446
$-448
Cash flow
-7.8%
Cash-on-Cash Return
4.5%
Cap rate
0.8%
Rent to Value Ratio
$315,000
3
bds
|
2
ba
|
1,375
sqft
|
built
1985
4811 Orchid Ln N, Plymouth, MN 55446
$-620
Cash flow
-10.3%
Cash-on-Cash Return
3.9%
Cap rate
0.7%
Rent to Value Ratio

$575,000
4
bds
|
4
ba
|
3,503
sqft
|
built
1982
4725 Norwood Ln N, Plymouth, MN 55442
$-1,030
Cash flow
-9.3%
Cash-on-Cash Return
4.1%
Cap rate
0.6%
Rent to Value Ratio

$450,000
3
bds
|
2
ba
|
1,558
sqft
|
built
1956
17610 11th Ave N, Plymouth, MN 55447
$-941
Cash flow
-10.9%
Cash-on-Cash Return
3.8%
Cap rate
0.6%
Rent to Value Ratio
$615,000
5
bds
|
4
ba
|
3,413
sqft
|
built
1999
4895 Olive Ln N, Plymouth, MN 55446
$-1,529
Cash flow
-13.0%
Cash-on-Cash Return
3.3%
Cap rate
0.5%
Rent to Value Ratio
$469,900
3
bds
|
3
ba
|
2,700
sqft
|
built
1986
4105 Terraceview Ln N, Plymouth, MN 55446
$-1,306
Cash flow
-14.5%
Cash-on-Cash Return
2.9%
Cap rate
0.6%
Rent to Value Ratio

$1,429,900
5
bds
|
4
ba
|
5,055
sqft
|
built
1981
815 Alvarado Ln N, Plymouth, MN 55447
$-4,014
Cash flow
-14.6%
Cash-on-Cash Return
2.9%
Cap rate
0.4%
Rent to Value Ratio

$1,495,000
3
bds
|
4
ba
|
4,273
sqft
|
built
2012
14515 4th Ave N, Plymouth, MN 55447
$-4,356
Cash flow
-15.2%
Cash-on-Cash Return
2.8%
Cap rate
0.5%
Rent to Value Ratio

$525,000
3
bds
|
3
ba
|
2,604
sqft
|
built
2004
5696 Trenton Ln N, Plymouth, MN 55442
$-1,593
Cash flow
-15.8%
Cash-on-Cash Return
2.6%
Cap rate
0.5%
Rent to Value Ratio
$480,000
4
bds
|
2
ba
|
1,945
sqft
|
built
1976
3220 Walnut Grove Ln N, Plymouth, MN 55447
$-739
Cash flow
-8.0%
Cash-on-Cash Return
4.4%
Cap rate
0.6%
Rent to Value Ratio

$949,900
5
bds
|
5
ba
|
4,233
sqft
|
built
2010
15702 57th Pl N, Plymouth, MN 55446
$-3,027
Cash flow
-16.6%
Cash-on-Cash Return
2.4%
Cap rate
0.4%
Rent to Value Ratio

$409,900
4
bds
|
2
ba
|
1,782
sqft
|
built
1979
5005 Jonquil Ln N, Plymouth, MN 55442
$-839
Cash flow
-10.7%
Cash-on-Cash Return
3.8%
Cap rate
0.6%
Rent to Value Ratio
$795,000
4
bds
|
4
ba
|
3,120
sqft
|
built
2018
18360 58th Ave N, Plymouth, MN 55446
$-1,868
Cash flow
-12.3%
Cash-on-Cash Return
3.4%
Cap rate
0.6%
Rent to Value Ratio

$170,000
2
bds
|
2
ba
|
1,132
sqft
|
built
1983
10600 43rd Ave N, Plymouth, MN 55442
$-376
Cash flow
-11.5%
Cash-on-Cash Return
3.6%
Cap rate
1.1%
Rent to Value Ratio
$639,900
5
bds
|
4
ba
|
3,202
sqft
|
built
1969
105 Zachary Ln N, Plymouth, MN 55441
$-1,120
Cash flow
-9.1%
Cash-on-Cash Return
4.2%
Cap rate
0.6%
Rent to Value Ratio

$474,900
3
bds
|
3
ba
|
2,322
sqft
|
built
1991
13110 55th Pl N, Plymouth, MN 55442
$-768
Cash flow
-8.4%
Cash-on-Cash Return
4.3%
Cap rate
0.7%
Rent to Value Ratio
$225,000
2
bds
|
1
ba
|
1,058
sqft
|
built
1979
15768 27th Ave N, Plymouth, MN 55447
$-379
Cash flow
-8.8%
Cash-on-Cash Return
4.2%
Cap rate
0.8%
Rent to Value Ratio
$229,900
2
bds
|
1
ba
|
1,150
sqft
|
built
1974
15930 18th Pl N, Plymouth, MN 55447
$-209
Cash flow
-4.7%
Cash-on-Cash Return
5.2%
Cap rate
1.0%
Rent to Value Ratio

$165,900
2
bds
|
2
ba
|
1,015
sqft
|
built
1982
35 Nathan Ln N, Plymouth, MN 55441
$-316
Cash flow
-9.9%
Cash-on-Cash Return
4.0%
Cap rate
1.1%
Rent to Value Ratio

$256,000
2
bds
|
2
ba
|
1,120
sqft
|
built
1973
3490 Pilgrim Ln N, Plymouth, MN 55441
$-334
Cash flow
-6.8%
Cash-on-Cash Return
4.7%
Cap rate
0.8%
Rent to Value Ratio

$158,500
2
bds
|
2
ba
|
1,006
sqft
|
built
1982
35 Nathan Ln N, Plymouth, MN 55441
$-344
Cash flow
-11.3%
Cash-on-Cash Return
3.7%
Cap rate
1.1%
Rent to Value Ratio