Oakland Park, FL Investment Properties for Sale
Browse homes for sale and investment properties in Oakland Park, FL. Refine your search by price, property type, or more.
Best cash flowing properties in Oakland Park, FL

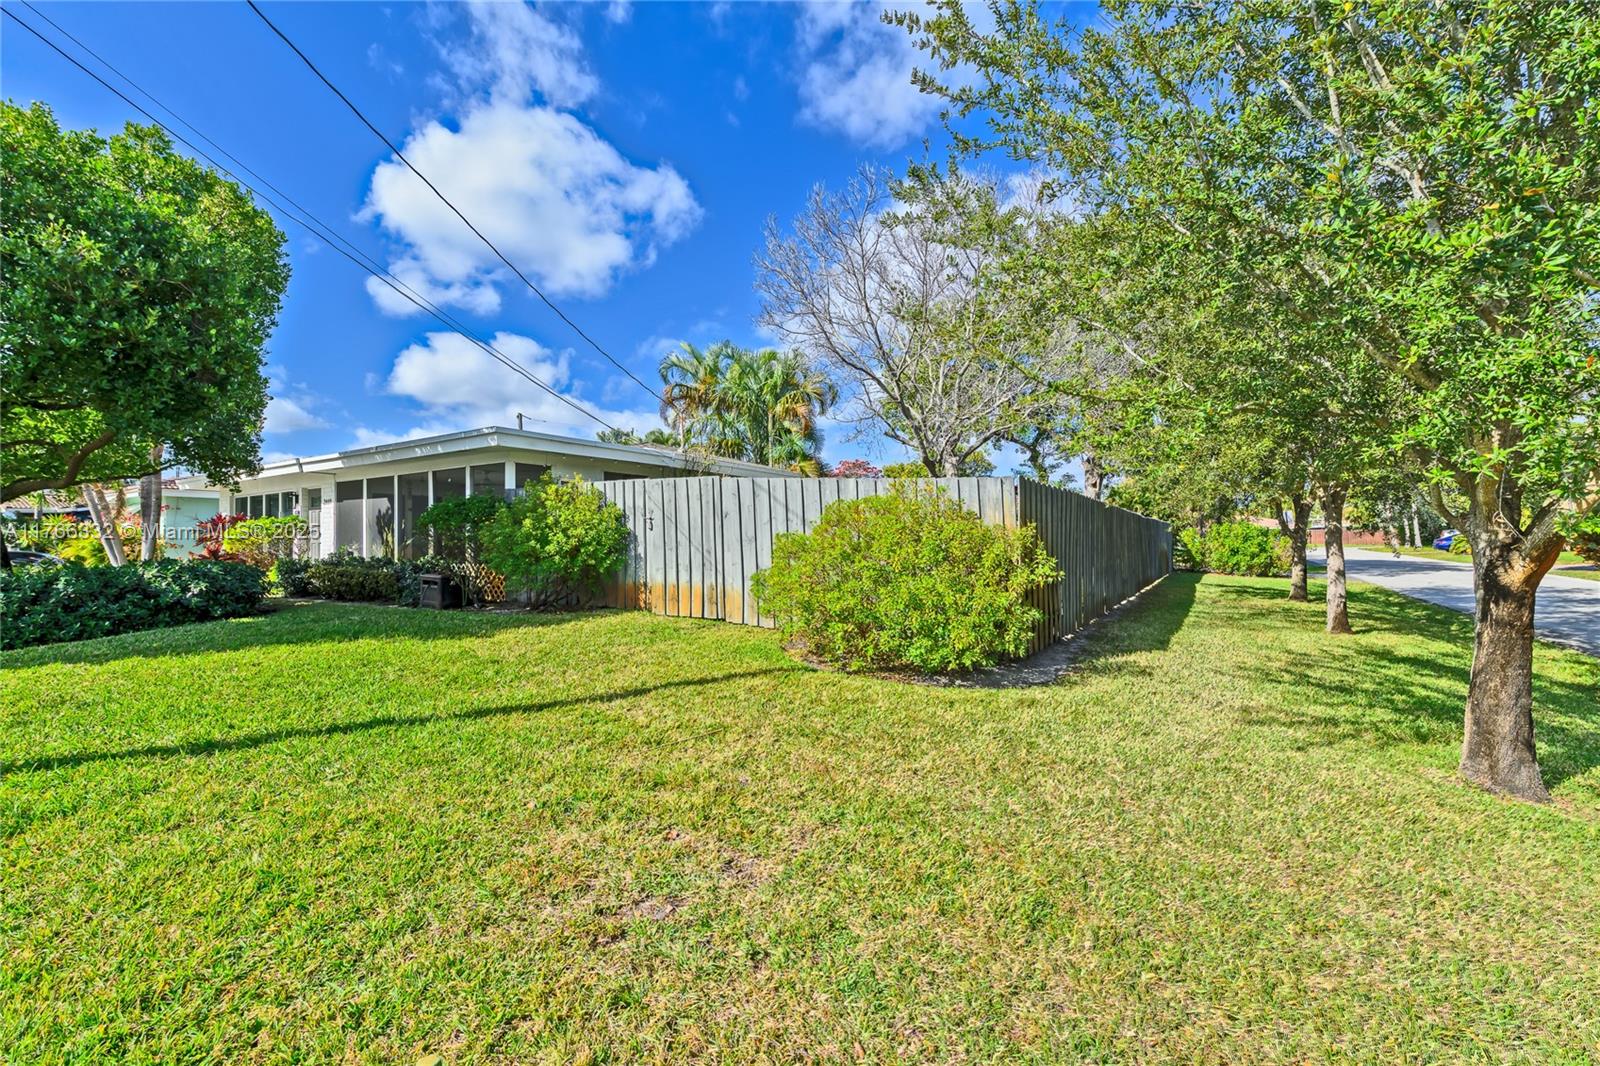
$735,000
3
bds
|
2
ba
|
1,463
sqft
|
built
1962
3295 NW 6th Ave, Oakland Park, FL 33309
$294
Cash flow
2.1%
Cash-on-Cash Return
6.6%
Cap rate
1.0%
Rent to Value Ratio
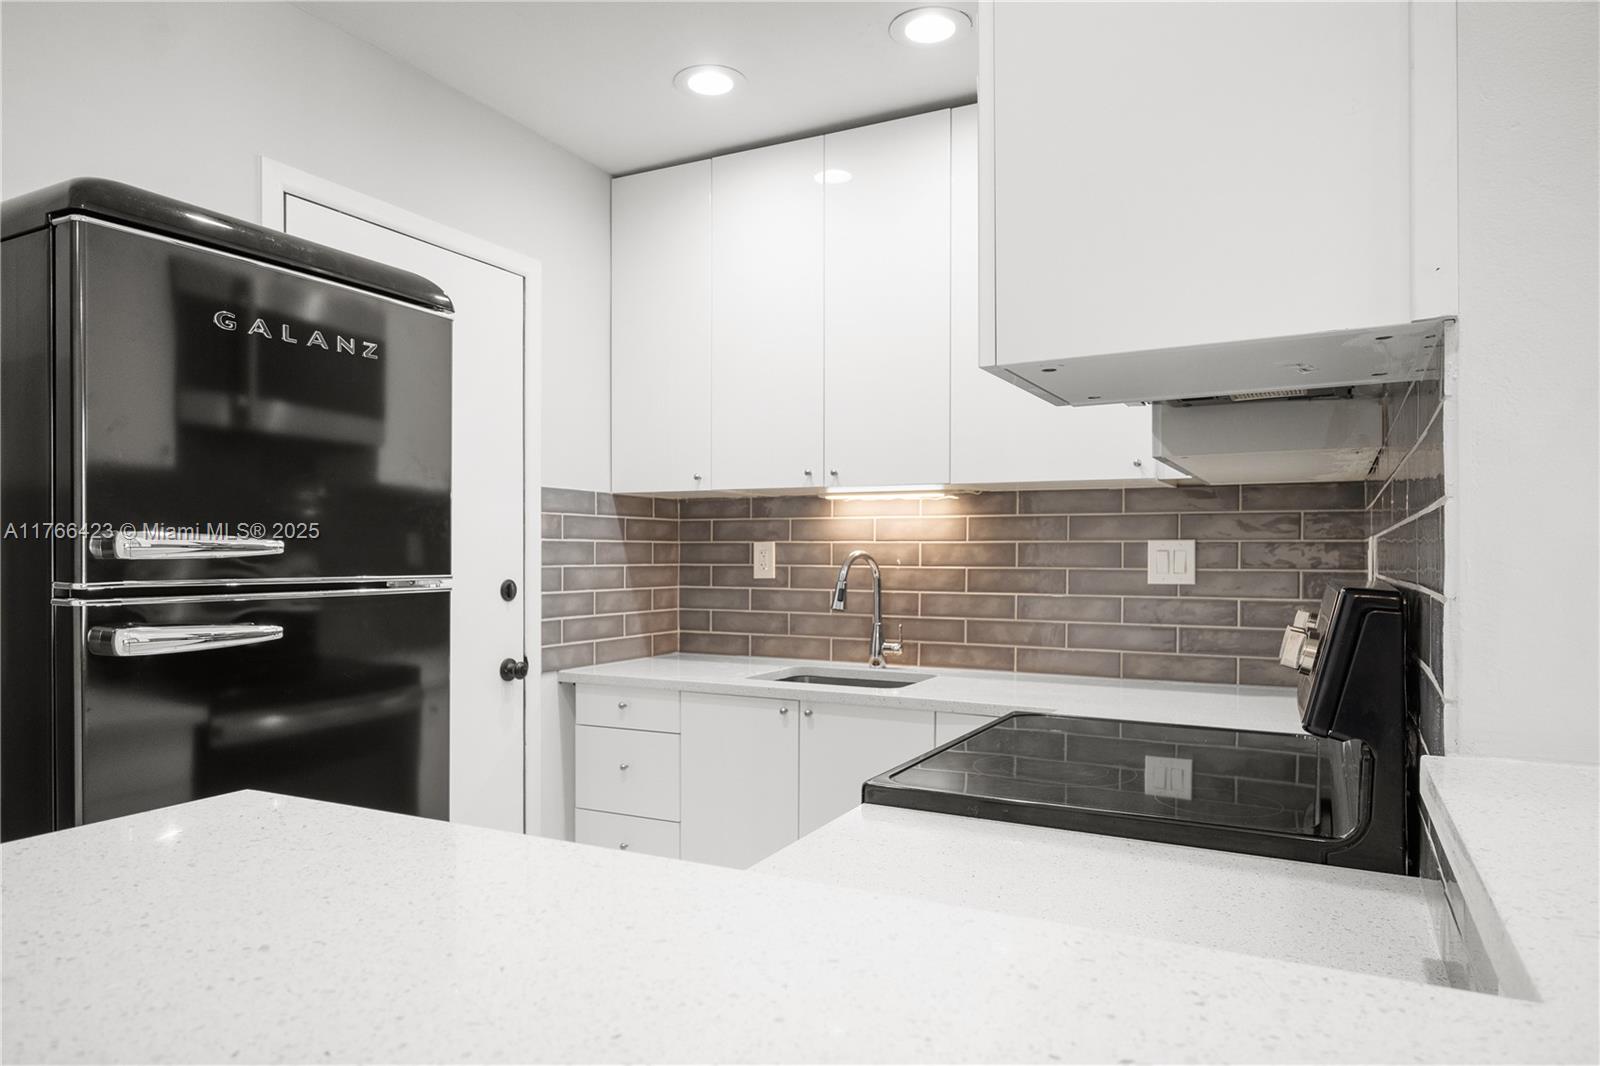
$174,900
2
bds
|
1
ba
|
1,150
sqft
|
built
1989
3021 N Oakland Forest Dr, Oakland Park, FL 33309
$259
Cash flow
7.7%
Cash-on-Cash Return
7.9%
Cap rate
1.0%
Rent to Value Ratio
31 out of 468 properties for sale in Oakland Park, FL
Limited Results Shown
Create a free account, or log in to reveal all property listings and enjoy the complete experience.

$485,000
2
bds
|
2
ba
|
1,281
sqft
|
built
1968
4499 NW 18th Ave, Oakland Park, FL 33309
$-565
Cash flow
-6.1%
Cash-on-Cash Return
4.7%
Cap rate
0.6%
Rent to Value Ratio

$430,000
3
bds
|
2
ba
|
1,016
sqft
|
built
1957
310 NW 55th St, Oakland Park, FL 33309
$-748
Cash flow
-9.1%
Cash-on-Cash Return
4.1%
Cap rate
0.7%
Rent to Value Ratio
$354,000
2
bds
|
2
ba
|
912
sqft
|
built
1972
3050 NE 16th Ave, Oakland Park, FL 33334
$-1,180
Cash flow
-17.4%
Cash-on-Cash Return
2.1%
Cap rate
0.8%
Rent to Value Ratio

$227,000
2
bds
|
1
ba
|
900
sqft
|
built
1984
2761 S Oakland Forest Dr, Oakland Park, FL 33309
$-497
Cash flow
-11.4%
Cash-on-Cash Return
3.5%
Cap rate
1.0%
Rent to Value Ratio
$357,000
3
bds
|
2
ba
|
1,156
sqft
|
built
1986
3064 S Oakland Forest Dr, Oakland Park, FL 33309
$-785
Cash flow
-11.5%
Cash-on-Cash Return
3.5%
Cap rate
0.8%
Rent to Value Ratio

$399,999
bds
|
0
ba
|
1,078
sqft
|
built
1957
565 NE 32nd St, Oakland Park, FL 33334
$-1,527
Cash flow
-19.9%
Cash-on-Cash Return
1.6%
Cap rate
0.5%
Rent to Value Ratio

$475,000
3
bds
|
1
ba
|
1,071
sqft
|
built
1962
801 NE 57th St, Oakland Park, FL 33334
$-602
Cash flow
-6.6%
Cash-on-Cash Return
4.6%
Cap rate
0.7%
Rent to Value Ratio
$245,000
2
bds
|
2
ba
|
960
sqft
|
built
1966
4025 N Federal Hwy, Oakland Park, FL 33308
$-1,014
Cash flow
-21.6%
Cash-on-Cash Return
1.2%
Cap rate
0.8%
Rent to Value Ratio
$928,000
bds
|
0
ba
|
2,148
sqft
|
built
1964
1750 NE 52nd St, Oakland Park, FL 33334
$-4,273
Cash flow
-24.0%
Cash-on-Cash Return
0.6%
Cap rate
0.2%
Rent to Value Ratio

$749,900
2
bds
|
1
ba
|
1,202
sqft
|
built
1958
3820 NE 16th Ter, Oakland Park, FL 33334
$-2,027
Cash flow
-14.1%
Cash-on-Cash Return
2.9%
Cap rate
0.5%
Rent to Value Ratio
$475,000
4
bds
|
2
ba
|
1,397
sqft
|
built
1955
5400 NE 1st Ter, Oakland Park, FL 33334
$-726
Cash flow
-8.0%
Cash-on-Cash Return
4.3%
Cap rate
0.7%
Rent to Value Ratio
$240,000
2
bds
|
2
ba
|
1,256
sqft
|
built
1991
2400 NW 33rd St, Oakland Park, FL 33309
$-529
Cash flow
-11.5%
Cash-on-Cash Return
3.5%
Cap rate
0.9%
Rent to Value Ratio

$220,000
2
bds
|
1
ba
|
1,070
sqft
|
built
1986
3083 N Oakland Forest Dr, Oakland Park, FL 33309
$-392
Cash flow
-9.3%
Cash-on-Cash Return
4.0%
Cap rate
0.9%
Rent to Value Ratio
$265,000
2
bds
|
2
ba
|
1,241
sqft
|
built
1992
2425 NW 33rd St, Oakland Park, FL 33309
$-819
Cash flow
-16.1%
Cash-on-Cash Return
2.4%
Cap rate
0.8%
Rent to Value Ratio
$233,000
1
bds
|
1
ba
|
600
sqft
|
built
1963
3040 NE 16th Ave, Oakland Park, FL 33334
$-750
Cash flow
-16.8%
Cash-on-Cash Return
2.3%
Cap rate
0.9%
Rent to Value Ratio
$175,000
2
bds
|
2
ba
|
920
sqft
|
built
1981
109 Lake Emerald Dr, Oakland Park, FL 33309
$-524
Cash flow
-15.6%
Cash-on-Cash Return
2.6%
Cap rate
1.1%
Rent to Value Ratio

$699,999
3
bds
|
2
ba
|
2,130
sqft
|
built
1976
1931 NW 41st St, Oakland Park, FL 33309
$-1,501
Cash flow
-11.2%
Cash-on-Cash Return
3.6%
Cap rate
0.5%
Rent to Value Ratio
$189,000
2
bds
|
1
ba
|
609
sqft
|
built
1978
5186 NE 6th Ave, Oakland Park, FL 33334
$-445
Cash flow
-12.3%
Cash-on-Cash Return
3.3%
Cap rate
1.0%
Rent to Value Ratio

$749,000
2
bds
|
2
ba
|
1,323
sqft
|
built
1963
4000 NE 16th Ave, Oakland Park, FL 33334
$-1,881
Cash flow
-13.1%
Cash-on-Cash Return
3.1%
Cap rate
0.6%
Rent to Value Ratio
$625,000
3
bds
|
3
ba
|
1,434
sqft
|
built
1970
3449 NE 17th Way, Oakland Park, FL 33334
$-1,905
Cash flow
-15.9%
Cash-on-Cash Return
2.5%
Cap rate
0.6%
Rent to Value Ratio

$244,900
2
bds
|
2
ba
|
920
sqft
|
built
1981
114 Lake Emerald Dr, Oakland Park, FL 33309
$-838
Cash flow
-17.9%
Cash-on-Cash Return
2.0%
Cap rate
0.9%
Rent to Value Ratio
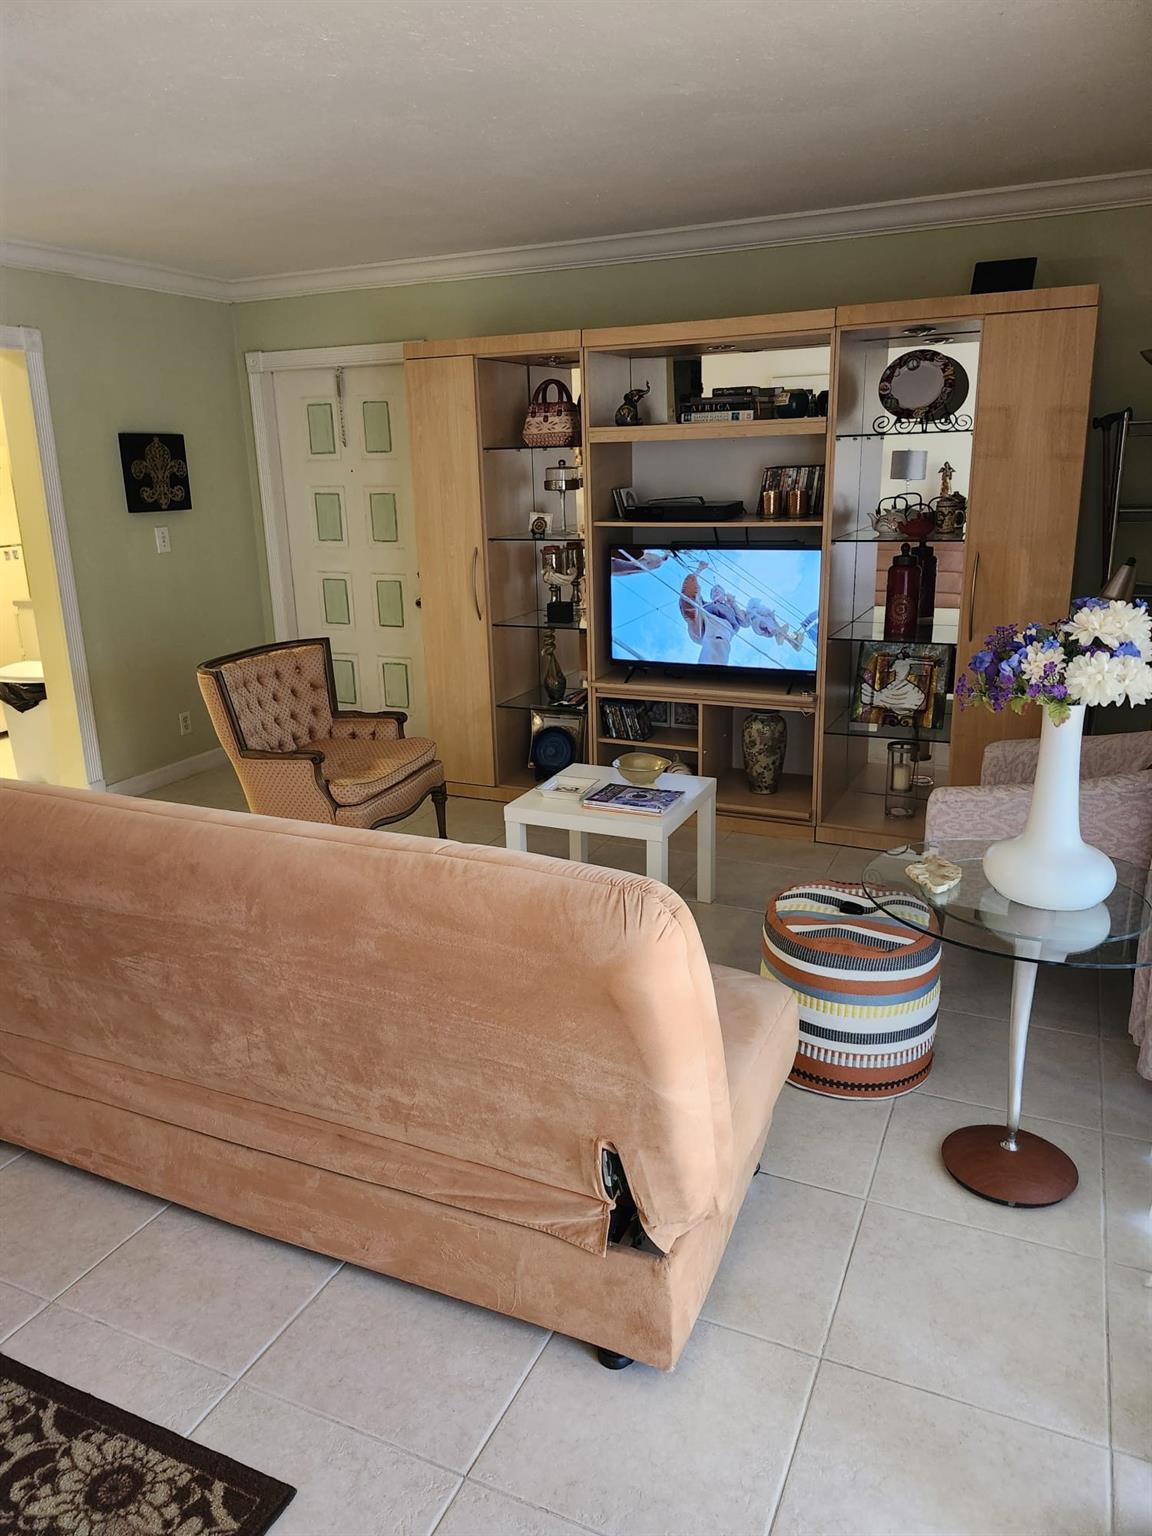
$174,900
2
bds
|
1
ba
|
1,150
sqft
|
built
1989
3021 N Oakland Forest Dr, Oakland Park, FL 33309
$259
Cash flow
7.7%
Cash-on-Cash Return
7.9%
Cap rate
1.0%
Rent to Value Ratio
$735,000
3
bds
|
2
ba
|
1,463
sqft
|
built
1962
3295 NW 6th Ave, Oakland Park, FL 33309
$294
Cash flow
2.1%
Cash-on-Cash Return
6.6%
Cap rate
1.0%
Rent to Value Ratio
$165,000
1
bds
|
1
ba
|
412
sqft
|
built
1973
4081 N Dixie Hwy, Oakland Park, FL 33334
$-107
Cash flow
-3.4%
Cash-on-Cash Return
5.4%
Cap rate
1.0%
Rent to Value Ratio
$139,900
1
bds
|
1
ba
|
600
sqft
|
built
1980
250 NE 40th St, Oakland Park, FL 33334
$-137
Cash flow
-5.1%
Cash-on-Cash Return
5.0%
Cap rate
1.1%
Rent to Value Ratio
$149,000
1
bds
|
1
ba
|
760
sqft
|
built
1974
3109 Oakland Shores Dr, Oakland Park, FL 33309
$-30
Cash flow
-1.1%
Cash-on-Cash Return
5.9%
Cap rate
1.1%
Rent to Value Ratio

$185,000
2
bds
|
1
ba
|
1,150
sqft
|
built
1986
3065 N Oakland Forest Dr, Oakland Park, FL 33309
$170
Cash flow
4.8%
Cash-on-Cash Return
7.3%
Cap rate
1.1%
Rent to Value Ratio
$250,000
2
bds
|
2
ba
|
920
sqft
|
built
1985
115 Lake Emerald Dr, Oakland Park, FL 33309
$-37
Cash flow
-0.8%
Cash-on-Cash Return
6.0%
Cap rate
0.9%
Rent to Value Ratio
$230,000
2
bds
|
2
ba
|
920
sqft
|
built
1981
109 Lake Emerald Dr, Oakland Park, FL 33309
$-94
Cash flow
-2.1%
Cash-on-Cash Return
5.7%
Cap rate
0.9%
Rent to Value Ratio

$260,000
2
bds
|
2
ba
|
1,160
sqft
|
built
1987
3041 N Oakland Forest Dr, Oakland Park, FL 33309
$-1
Cash flow
0.0%
Cash-on-Cash Return
6.1%
Cap rate
0.8%
Rent to Value Ratio

$210,000
1
bds
|
1
ba
|
638
sqft
|
built
1973
850 E Commercial Blvd, Oakland Park, FL 33334
$-127
Cash flow
-3.2%
Cash-on-Cash Return
5.4%
Cap rate
0.8%
Rent to Value Ratio