Niles, MI Investment Properties for Sale
Browse homes for sale and investment properties in Niles, MI. Refine your search by price, property type, or more.
Best cash flowing properties in Niles, MI
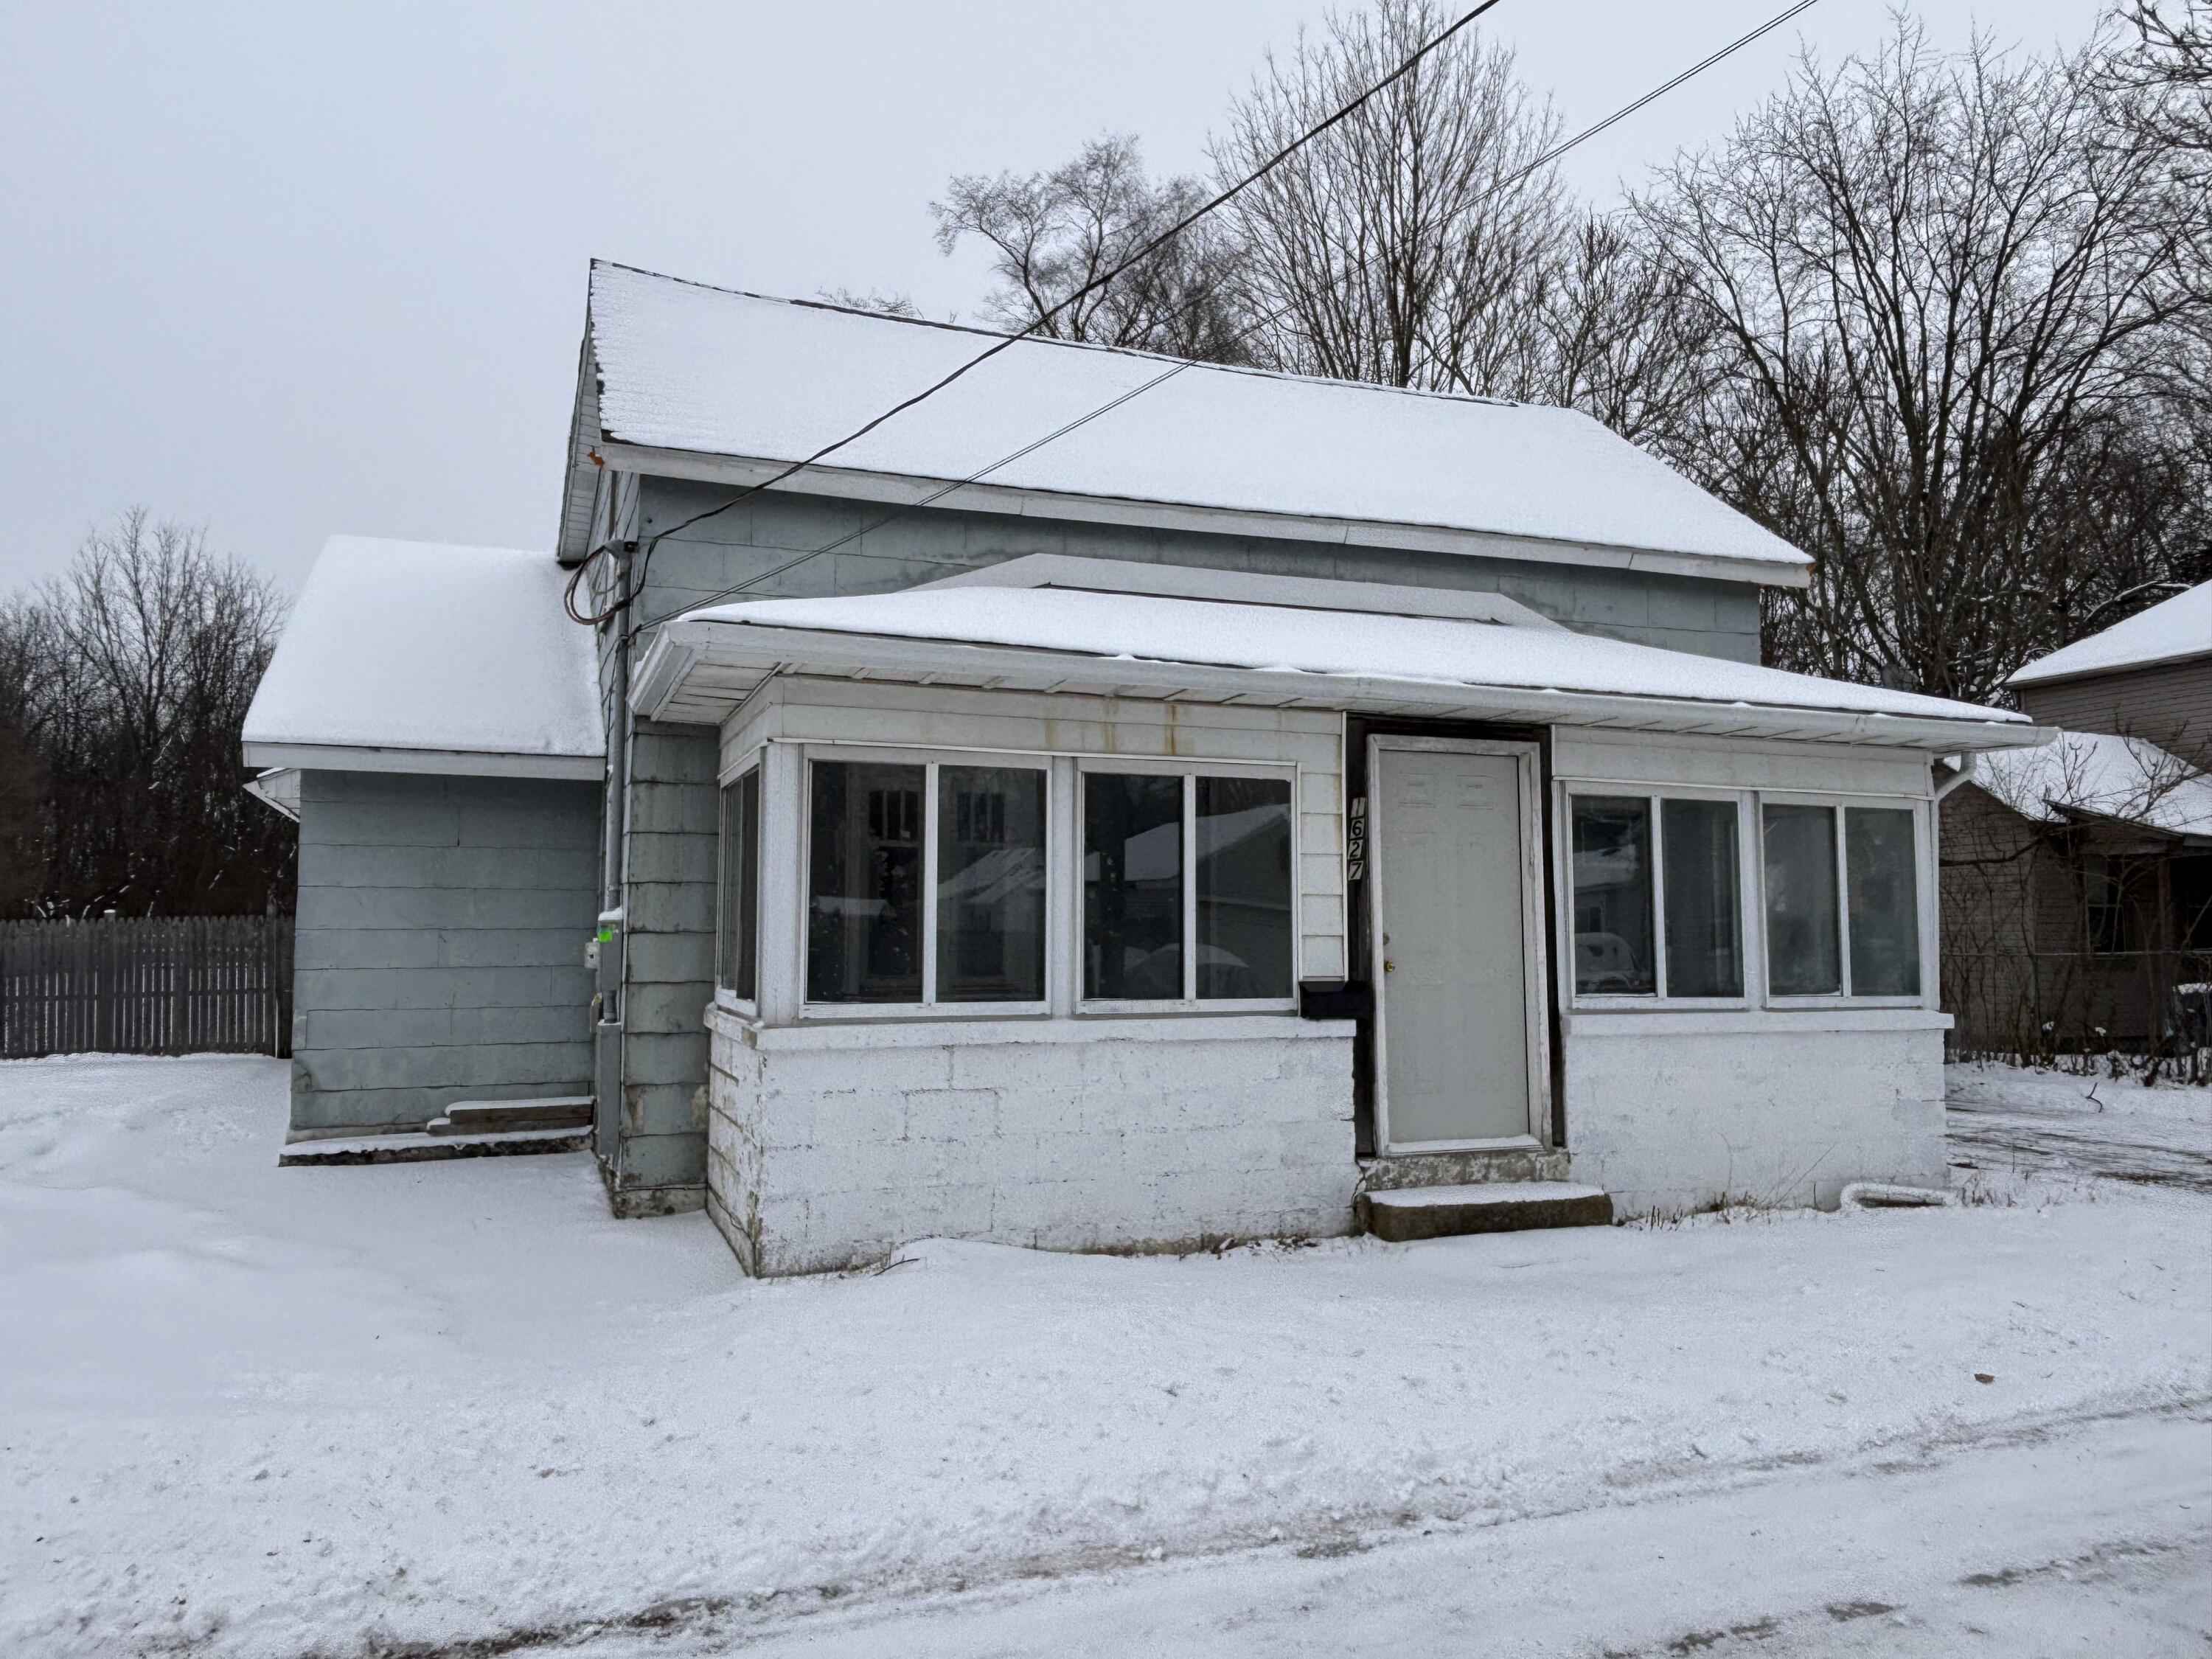
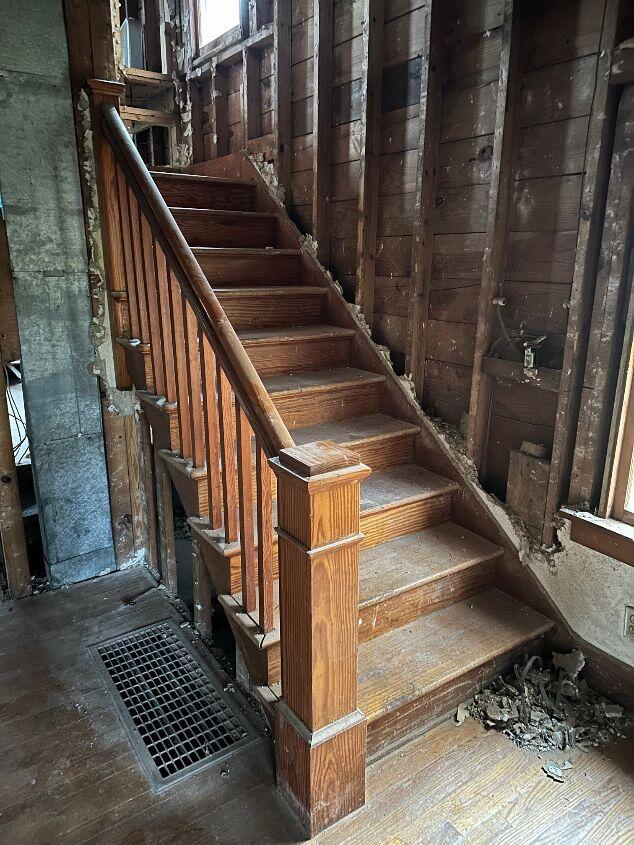
$74,500
4
bds
|
1
ba
|
1,779
sqft
|
built
1880
1627 N 12th St, Niles, MI 49120
$497
Cash flow
34.8%
Cash-on-Cash Return
14.2%
Cap rate
1.9%
Rent to Value Ratio
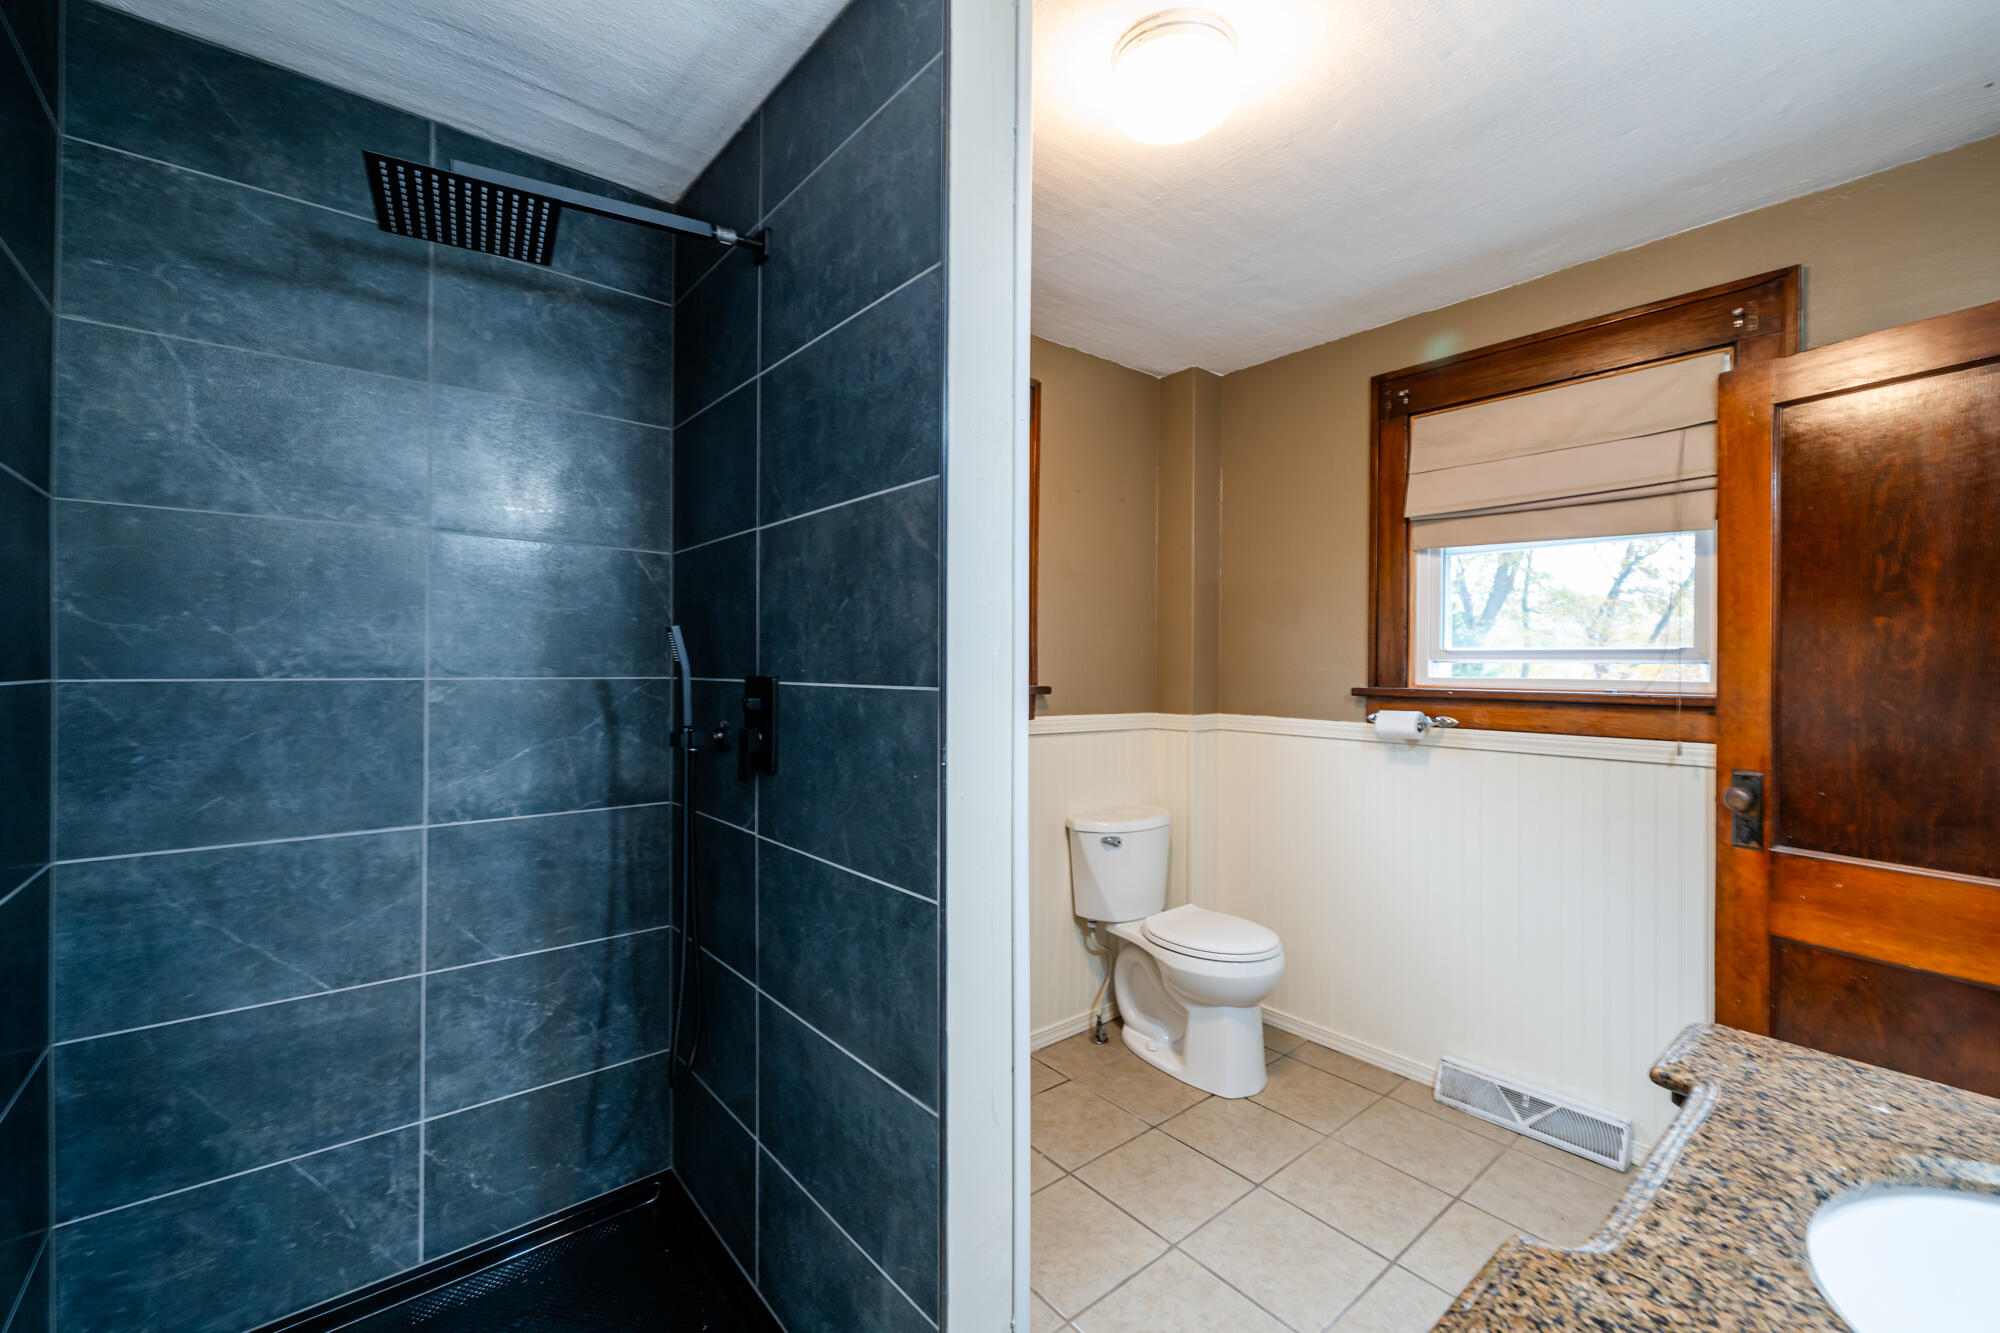
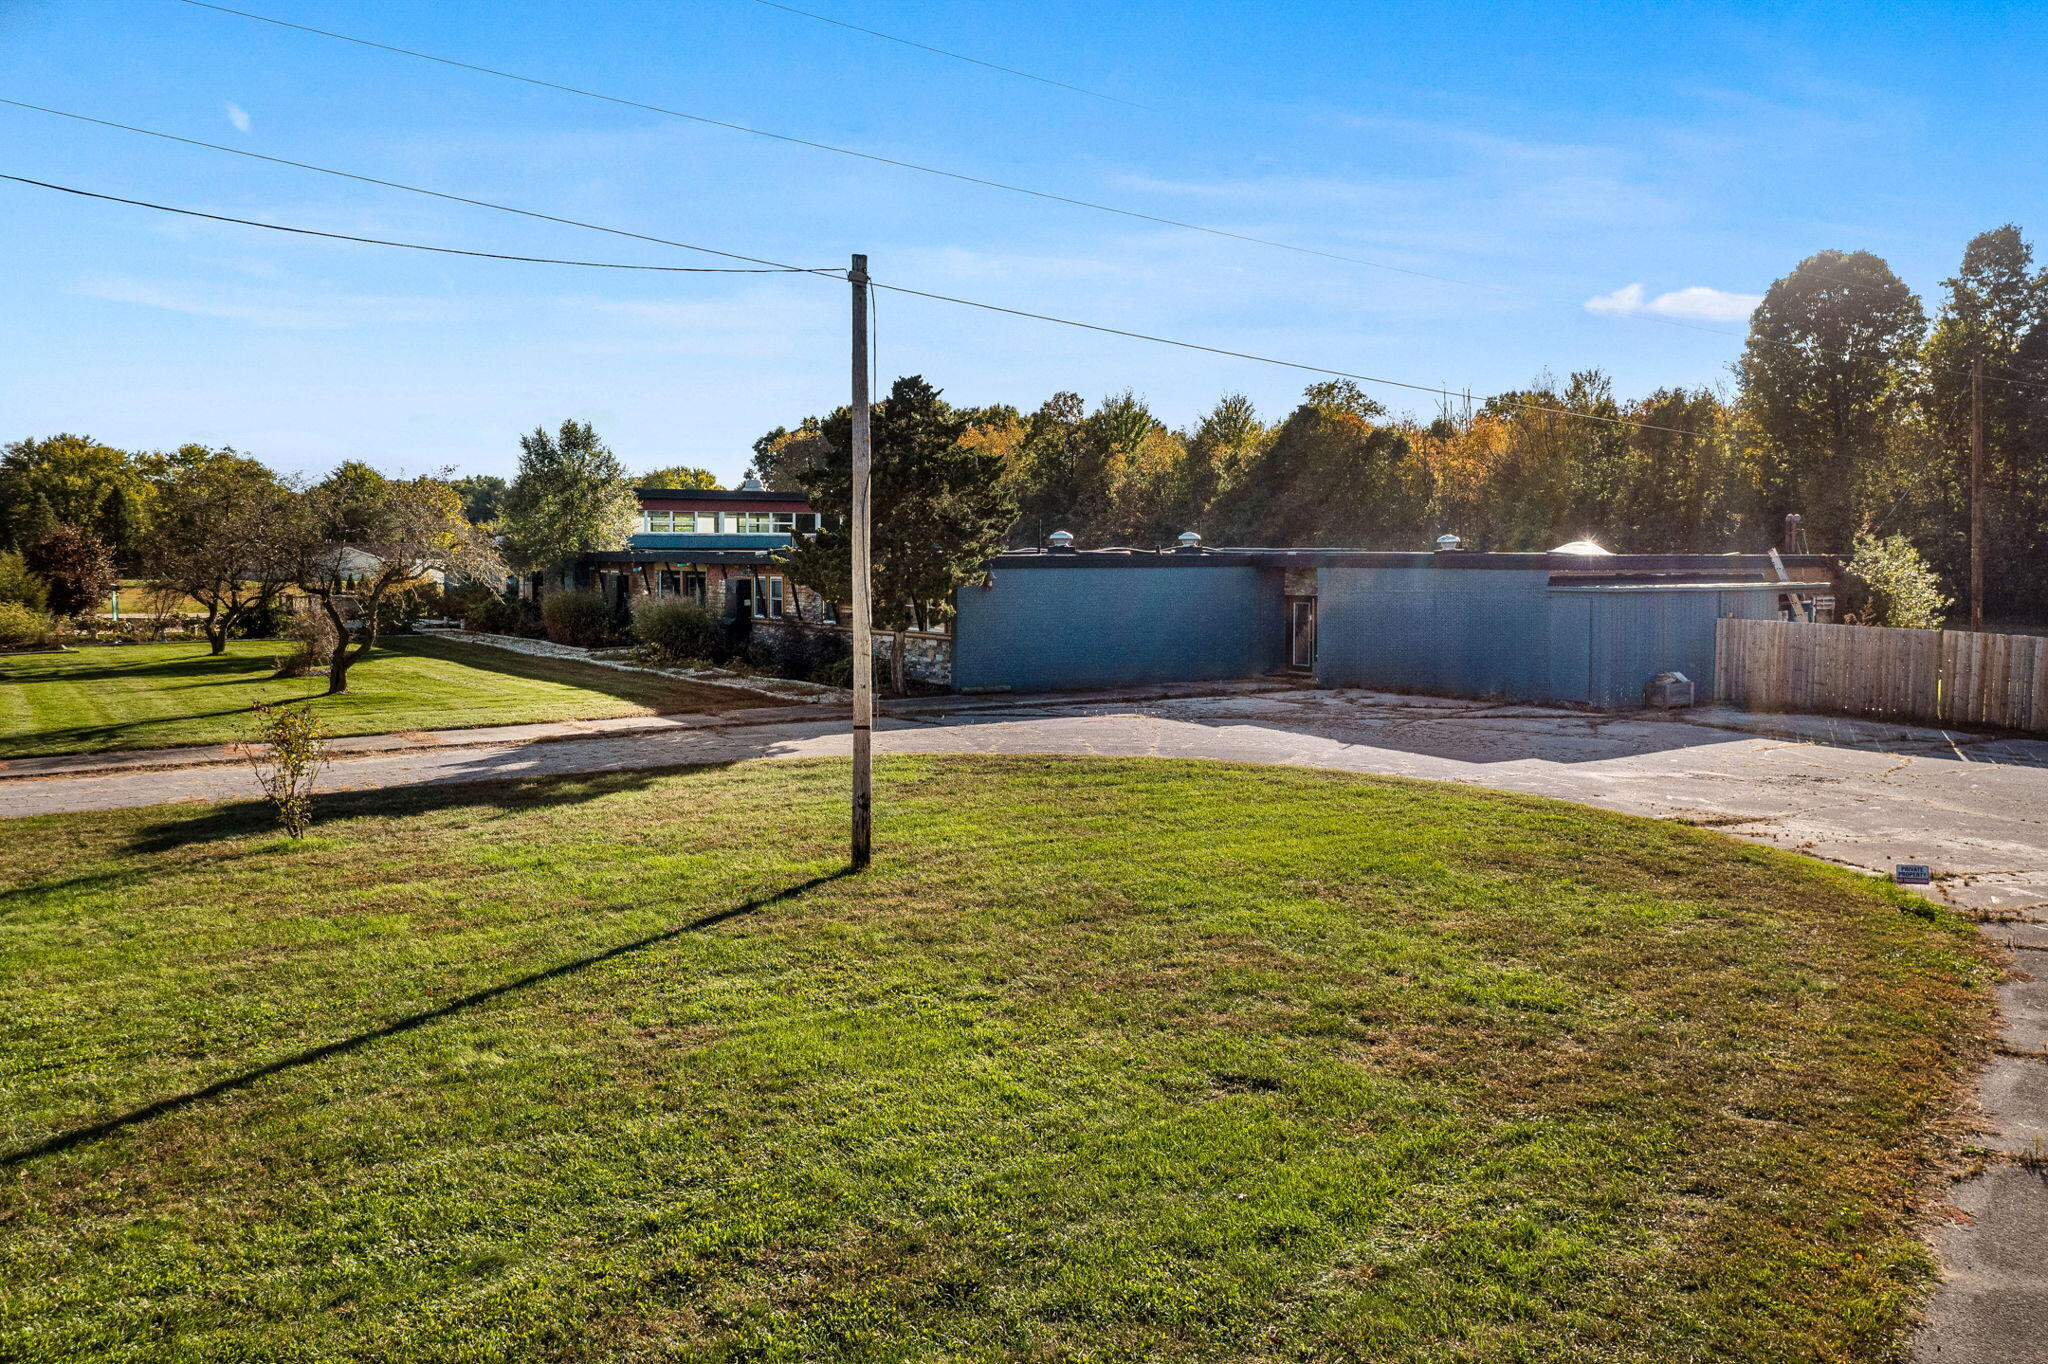
$105,000
3
bds
|
1
ba
|
1,440
sqft
|
built
1900
317 E Bertrand Rd, Niles, MI 49120
$276
Cash flow
13.7%
Cash-on-Cash Return
9.3%
Cap rate
1.3%
Rent to Value Ratio
33 out of 52 properties for sale in Niles, MI
Limited Results Shown
Create a free account, or log in to reveal all property listings and enjoy the complete experience.
$295,000
2
bds
|
2
ba
|
1,282
sqft
|
built
1940
1820 River Bluff St, Niles, MI 49120
$-535
Cash flow
-9.5%
Cash-on-Cash Return
4.0%
Cap rate
0.5%
Rent to Value Ratio

$205,000
4
bds
|
2
ba
|
1,575
sqft
|
built
1962
1713 Kilarney Ln, Niles, MI 49120
$4
Cash flow
0.1%
Cash-on-Cash Return
6.2%
Cap rate
0.8%
Rent to Value Ratio

$299,900
5
bds
|
3
ba
|
3,702
sqft
|
built
1900
2567 Gilbert Ave, Niles, MI 49120
$-14
Cash flow
-0.2%
Cash-on-Cash Return
6.1%
Cap rate
0.8%
Rent to Value Ratio
$495,000
9
bds
|
7
ba
|
9,999
sqft
|
built
1960
70700 Ironwood Dr, Niles, MI 49120
$-651
Cash flow
-6.9%
Cash-on-Cash Return
4.6%
Cap rate
0.6%
Rent to Value Ratio
$2,300,000
5
bds
|
5
ba
|
7,802
sqft
|
built
2022
32170 Bent Oak Trl, Niles, MI 49120
$-11,394
Cash flow
-25.8%
Cash-on-Cash Return
0.2%
Cap rate
0.1%
Rent to Value Ratio
$225,000
3
bds
|
2
ba
|
1,298
sqft
|
built
1954
807 Tomahawk Ln, Niles, MI 49120
$44
Cash flow
1.0%
Cash-on-Cash Return
6.4%
Cap rate
0.9%
Rent to Value Ratio
$259,000
4
bds
|
2
ba
|
1,668
sqft
|
built
1970
2812 Detroit Rd, Niles, MI 49120
$-327
Cash flow
-6.6%
Cash-on-Cash Return
4.6%
Cap rate
0.6%
Rent to Value Ratio
$125,000
3
bds
|
1
ba
|
912
sqft
|
built
1954
1412 Mould Ave, Niles, MI 49120
$48
Cash flow
2.0%
Cash-on-Cash Return
6.6%
Cap rate
0.9%
Rent to Value Ratio
$178,000
2
bds
|
1
ba
|
1,020
sqft
|
built
1951
2711 West St, Niles, MI 49120
$-126
Cash flow
-3.7%
Cash-on-Cash Return
5.3%
Cap rate
0.8%
Rent to Value Ratio

$690,000
5
bds
|
4
ba
|
2,900
sqft
|
built
1925
1411 Harrah Rd, Niles, MI 49120
$-874
Cash flow
-6.6%
Cash-on-Cash Return
4.6%
Cap rate
0.6%
Rent to Value Ratio
$389,000
5
bds
|
4
ba
|
3,595
sqft
|
built
1999
1238 Maplewood Dr, Niles, MI 49120
$-801
Cash flow
-10.7%
Cash-on-Cash Return
3.7%
Cap rate
0.6%
Rent to Value Ratio
$1,175,000
6
bds
|
6
ba
|
6,333
sqft
|
built
2007
33044 Lake Forest Ct, Niles, MI 49120
$-3,761
Cash flow
-16.7%
Cash-on-Cash Return
2.3%
Cap rate
0.4%
Rent to Value Ratio
$212,700
3
bds
|
1
ba
|
1,546
sqft
|
built
1971
1405 Oakdale Ave, Niles, MI 49120
$-292
Cash flow
-7.2%
Cash-on-Cash Return
4.5%
Cap rate
0.7%
Rent to Value Ratio
$575,000
4
bds
|
2
ba
|
3,058
sqft
|
built
1924
2580 Pucker St, Niles, MI 49120
$-1,030
Cash flow
-9.3%
Cash-on-Cash Return
4.0%
Cap rate
0.6%
Rent to Value Ratio

$2,440,000
6
bds
|
9
ba
|
11,304
sqft
|
built
2007
30217 Stratford Ct, Niles, MI 49120
$-9,479
Cash flow
-20.3%
Cash-on-Cash Return
1.5%
Cap rate
0.2%
Rent to Value Ratio

$499,000
4
bds
|
3
ba
|
2,881
sqft
|
built
2004
122 Churchill Ln, Niles, MI 49120
$-1,350
Cash flow
-14.1%
Cash-on-Cash Return
2.9%
Cap rate
0.5%
Rent to Value Ratio

$335,000
3
bds
|
3
ba
|
2,644
sqft
|
built
1976
2266 Thunderbird Dr, Niles, MI 49120
$-639
Cash flow
-10.0%
Cash-on-Cash Return
3.9%
Cap rate
0.5%
Rent to Value Ratio
$365,000
3
bds
|
2
ba
|
1,957
sqft
|
built
1957
3340 W Bertrand Rd, Niles, MI 49120
$-609
Cash flow
-8.7%
Cash-on-Cash Return
4.1%
Cap rate
0.5%
Rent to Value Ratio
$250,000
4
bds
|
2
ba
|
2,671
sqft
|
built
1922
1008 Oak St, Niles, MI 49120
$-151
Cash flow
-3.2%
Cash-on-Cash Return
5.4%
Cap rate
0.7%
Rent to Value Ratio
$365,000
5
bds
|
3
ba
|
3,229
sqft
|
built
1960
3610 N 5th St, Niles, MI 49120
$-603
Cash flow
-8.6%
Cash-on-Cash Return
4.2%
Cap rate
0.5%
Rent to Value Ratio
$649,900
4
bds
|
1
ba
|
1,838
sqft
|
built
1930
1169 Shady Shores Dr, Niles, MI 49120
$-2,264
Cash flow
-18.2%
Cash-on-Cash Return
2.0%
Cap rate
0.3%
Rent to Value Ratio

$150,000
3
bds
|
2
ba
|
1,605
sqft
|
built
1952
1895 Baldwin Dr, Niles, MI 49120
$255
Cash flow
8.9%
Cash-on-Cash Return
8.2%
Cap rate
1.1%
Rent to Value Ratio
$150,000
bds
|
0
ba
|
0
sqft
|
built
1930
16 S 7th St, Niles, MI 49120
$136
Cash flow
4.7%
Cash-on-Cash Return
7.2%
Cap rate
1.1%
Rent to Value Ratio
$99,000
1
bds
|
1
ba
|
520
sqft
|
built
1948
1450 Sycamore St, Niles, MI 49120
$149
Cash flow
7.9%
Cash-on-Cash Return
8.0%
Cap rate
1.0%
Rent to Value Ratio
$105,000
3
bds
|
1
ba
|
1,440
sqft
|
built
1900
317 E Bertrand Rd, Niles, MI 49120
$276
Cash flow
13.7%
Cash-on-Cash Return
9.3%
Cap rate
1.3%
Rent to Value Ratio
$427,000
4
bds
|
4
ba
|
2,618
sqft
|
built
2005
125 Churchill Ln, Niles, MI 49120
$-945
Cash flow
-11.5%
Cash-on-Cash Return
3.5%
Cap rate
0.5%
Rent to Value Ratio
$135,000
2
bds
|
1
ba
|
871
sqft
|
built
1934
1110 Howard St, Niles, MI 49120
$-58
Cash flow
-2.2%
Cash-on-Cash Return
5.6%
Cap rate
1.0%
Rent to Value Ratio
$159,900
4
bds
|
2
ba
|
1,248
sqft
|
built
1920
1023 N 7th St, Niles, MI 49120
$54
Cash flow
1.8%
Cash-on-Cash Return
6.6%
Cap rate
0.9%
Rent to Value Ratio
$74,500
4
bds
|
1
ba
|
1,779
sqft
|
built
1880
1627 N 12th St, Niles, MI 49120
$497
Cash flow
34.8%
Cash-on-Cash Return
14.2%
Cap rate
1.9%
Rent to Value Ratio

$2,999,000
6
bds
|
9
ba
|
12,319
sqft
|
built
2012
70857 Cambridge Ct, Niles, MI 49120
$-15,541
Cash flow
-27.0%
Cash-on-Cash Return
-0.1%
Cap rate
0.1%
Rent to Value Ratio

$237,900
3
bds
|
1
ba
|
1,099
sqft
|
built
1956
2262 Warren Rd, Niles, MI 49120
$-245
Cash flow
-5.4%
Cash-on-Cash Return
4.9%
Cap rate
0.7%
Rent to Value Ratio

$350,000
3
bds
|
2
ba
|
1,880
sqft
|
built
1991
1820 Ontario Rd, Niles, MI 49120
$-572
Cash flow
-8.5%
Cash-on-Cash Return
4.2%
Cap rate
0.6%
Rent to Value Ratio
$140,000
2
bds
|
1
ba
|
666
sqft
|
built
1950
1110 Mc Kee St, Niles, MI 49120
$95
Cash flow
3.5%
Cash-on-Cash Return
7.0%
Cap rate
1.0%
Rent to Value Ratio