$925,000
Investment Summary
- Monthly Cash Flow
- -$2,605
- Cap Rate
- 2.3%
- Cash-on-Cash Return
- -14.7%
- Debt Coverage Ratio
- 0.40
- Internal Rate of Return (5 years)
- -10.2%
Cash Flow
Net Operating Income (NOI) minus mortgage payments.
Calculation:
NOI - Mortgage Payments
Cap Rate (Market Value)
Capitalization Rate is a rate of return that compares the yearly Net Operating Income (NOI) to the market value.
Calculation:
NOI / Market Value
Cash-on-Cash Return (CoC)
Annual cash flow divided by initial cash invested.
Calculation:
Annual Cash Flow / Cash Invested
Debt Coverage Ratio (DCR)
Net Operating Income (NOI) divided by total debt payments.
Calculation:
NOI / Total Debt Payments
Internal Rate of Return (IRR)
A metric for assessing profitability over time. IRR is the discount rate at which the net present value (NPV) of all future cash flows (positive and negative) from an investment equals zero — including both periodic cash flow (such as rent) and a projected sale at the end of the holding period. It represents the expected annualized return, accounting for income, expenses, and the recovery of capital through a future sale.
Calculation:
(Future Value / Present Value) ** (1 / Years) - 1
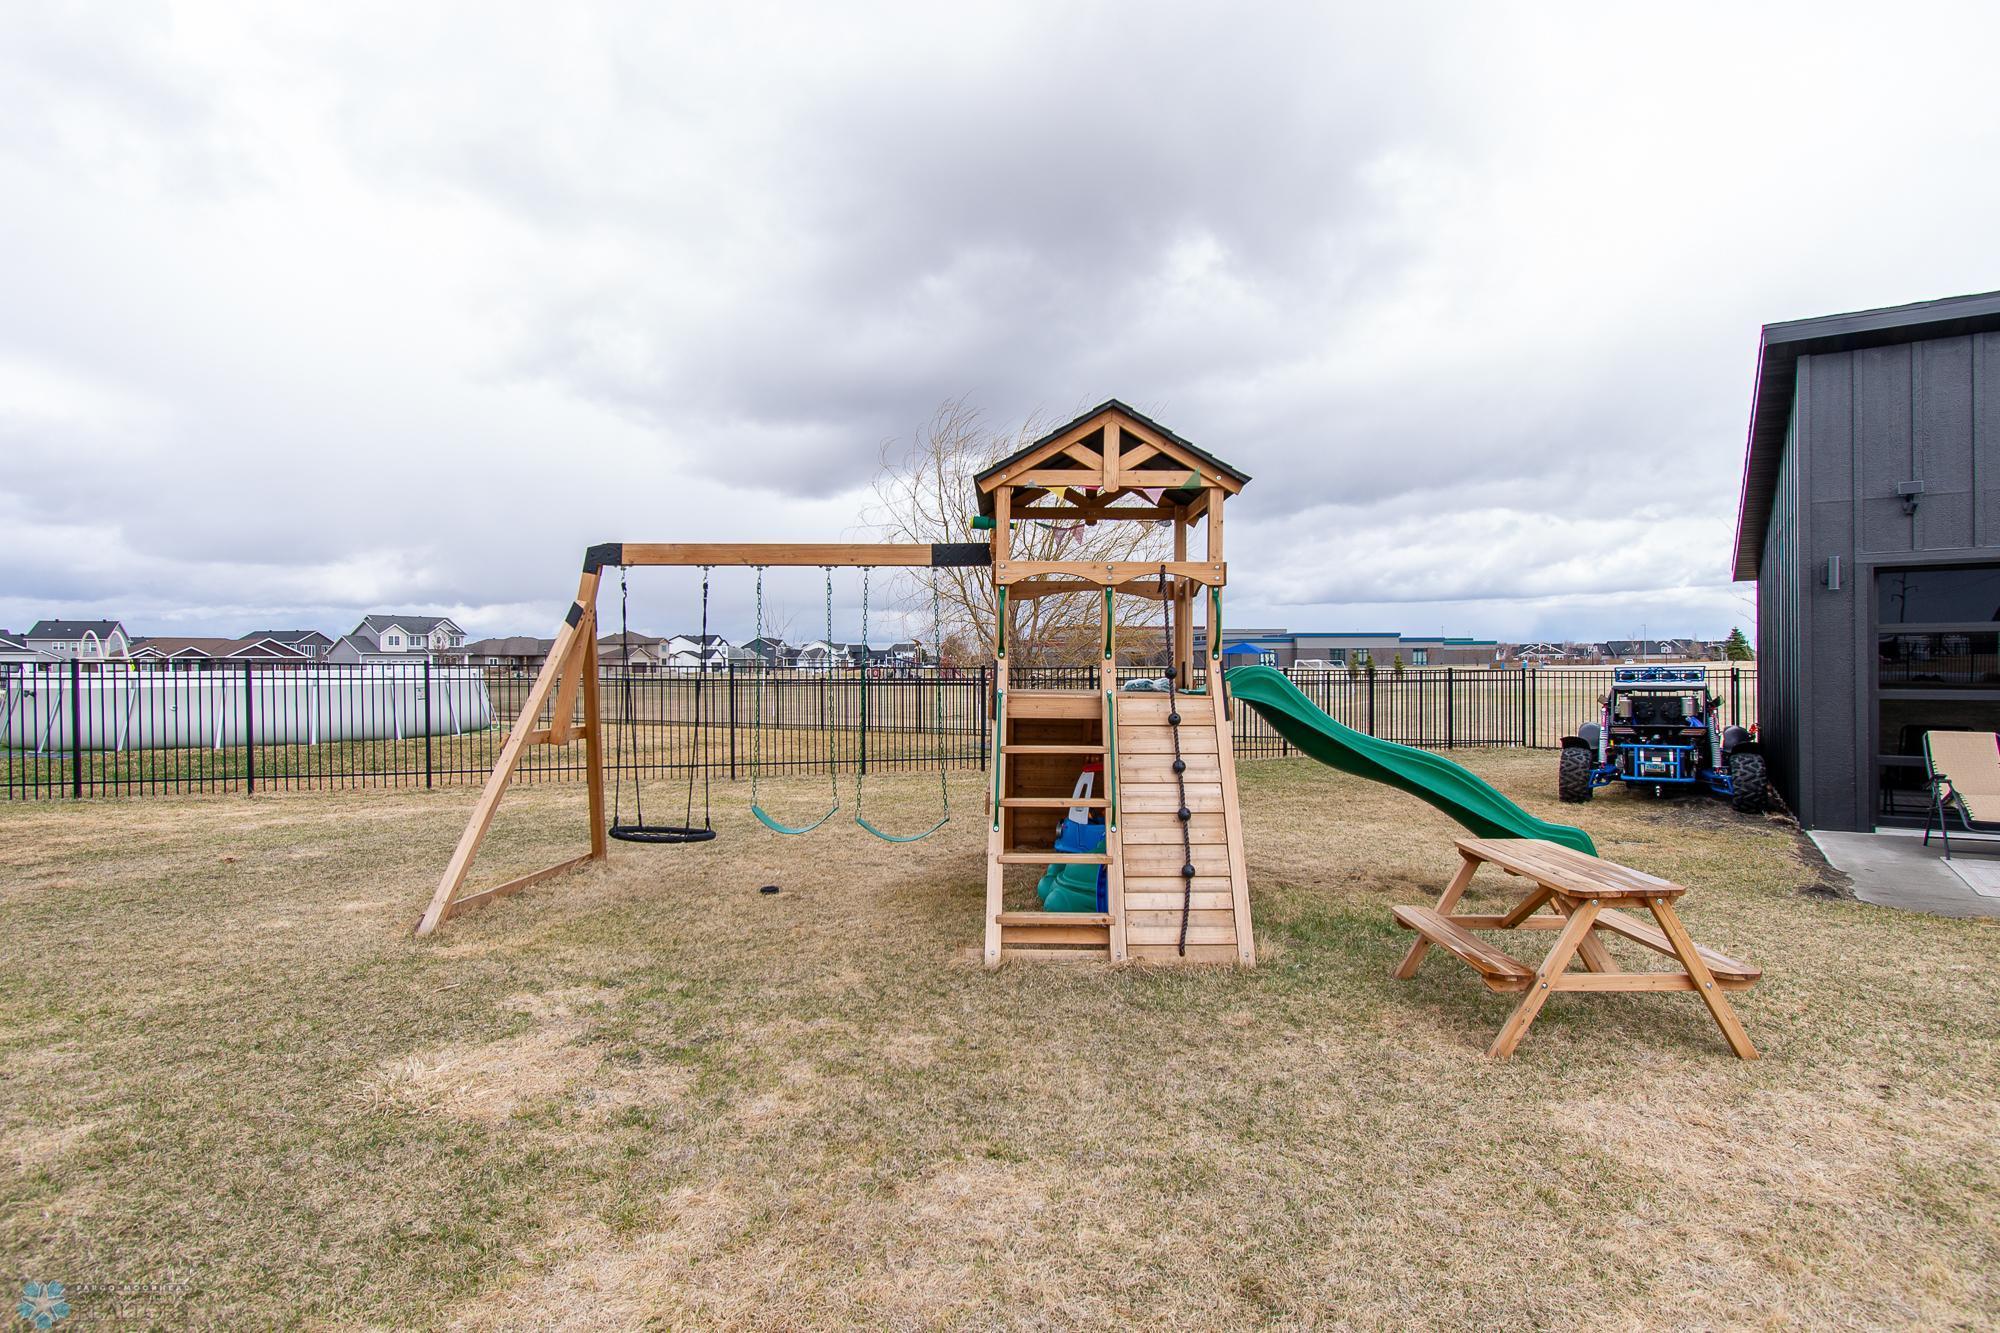
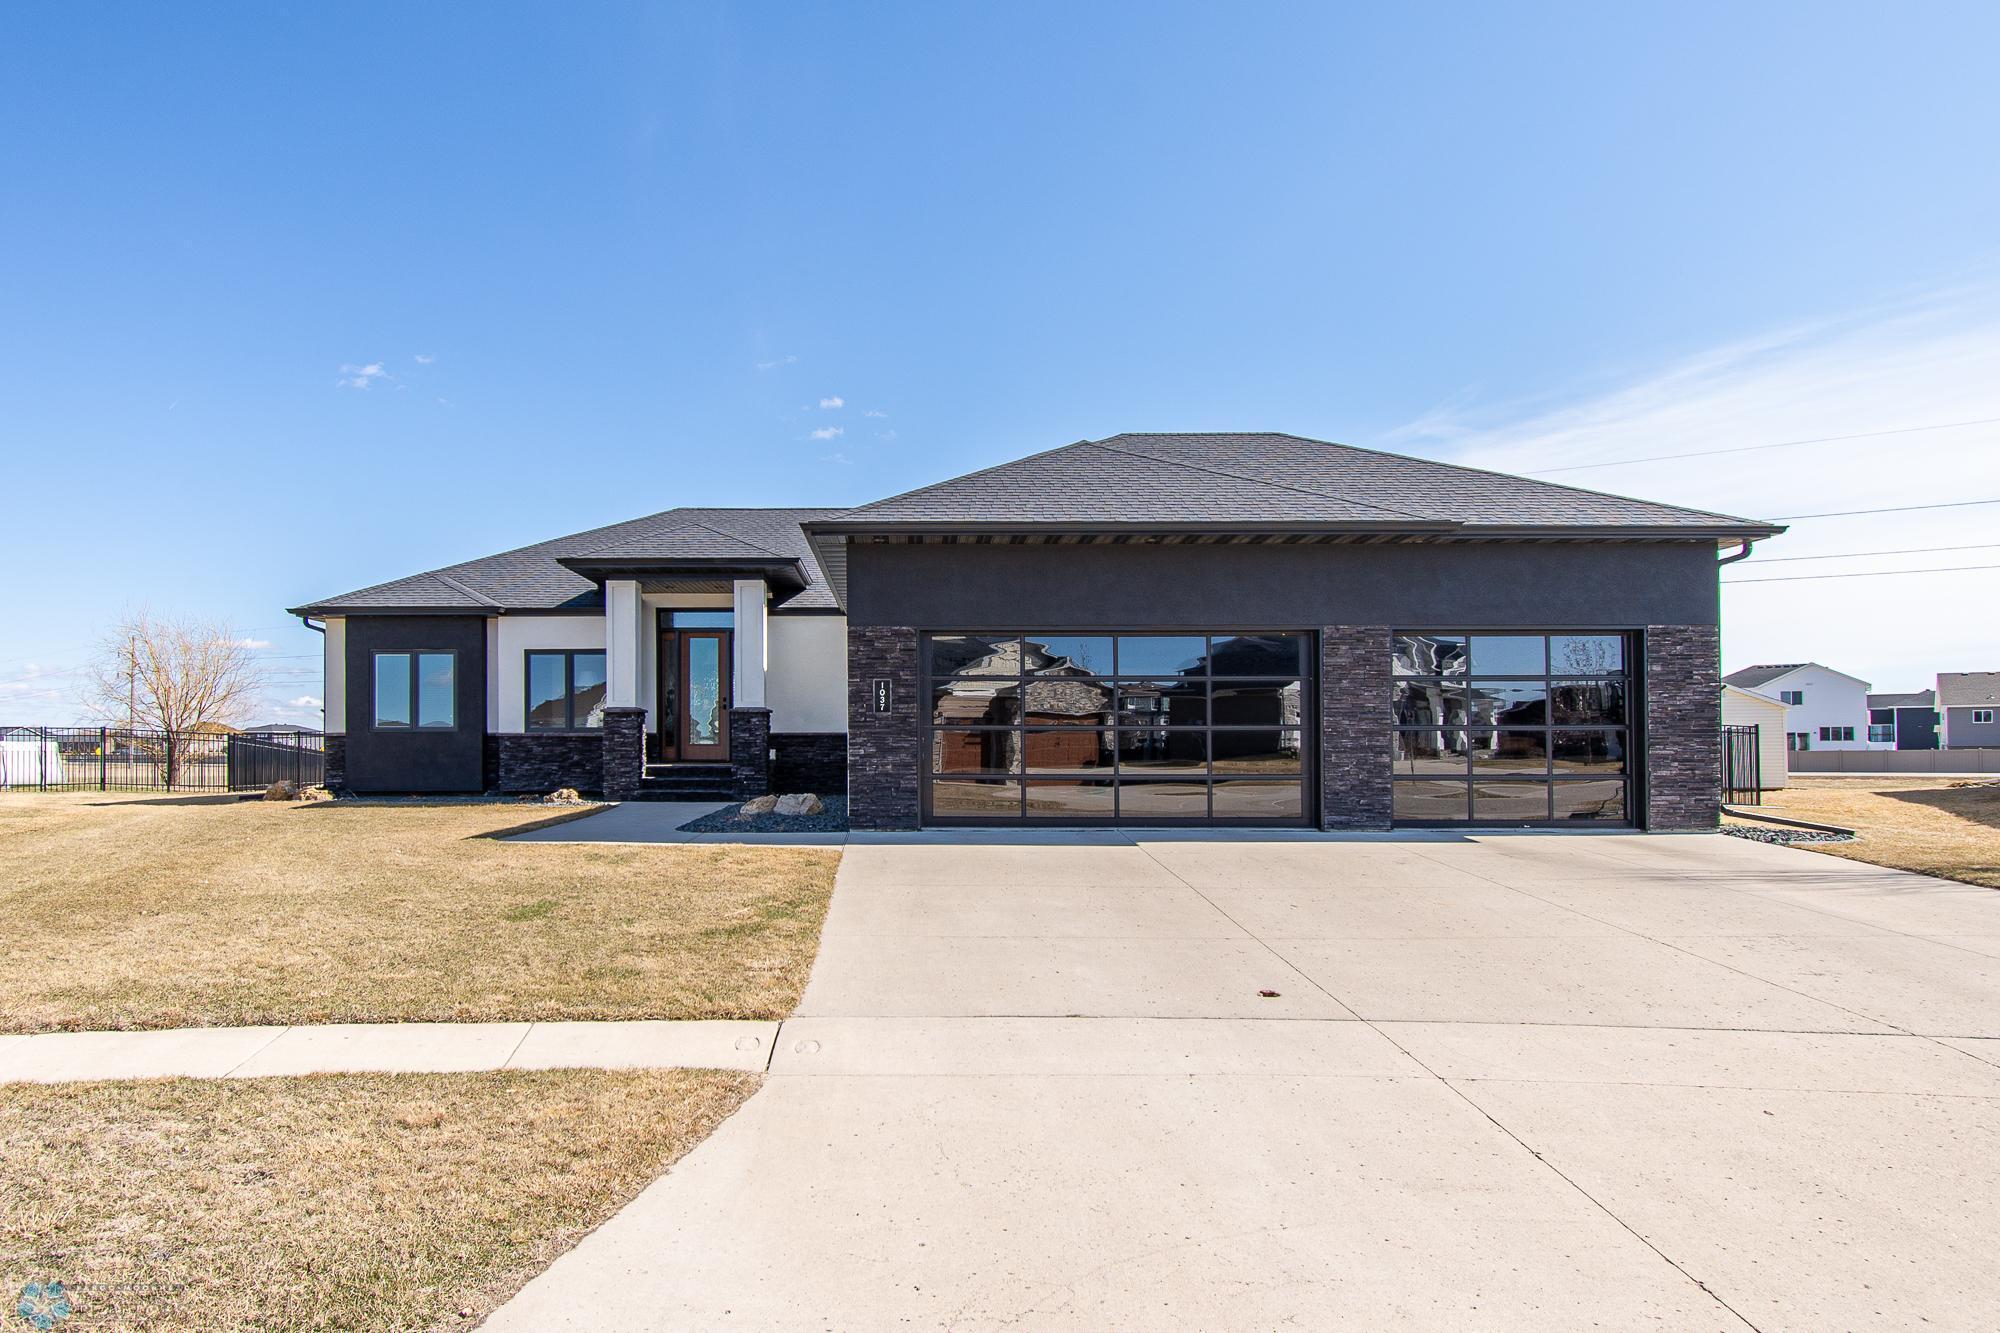
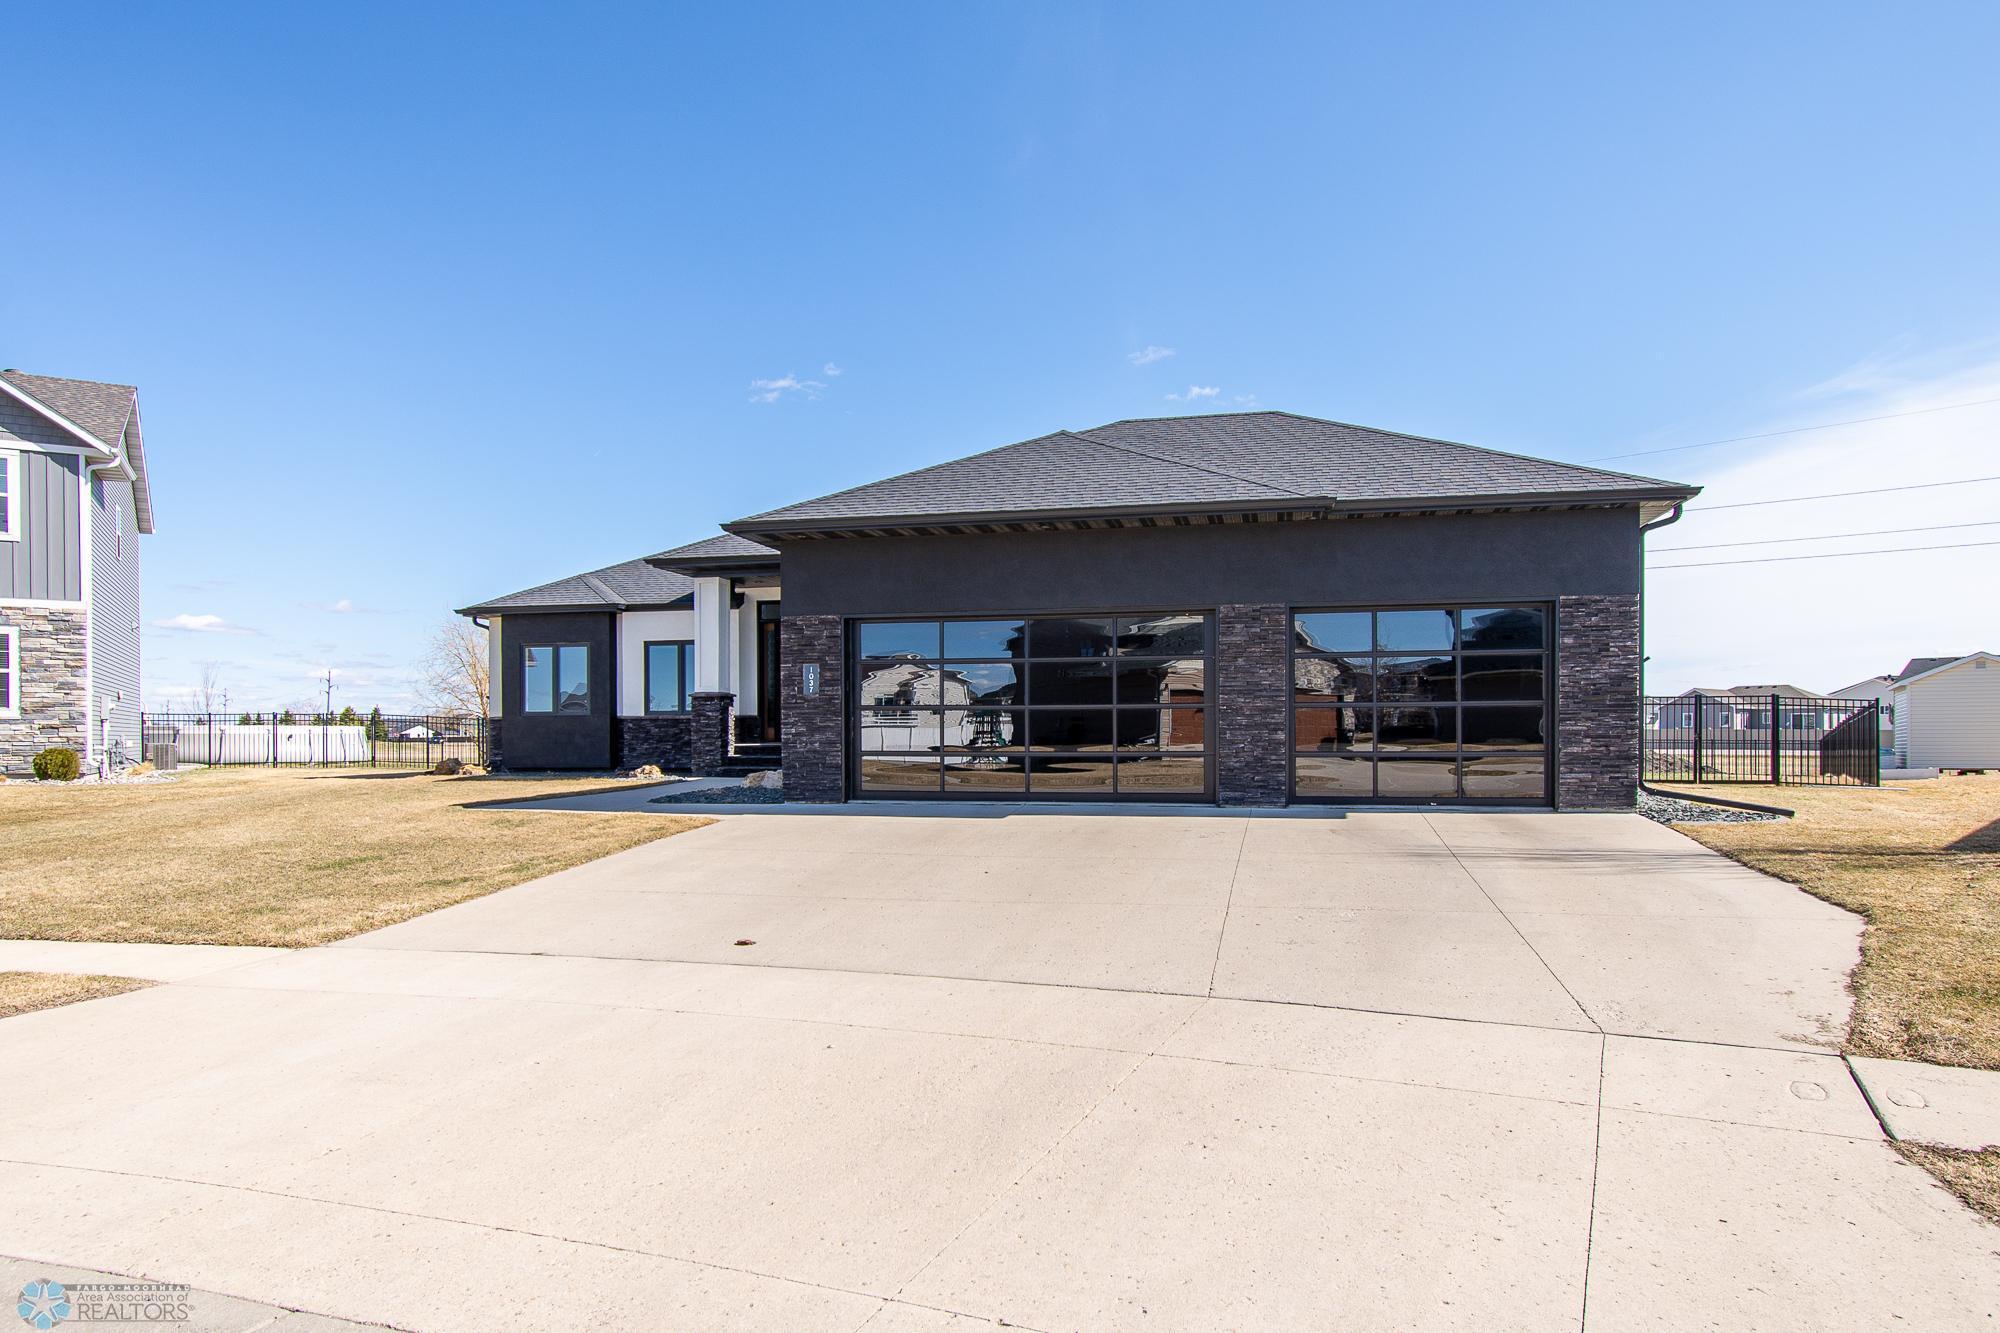
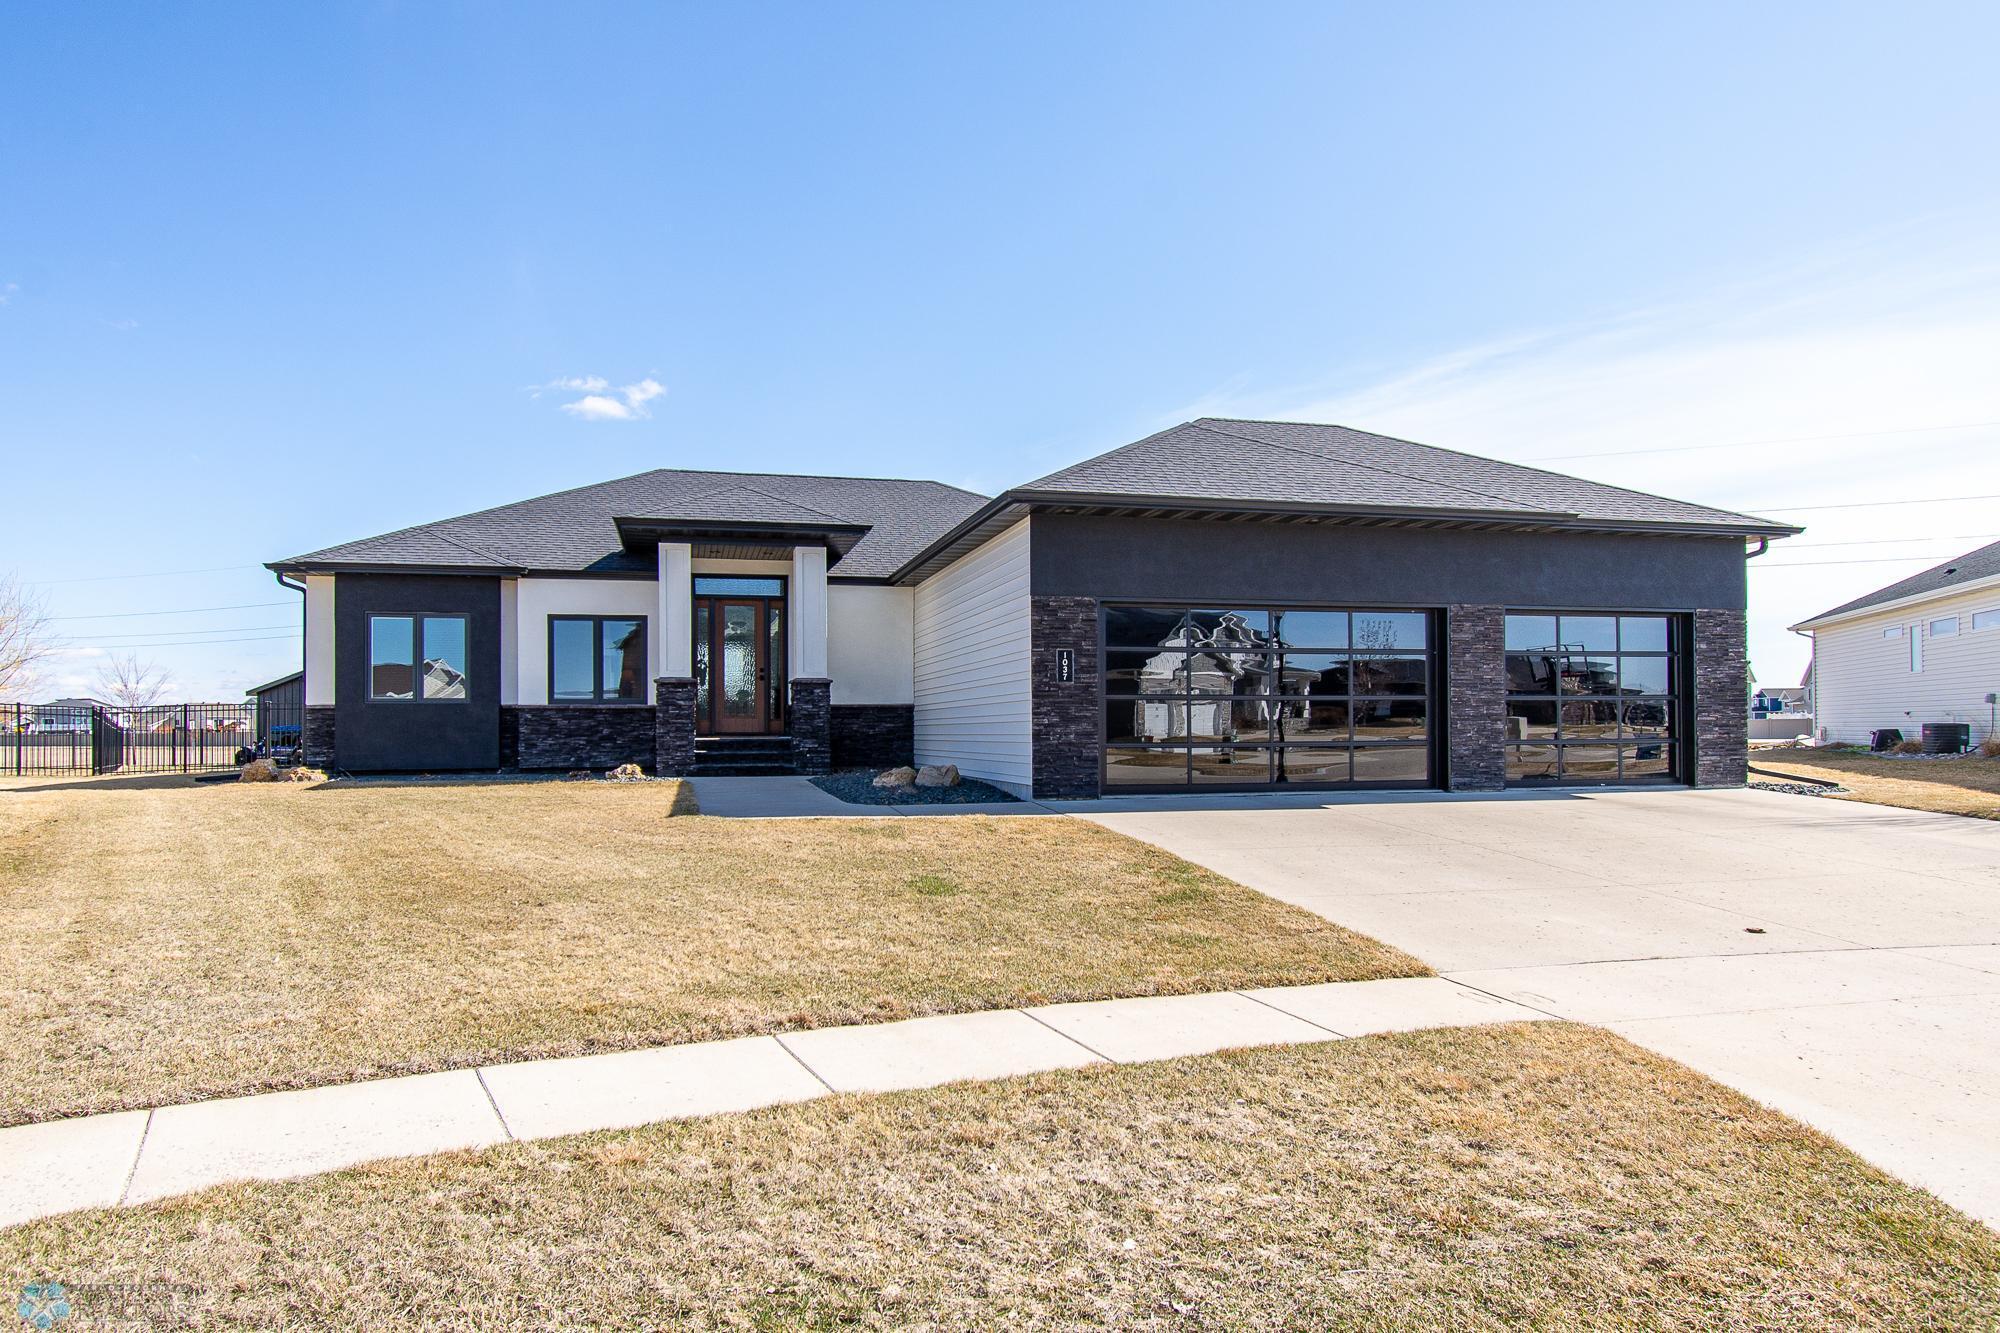
Property Description
Show stopping rambler located in The Wilds 6th subdivision of West Fargo! This stunning home includes 6 bedrooms, 3 bathrooms, 4460 sq ft of living space, a 3 car garage, over half an acre lot, and a 966 sq ft luxury outbuilding! As soon as you walk in the door, you're greeted with gorgeous wood flooring throughout the main living space, vaulted ceilings, a gourmet kitchen with gas range + double ovens, a floor to ceiling stone fireplace, and the most dreamy mudroom/drop zone you have ever seen! Some of the many custom touches throughout the home include the primary bedroom closet, new trim work, the addition of a flex room + rear entrance laundry/dog wash zone, all bedroom closets, and so much more! The basement provides another large living space with plenty of room to play as well as a wet bar for entertaining! Outside, you'll love the new maintenance free deck, huge fully fenced yard, and room to run! Let's not forget the hangout space in the outbuilding! This is the perfect place to entertain, practice your golf game, or completely make it your own! There's even a storage space for the toys! This is the one you have been looking for- schedule your showing today!
Build Your Team
Quickly find investor-friendly professionals who can help you succeed in real estate investing at any stage of the investing journey.


Agents
Match with investor-friendly agents who can help you find, analyze, and close your next deal


Lenders
Get the best funding…find investor-friendly lenders who specialize in your deal strategy


Property Managers
Transition to passive investing. Find a trusted property management partnership that lasts.


Tax Pros & Accountants
Taxes and financial reporting made easy—find experts to create tax savings strategies, file taxes, and more
Location
Property Details
Parking
- Description: Attached Garage, Floor Drain, Finished Garage, Heated Garage
- Garage Spaces: 3
- Spaces Total: 0
Bedroom Information
- # of Bedrooms: 6
Bathroom Information
- # of Baths (Full): 3
- # of Baths (Total): 3.0
Interior Features
- # of Rooms: 15
- Basement: Yes
- Basement Description: Concrete
Land Information
- Land Use: Residential
- Land Use Subtype: Single Family Residential (Assumed)
Lot Information
- Parcel ID: 02583001160000
- Lot Size: 27007 sqft
Property Information
- Property Type: Single Family Residence
- Style: (SF) Single Family
- Year Built: 2015
Tax Information
- Annual Tax: $16,001
Utilities
- Heating: Forced Air
Location
- County: Cass
Listing Details
Investment Summary
- Monthly Cash Flow
- -$2,605
- Cap Rate
- 2.3%
- Cash-on-Cash Return
- -14.7%
- Debt Coverage Ratio
- 0.40
- Internal Rate of Return (5 years)
- -10.2%
Cash Flow
Net Operating Income (NOI) minus mortgage payments.
Calculation:
NOI - Mortgage Payments
Cap Rate (Market Value)
Capitalization Rate is a rate of return that compares the yearly Net Operating Income (NOI) to the market value.
Calculation:
NOI / Market Value
Cash-on-Cash Return (CoC)
Annual cash flow divided by initial cash invested.
Calculation:
Annual Cash Flow / Cash Invested
Debt Coverage Ratio (DCR)
Net Operating Income (NOI) divided by total debt payments.
Calculation:
NOI / Total Debt Payments
Internal Rate of Return (IRR)
A metric for assessing profitability over time. IRR is the discount rate at which the net present value (NPV) of all future cash flows (positive and negative) from an investment equals zero — including both periodic cash flow (such as rent) and a projected sale at the end of the holding period. It represents the expected annualized return, accounting for income, expenses, and the recovery of capital through a future sale.
Calculation:
(Future Value / Present Value) ** (1 / Years) - 1
Purchase Details
|
The price paid for the property. Purchase price:
| $925,000 |
|---|---|
|
The amount of the purchase financed through a loan. Amount financed:
| -$740,000 |
Down paymentThe initial payment made towards the purchase. Calculation:Purchase price - Amount financed Down payment:
| $185,000 |
Closing costsFees and expenses associated with purchasing a property, typically ranging from 2% to 5% of the home’s purchase price, paid at the end of a home purchase to cover services like lending, title transfer, and taxes. Closing costs:
| $27,750 |
|
Costs incurred to repair or improve the property. Rehab costs:
| $0 |
Initial cash investedTotal initial cash invested in the property. Calculation:Down payment + Buying costs + Rehab costs Initial cash invested:
| $212,750 |
|
The total square footage (SQFT) of the property. Square feet:
| 4,355 |
|
Cost per square foot of the property. Calculation:Purchase price / Square feet Cost per square foot:
| $212 |
|
Monthly rent divided by square footage. Calculation:Monthly rent / Square feet Monthly rent per square foot:
| $1.03 |
Financing Details
Loan amountThe total sum of money borrowed from a lender to finance a property purchase. Calculation:Purchase Price - Down Payment
Loan amount:
| $740,000 |
|---|---|
Loan to Value Ratio (LTV)Loan amount divided by the market value of the property. Calculation:Loan Amount / Market Value
Loan to value ratio:
| 80.0% |
Loan typeThe type of loan (e.g., fixed, adjustable).
Loan type:
| Amortizing |
TermThe loan repayment period in years.
Term:
| 30 years |
Interest RateThe percentage a lender charges on the borrowed amount of a loan, determining the cost of borrowing money.
Interest rate:
| 5.875% |
Principle & Interest (PI)The principle is the portion of the loan payment that reduces the loan balance. The interest is the lender's charge for borrowing money.
Principle & interest:
| $4,377 |
Property TaxesAnnual taxes levied by local governments on real estate properties. These taxes fund public services like schools, roads, and emergency services. Calculation:Assumes 12% of gross rental income, unless public tax records are available.
Property tax:
| $1,333 |
InsuranceThe costs for insurance coverage to protect against financial losses due to risks like fire, natural disasters, theft, liability, or tenant-related damages. Calculation:Assumes 7% of gross rental income, unless insurance rates are specified.
Insurance:
| $315 |
Private Mortgage Insurance (PMI)A fee that borrowers pay when they take out a conventional loan with a loan-to-value (LTV) ratio above 80%.
Private mortgage insurance (PMI):
| $0 |
|
The fixed amount a borrower pays each month to repay a loan. It typically includes principal and interest (P&I) and may also cover property taxes, insurance, HOA fees, and PMI if escrowed. Monthly payment:
| $6,025 |
Operating Income
| % Rent | Monthly | Yearly | |
|---|---|---|---|
Gross RentThe total rental income received from tenants before deducting any expenses. Includes base rent, late fees, pet fees, parking fees, and other recurring charges.
Gross rent:
| $4,500 | $54,000 | |
Vacancy LossExpected loss of rent due to vacancies.
Vacancy loss:
(6%)
| 6% | -$270 | -$3,240 |
Operating IncomeGross rental income minus vacancy loss. Calculation:Gross rent - Vacancy loss
Operating income:
| $4,230 | $50,760 |
Operating Expenses
| % Rent | Monthly | Yearly | |
|---|---|---|---|
Property TaxesAnnual taxes levied by local governments on real estate properties. These taxes fund public services like schools, roads, and emergency services. Calculation:Assumes 12% of gross rental income, unless public tax records are available. | 30% | -$1,333 | -$16,001 |
InsuranceThe costs for insurance coverage to protect against financial losses due to risks like fire, natural disasters, theft, liability, or tenant-related damages. Calculation:Assumes 7% of gross rental income, unless insurance rates are specified. | 7% | -$315 | -$3,780 |
Property ManagementThe costs associated with hiring a property manager to handle the day-to-day operations of a rental property. Includes management fees, leasing fes, eviction fees, etc. Calculation:Assumes 8% of gross rental income. | 8% | -$360 | -$4,320 |
Repairs & MaintenanceOngoing costs for routine upkeep and minor fixes needed to keep a property in good working condition. Calculation:Assumes 5% of gross rental income. Varies by property age and condition. | 5% | -$225 | -$2,700 |
Capital ExpensesLarge, infrequent costs for major improvements or replacements, like a new roof, HVAC system, or appliances. Calculation:Assumes 5% of gross rental income. Varies by property age. | 5% | -$225 | -$2,700 |
HOA FeesRegular dues paid to a Homeowners Association for community maintenance, amenities, and management. Similar fees include: Condo Association Fees, Co-op Maintenance Fees, etc. Calculation:Assumes 0% gross rental income, unless specified.. | 0% | $0 | $0 |
Operating ExpensesRecurring costs required to maintain and manage a rental property, including property taxes, insurance, maintenance, repairs, utilities (if paid by the owner), property management fees, and other day-to-day expenses. Calculation:Insurance + Property Taxes + Property Management + Repairs & Maintenance + Capital Expenditures + HOA Fees | 55% | -$2,458 | -$29,501 |
Cash Flow
| Monthly | Yearly | |
|---|---|---|
Net Operating Income (NOI)The income generated from a property after deducting all operating expenses but before deducting mortgage payments, taxes, and capital expenditures. Calculation:Gross Operating Income - Operating Expenses
Net operating income:
| $1,772 | $21,264 |
Mortgage PaymentThe fixed amount a borrower pays each month to repay a loan. It typically includes principal and interest (P&I) and may also cover property taxes, insurance, HOA fees, and PMI if escrowed. | -$4,377 | -$52,524 |
Cash FlowNet Operating Income (NOI) minus mortgage payments. Calculation:NOI - Mortgage Payments | $2,605 | $31,260 |