Jefferson County Investment Properties for Sale
Browse homes for sale and investment properties in Jefferson County. Refine your search by price, property type, or more.
Best cash flowing properties in Jefferson County
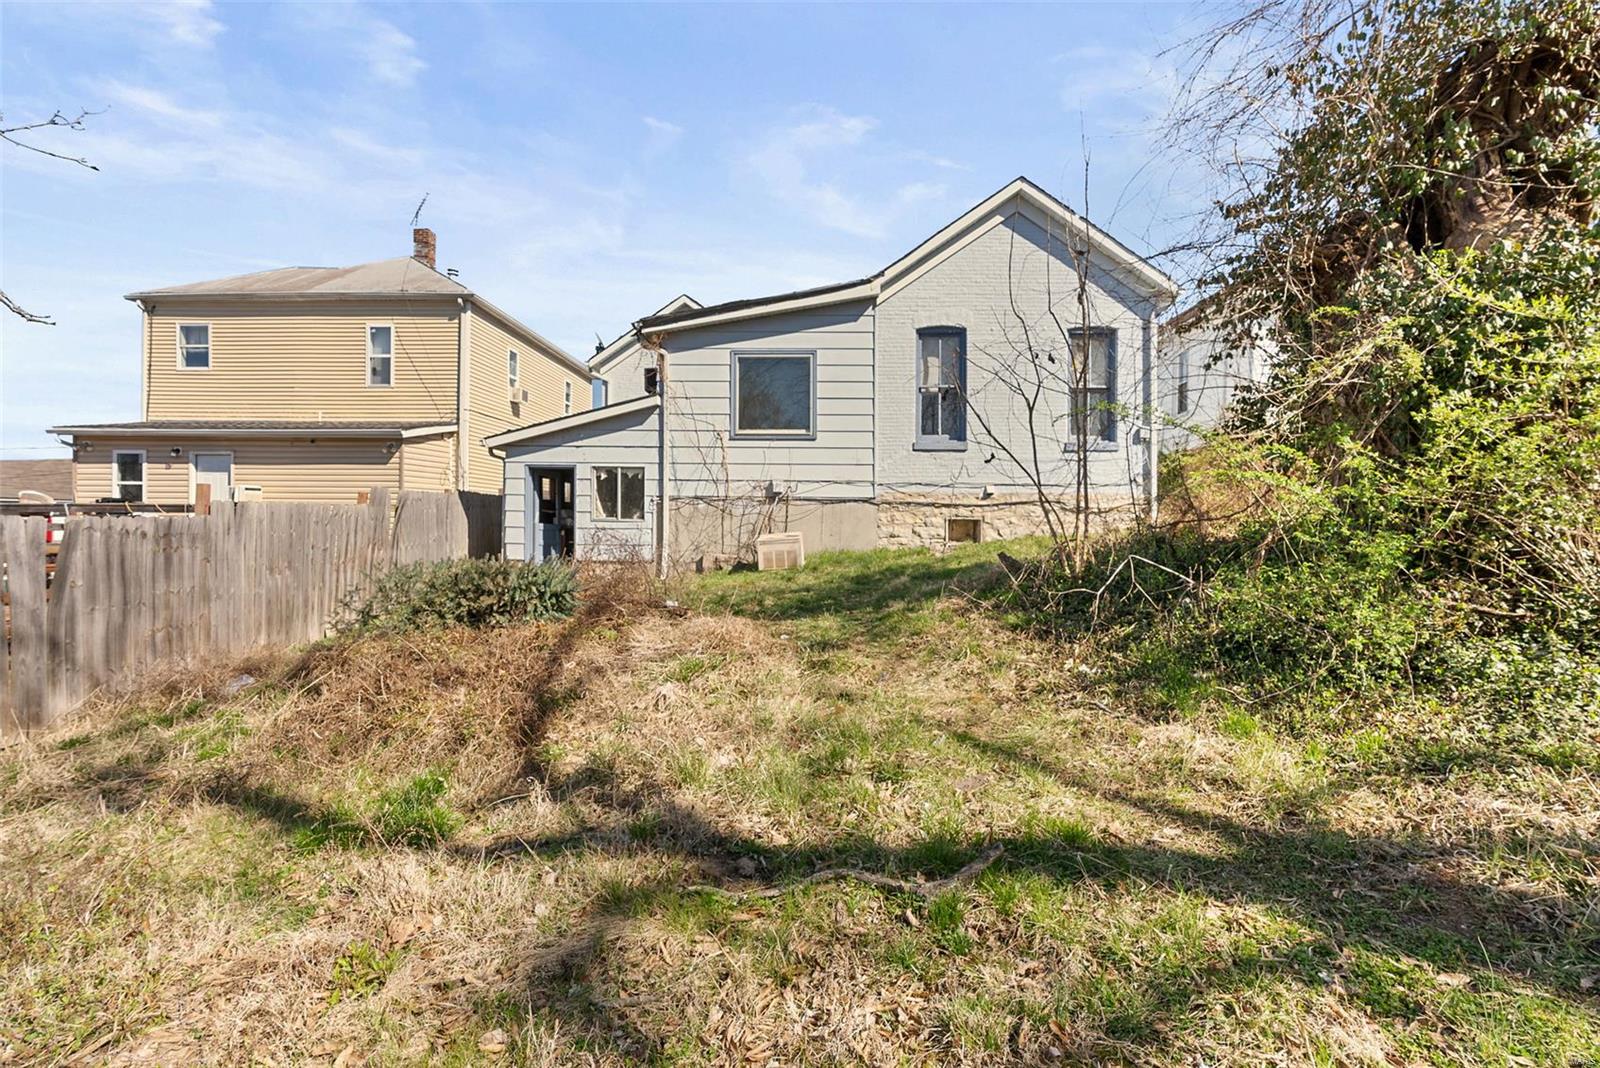
$89,900
3
bds
|
1
ba
|
1,430
sqft
|
built
1921
104 N 4th St, De Soto, MO 63020
$498
Cash flow
28.9%
Cash-on-Cash Return
12.9%
Cap rate
1.7%
Rent to Value Ratio
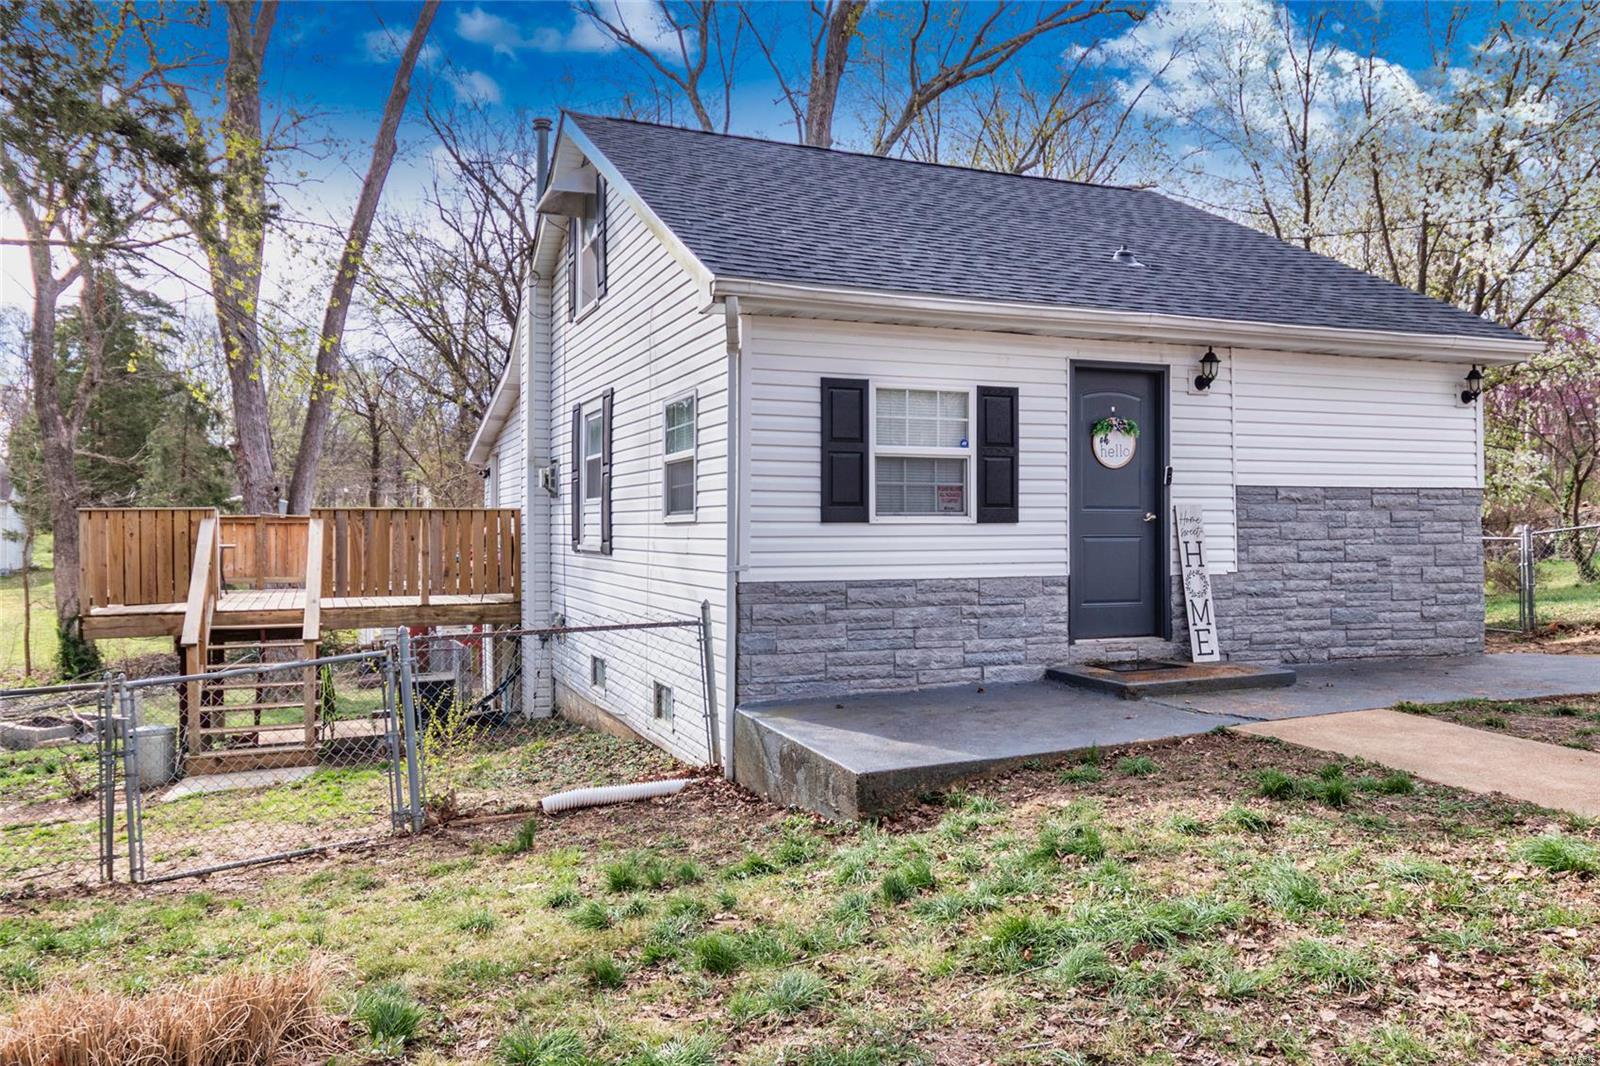
$129,900
3
bds
|
1
ba
|
1,472
sqft
|
built
1935
4386 Cottage Grove Rd, House Springs, MO 63051
$82
Cash flow
3.3%
Cash-on-Cash Return
7.0%
Cap rate
0.9%
Rent to Value Ratio
40 out of 153 properties for sale in Jefferson County
Limited Results Shown
Create a free account, or log in to reveal all property listings and enjoy the complete experience.
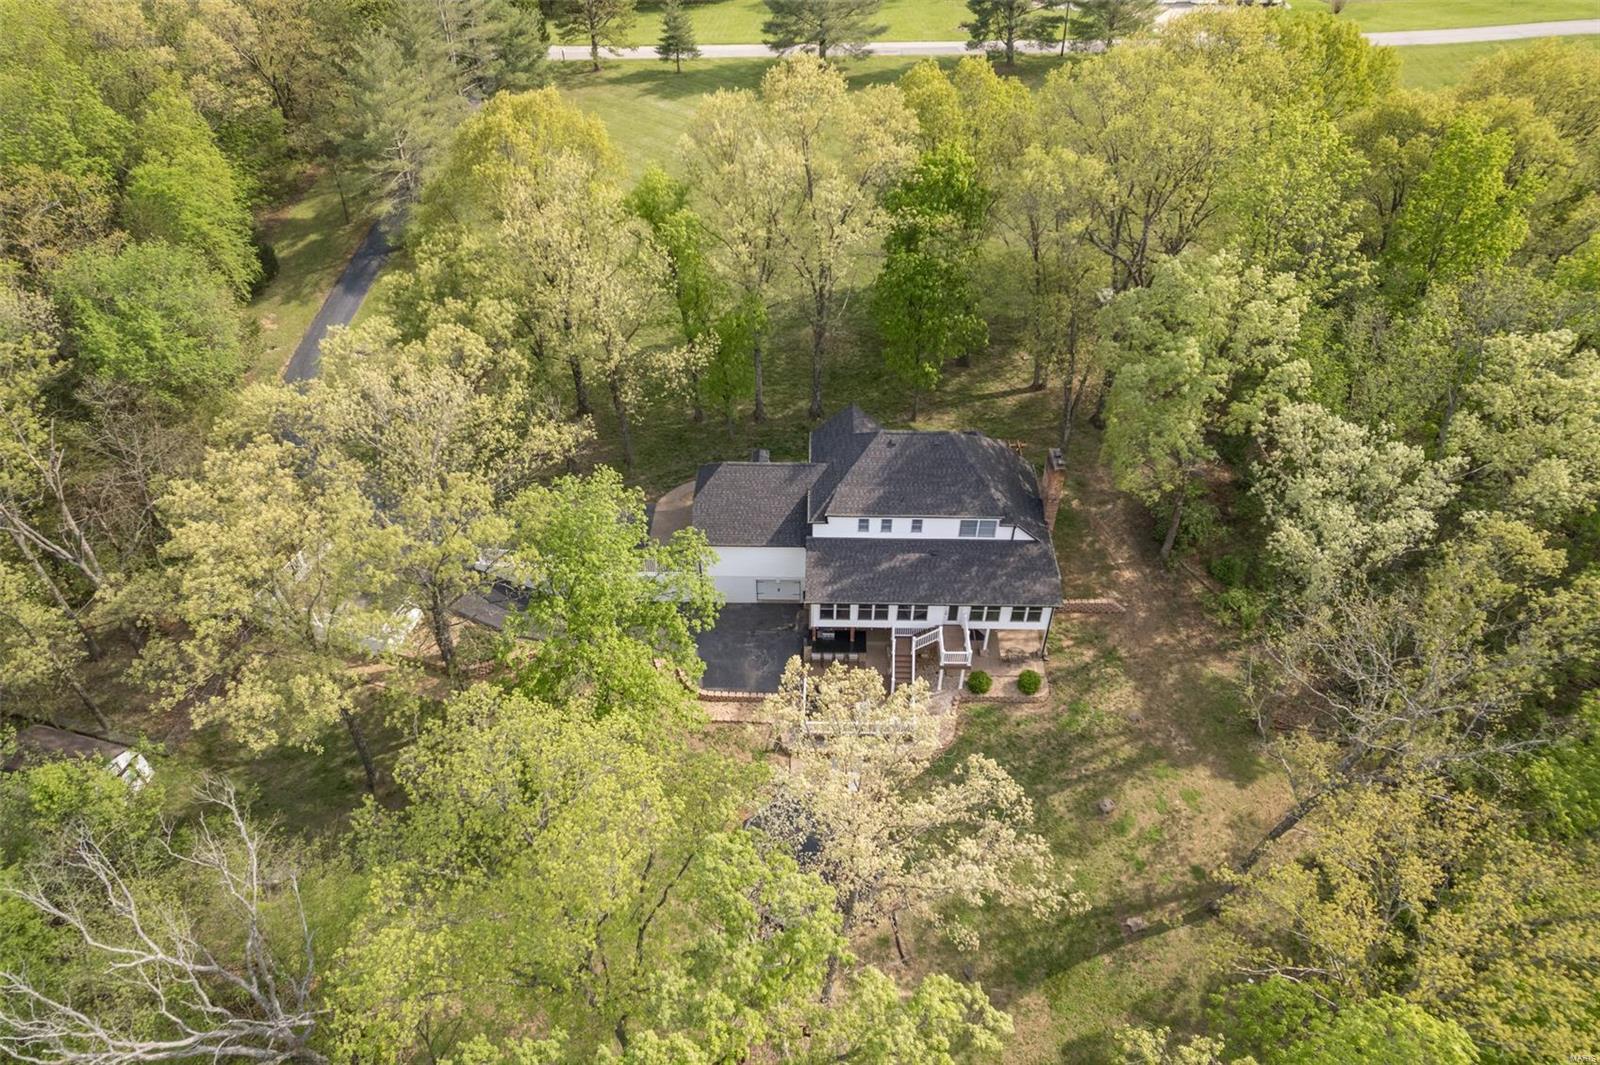
$699,900
5
bds
|
4
ba
|
3,756
sqft
|
built
1982
2179 Rock N Horse Farms Dr, Festus, MO 63028
$-1,728
Cash flow
-12.9%
Cash-on-Cash Return
3.3%
Cap rate
0.4%
Rent to Value Ratio

$550,000
3
bds
|
4
ba
|
2,000
sqft
|
built
1960
2529 Sunnyside Rd, Festus, MO 63028
$-1,923
Cash flow
-18.2%
Cash-on-Cash Return
2.1%
Cap rate
0.3%
Rent to Value Ratio

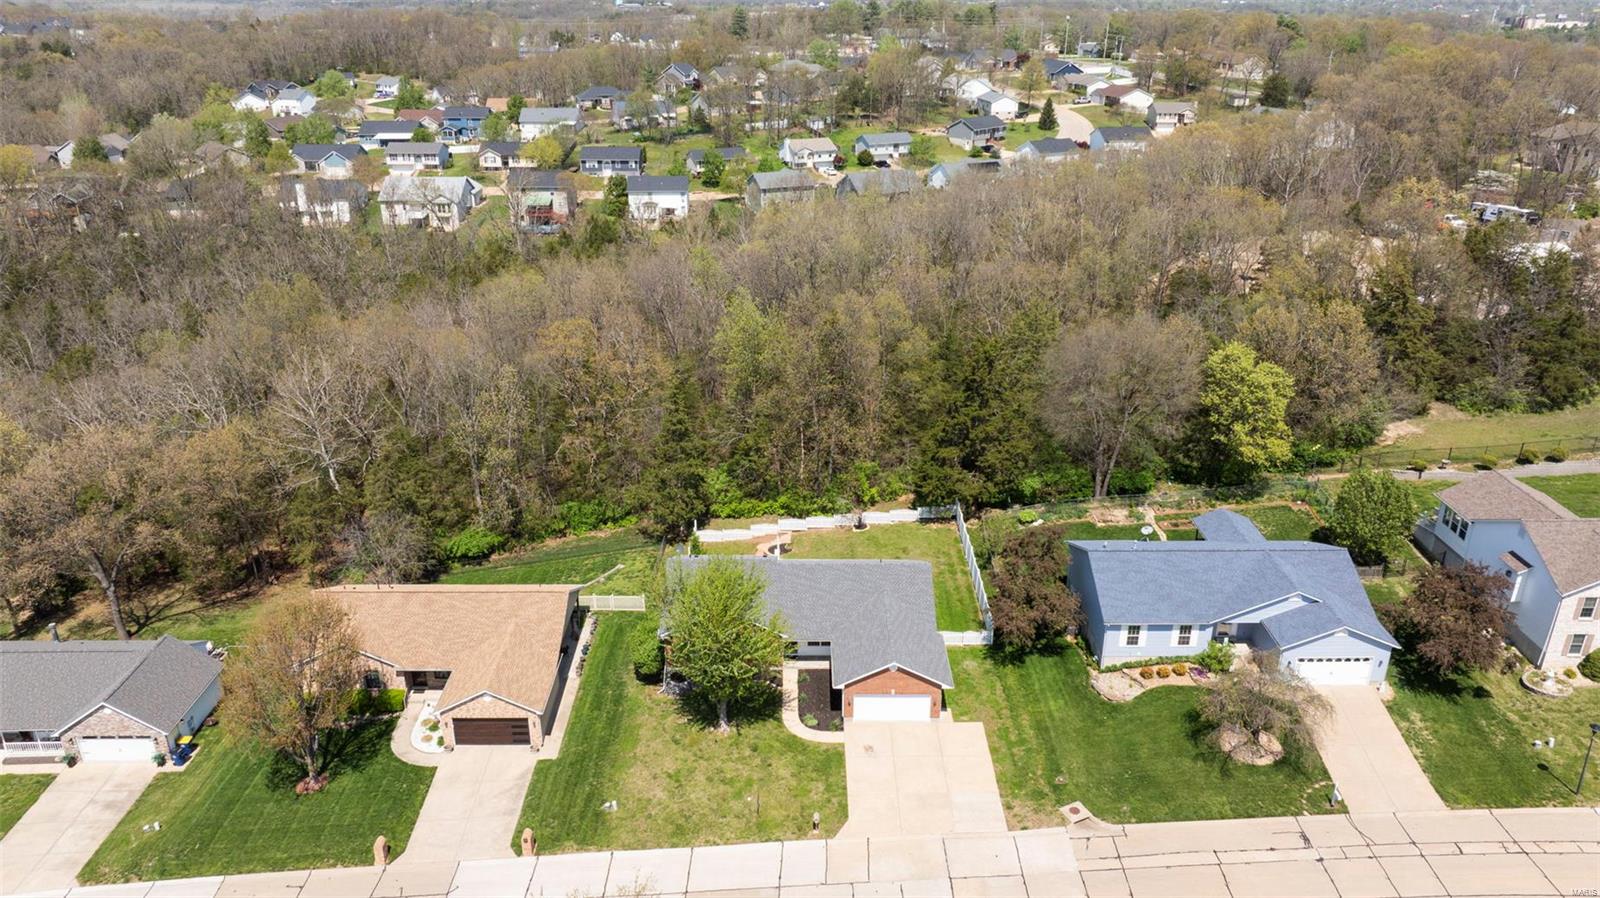
$255,000
3
bds
|
2
ba
|
1,548
sqft
|
built
1969
1713 Westwood Dr, Festus, MO 63028
$-441
Cash flow
-9.0%
Cash-on-Cash Return
4.2%
Cap rate
0.5%
Rent to Value Ratio
$425,000
5
bds
|
3
ba
|
2,744
sqft
|
built
1997
35 Ashford Pl, Festus, MO 63028
$-1,160
Cash flow
-14.2%
Cash-on-Cash Return
3.0%
Cap rate
0.4%
Rent to Value Ratio

$279,000
4
bds
|
2
ba
|
1,778
sqft
|
built
1981
3687 E Lakeview Dr, House Springs, MO 63051
$-731
Cash flow
-13.7%
Cash-on-Cash Return
3.1%
Cap rate
0.5%
Rent to Value Ratio
$174,900
3
bds
|
2
ba
|
1,120
sqft
|
built
1988
5904 Kneff Rd, Imperial, MO 63052
$26
Cash flow
0.8%
Cash-on-Cash Return
6.4%
Cap rate
0.8%
Rent to Value Ratio
$349,900
3
bds
|
2
ba
|
1,550
sqft
|
built
2004
9787 Cedar Dr, Hillsboro, MO 63050
$-775
Cash flow
-11.6%
Cash-on-Cash Return
3.6%
Cap rate
0.5%
Rent to Value Ratio

$364,900
4
bds
|
3
ba
|
2,524
sqft
|
built
2001
1168 Oak Hollow Dr, Imperial, MO 63052
$-448
Cash flow
-6.4%
Cash-on-Cash Return
4.8%
Cap rate
0.7%
Rent to Value Ratio

$299,900
3
bds
|
3
ba
|
1,378
sqft
|
built
2019
2308 Windswept Farms Dr, Eureka, MO 63025
$-303
Cash flow
-5.3%
Cash-on-Cash Return
5.1%
Cap rate
0.8%
Rent to Value Ratio
$695,000
5
bds
|
4
ba
|
4,136
sqft
|
built
2004
101 Brighton Pl, Festus, MO 63028
$-2,098
Cash flow
-15.7%
Cash-on-Cash Return
2.6%
Cap rate
0.4%
Rent to Value Ratio
$915,000
5
bds
|
5
ba
|
4,162
sqft
|
built
1993
2634 Sunrise Dr, Eureka, MO 63025
$-3,340
Cash flow
-19.0%
Cash-on-Cash Return
1.9%
Cap rate
0.3%
Rent to Value Ratio
$430,000
5
bds
|
4
ba
|
3,500
sqft
|
built
2004
213 Scenic Hills Dr, De Soto, MO 63020
$-799
Cash flow
-9.7%
Cash-on-Cash Return
4.0%
Cap rate
0.6%
Rent to Value Ratio

$650,000
4
bds
|
2
ba
|
2,797
sqft
|
built
1997
9473 E Vista Dr, Hillsboro, MO 63050
$-2,051
Cash flow
-16.5%
Cash-on-Cash Return
2.5%
Cap rate
0.4%
Rent to Value Ratio
$479,000
3
bds
|
3
ba
|
1,588
sqft
|
built
1997
6110 Courtney Way, Imperial, MO 63052
$-1,575
Cash flow
-17.2%
Cash-on-Cash Return
2.3%
Cap rate
0.4%
Rent to Value Ratio

$389,000
3
bds
|
2
ba
|
1,841
sqft
|
built
2024
426 Easy St, De Soto, MO 63020
$-1,156
Cash flow
-15.5%
Cash-on-Cash Return
2.7%
Cap rate
0.4%
Rent to Value Ratio
$460,000
4
bds
|
3
ba
|
1,450
sqft
|
built
2004
12789 Carla Ln, Festus, MO 63028
$-1,219
Cash flow
-13.8%
Cash-on-Cash Return
3.1%
Cap rate
0.4%
Rent to Value Ratio
$449,500
4
bds
|
3
ba
|
2,700
sqft
|
built
2022
1869 Sunset Rdg, Festus, MO 63028
$-1,307
Cash flow
-15.2%
Cash-on-Cash Return
2.8%
Cap rate
0.4%
Rent to Value Ratio

$450,000
2
bds
|
2
ba
|
1,556
sqft
|
built
1995
1035 S Lakeview Dr, De Soto, MO 63020
$-1,385
Cash flow
-16.1%
Cash-on-Cash Return
2.6%
Cap rate
0.4%
Rent to Value Ratio

$449,900
4
bds
|
3
ba
|
2,712
sqft
|
built
2020
1818 Sunset Rdg, Festus, MO 63028
$-794
Cash flow
-9.2%
Cash-on-Cash Return
4.1%
Cap rate
0.6%
Rent to Value Ratio

$489,900
4
bds
|
3
ba
|
2,572
sqft
|
built
1994
3250 Equestrian Dr, Festus, MO 63028
$-1,827
Cash flow
-19.5%
Cash-on-Cash Return
1.8%
Cap rate
0.3%
Rent to Value Ratio

$405,000
4
bds
|
2
ba
|
3,862
sqft
|
built
2008
209 Hartland Ct, Hillsboro, MO 63050
$-780
Cash flow
-10.0%
Cash-on-Cash Return
4.0%
Cap rate
0.6%
Rent to Value Ratio

$399,900
3
bds
|
4
ba
|
3,086
sqft
|
built
2003
12 Sumter Dr, Hillsboro, MO 63050
$-922
Cash flow
-12.0%
Cash-on-Cash Return
3.5%
Cap rate
0.5%
Rent to Value Ratio

$539,500
3
bds
|
4
ba
|
2,900
sqft
|
built
2005
4545 Liberty Ridge Rd, De Soto, MO 63020
$-1,503
Cash flow
-14.5%
Cash-on-Cash Return
2.9%
Cap rate
0.4%
Rent to Value Ratio
$435,000
6
bds
|
3
ba
|
3,164
sqft
|
built
1997
9818 Ridgecrest Dr, Hillsboro, MO 63050
$-755
Cash flow
-9.1%
Cash-on-Cash Return
4.2%
Cap rate
0.6%
Rent to Value Ratio

$575,000
3
bds
|
4
ba
|
3,200
sqft
|
built
1991
2122 Plattin Rd, Festus, MO 63028
$-1,826
Cash flow
-16.6%
Cash-on-Cash Return
2.5%
Cap rate
0.3%
Rent to Value Ratio
$289,900
3
bds
|
2
ba
|
1,144
sqft
|
built
1982
156 Hinrichs Ln, Arnold, MO 63010
$-488
Cash flow
-8.8%
Cash-on-Cash Return
4.2%
Cap rate
0.6%
Rent to Value Ratio
$529,900
4
bds
|
3
ba
|
2,702
sqft
|
built
1999
205 Sandstone Ct, Festus, MO 63028
$-1,519
Cash flow
-15.0%
Cash-on-Cash Return
2.8%
Cap rate
0.4%
Rent to Value Ratio

$332,000
3
bds
|
2
ba
|
1,273
sqft
|
built
2009
1300 Woodside Dr, Arnold, MO 63010
$-744
Cash flow
-11.7%
Cash-on-Cash Return
3.6%
Cap rate
0.5%
Rent to Value Ratio
$950,000
6
bds
|
6
ba
|
4,508
sqft
|
built
1963
7614 Lakemont Dr, Hillsboro, MO 63050
$-2,400
Cash flow
-13.2%
Cash-on-Cash Return
3.2%
Cap rate
0.5%
Rent to Value Ratio
$425,000
5
bds
|
4
ba
|
2,522
sqft
|
built
1977
31 Juniper Ter, Pacific, MO 63069
$-1,131
Cash flow
-13.9%
Cash-on-Cash Return
3.1%
Cap rate
0.5%
Rent to Value Ratio
$749,900
3
bds
|
3
ba
|
2,638
sqft
|
built
2014
912 Wellington Rdg, Festus, MO 63028
$-2,894
Cash flow
-20.1%
Cash-on-Cash Return
1.6%
Cap rate
0.3%
Rent to Value Ratio

$263,000
3
bds
|
2
ba
|
1,827
sqft
|
built
1955
5629 Center Dr, Imperial, MO 63052
$-85
Cash flow
-1.7%
Cash-on-Cash Return
5.9%
Cap rate
0.8%
Rent to Value Ratio
$89,900
3
bds
|
1
ba
|
1,430
sqft
|
built
1921
104 N 4th St, De Soto, MO 63020
$498
Cash flow
28.9%
Cash-on-Cash Return
12.9%
Cap rate
1.7%
Rent to Value Ratio

$925,000
4
bds
|
3
ba
|
2,961
sqft
|
built
2014
9882 W Vista Dr, Hillsboro, MO 63050
$-2,138
Cash flow
-12.1%
Cash-on-Cash Return
3.5%
Cap rate
0.5%
Rent to Value Ratio
$449,000
4
bds
|
3
ba
|
2,012
sqft
|
built
1988
5796 Forest Dr, Hillsboro, MO 63050
$-1,194
Cash flow
-13.9%
Cash-on-Cash Return
3.1%
Cap rate
0.4%
Rent to Value Ratio
$129,900
3
bds
|
1
ba
|
1,472
sqft
|
built
1935
4386 Cottage Grove Rd, House Springs, MO 63051
$82
Cash flow
3.3%
Cash-on-Cash Return
7.0%
Cap rate
0.9%
Rent to Value Ratio

$475,000
3
bds
|
4
ba
|
3,991
sqft
|
built
2003
4 Kimberwicke Ct, Festus, MO 63028
$-1,214
Cash flow
-13.3%
Cash-on-Cash Return
3.2%
Cap rate
0.5%
Rent to Value Ratio
$280,000
3
bds
|
2
ba
|
2,335
sqft
|
built
1948
111 N 9th St, Festus, MO 63028
$-339
Cash flow
-6.3%
Cash-on-Cash Return
4.8%
Cap rate
0.6%
Rent to Value Ratio
$349,900
3
bds
|
2
ba
|
1,185
sqft
|
built
1968
6155 Fern Dr, Imperial, MO 63052
$-720
Cash flow
-10.7%
Cash-on-Cash Return
3.8%
Cap rate
0.5%
Rent to Value Ratio

$439,000
3
bds
|
2
ba
|
1,536
sqft
|
built
1960
65 E Lakewood Dr, Fenton, MO 63026
$-1,079
Cash flow
-12.8%
Cash-on-Cash Return
3.3%
Cap rate
0.5%
Rent to Value Ratio