Kent County Investment Properties for Sale
Browse homes for sale and investment properties in Kent County. Refine your search by price, property type, or more.
Best cash flowing properties in Kent County
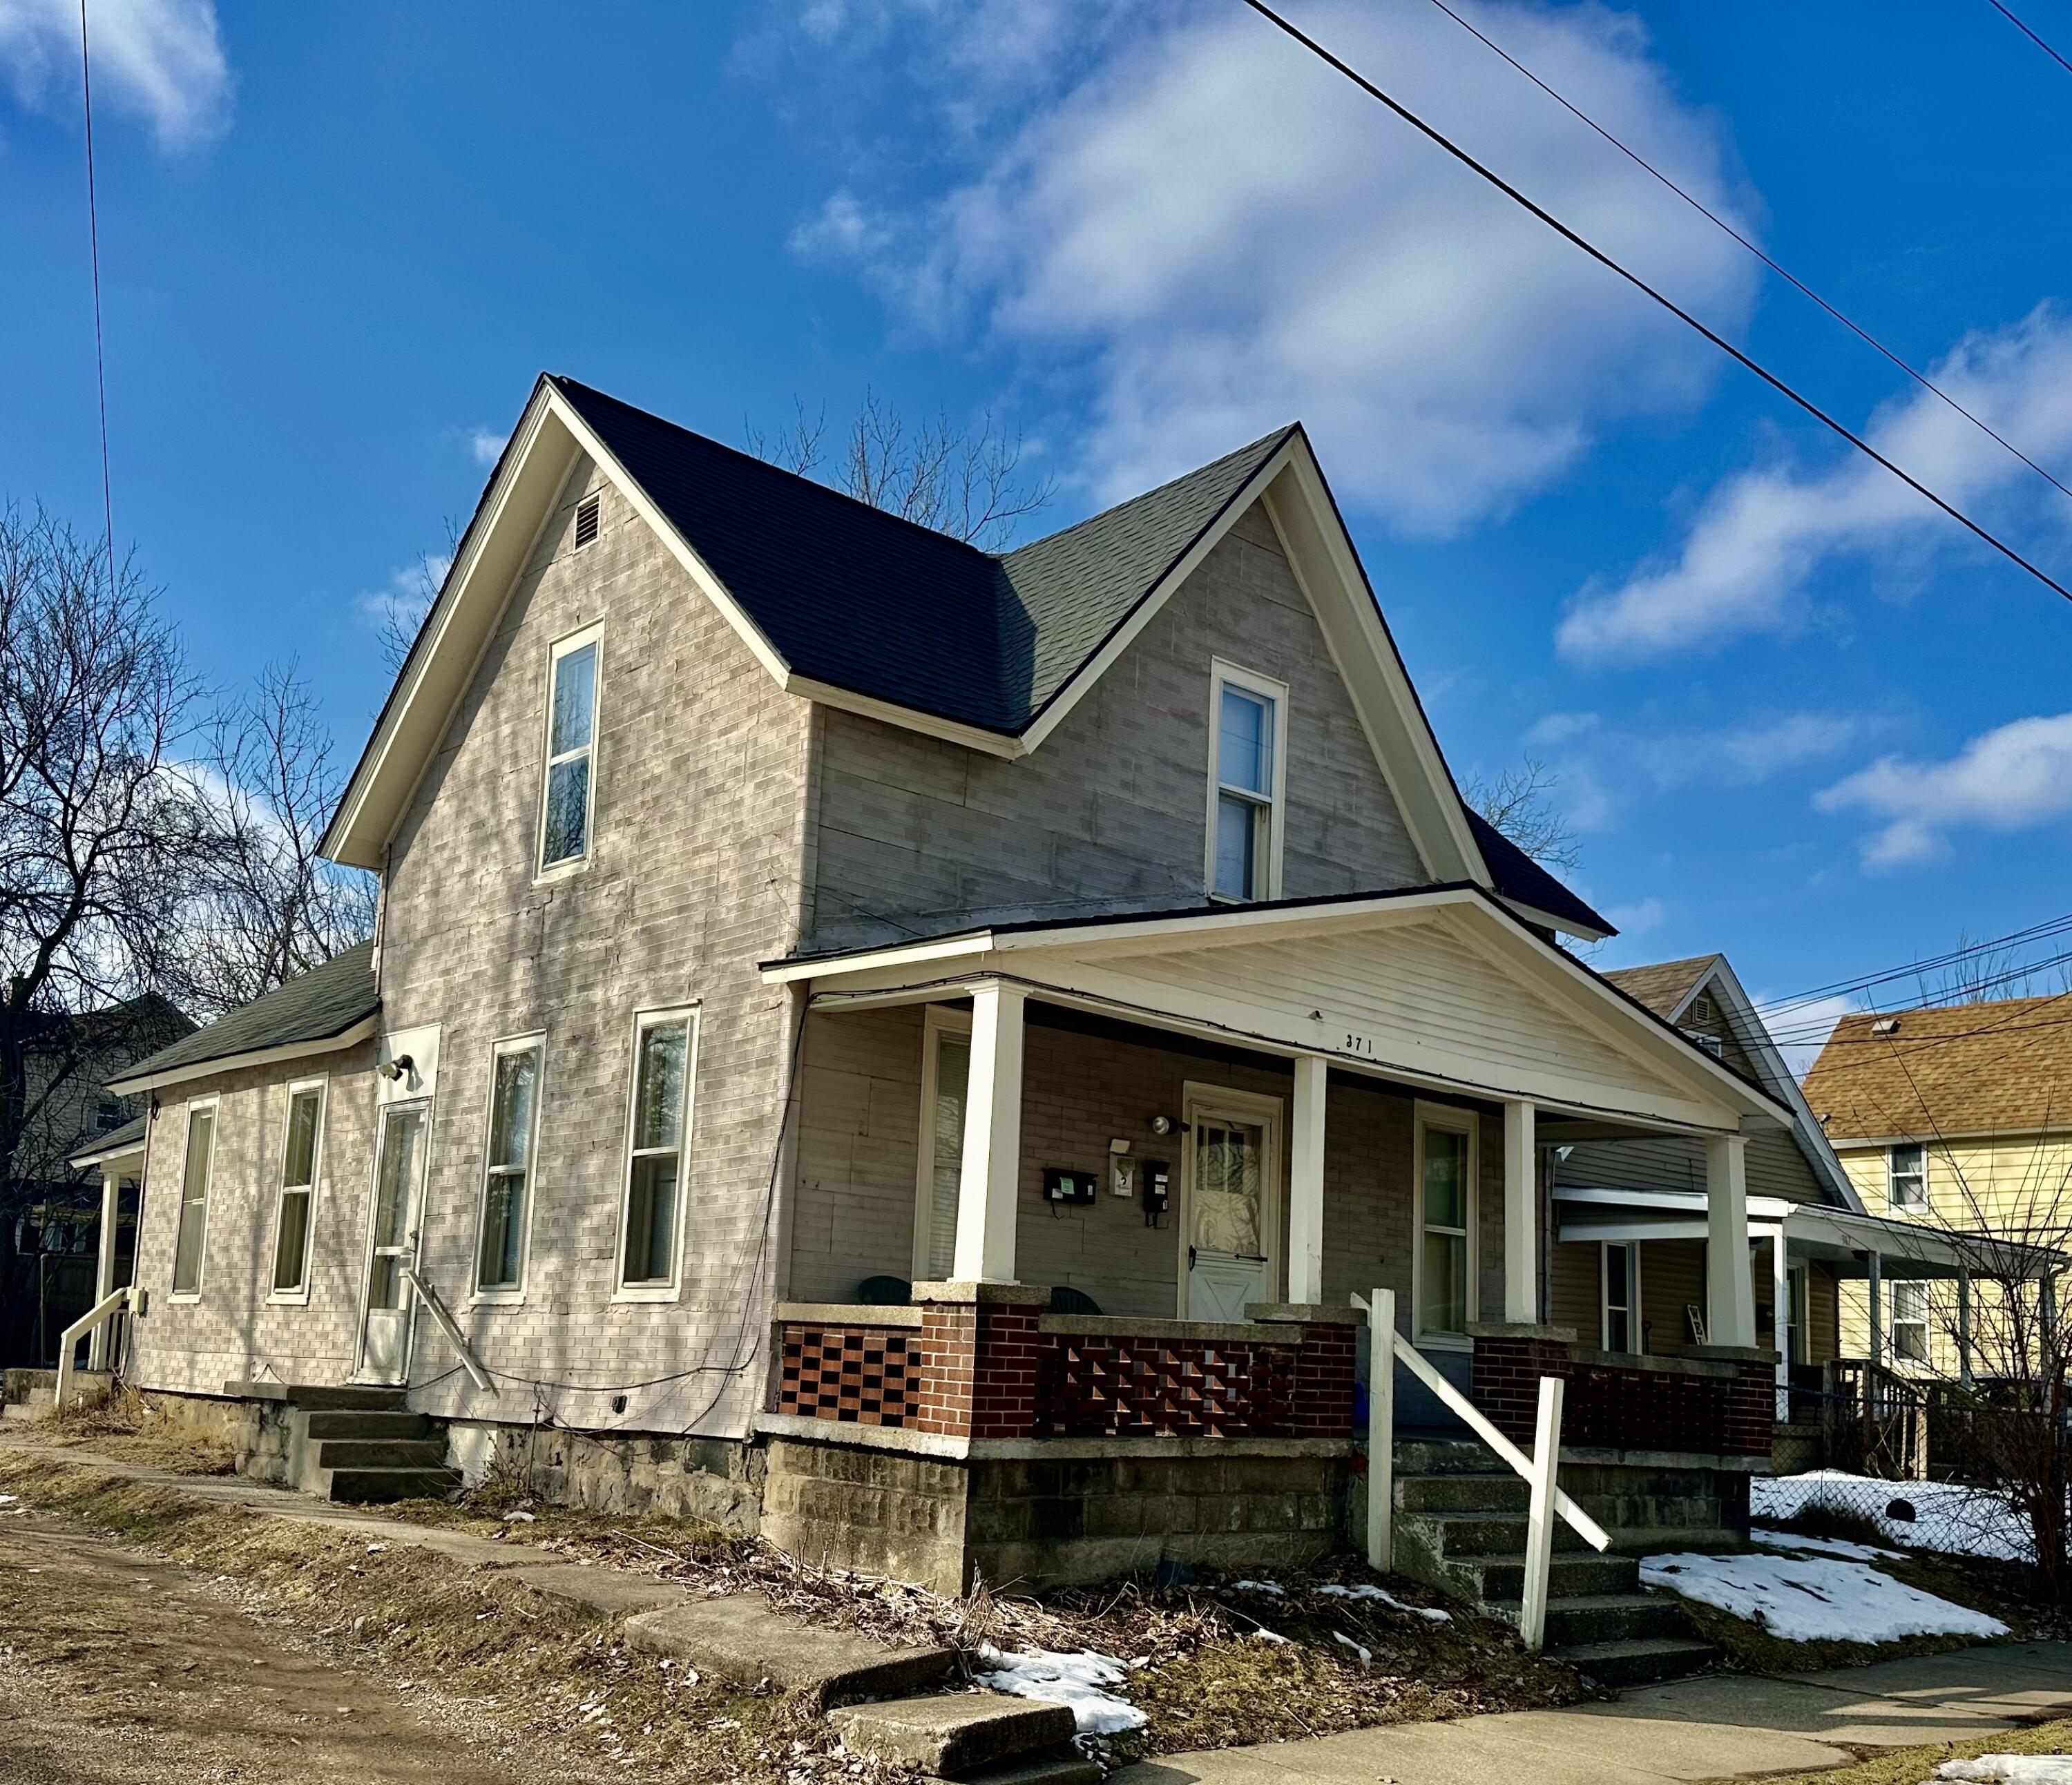
$199,900
bds
|
0
ba
|
0
sqft
|
built
1885
371 Hogadone Ave SW, Grand Rapids, MI 49504
$236
Cash flow
6.2%
Cash-on-Cash Return
7.7%
Cap rate
1.0%
Rent to Value Ratio
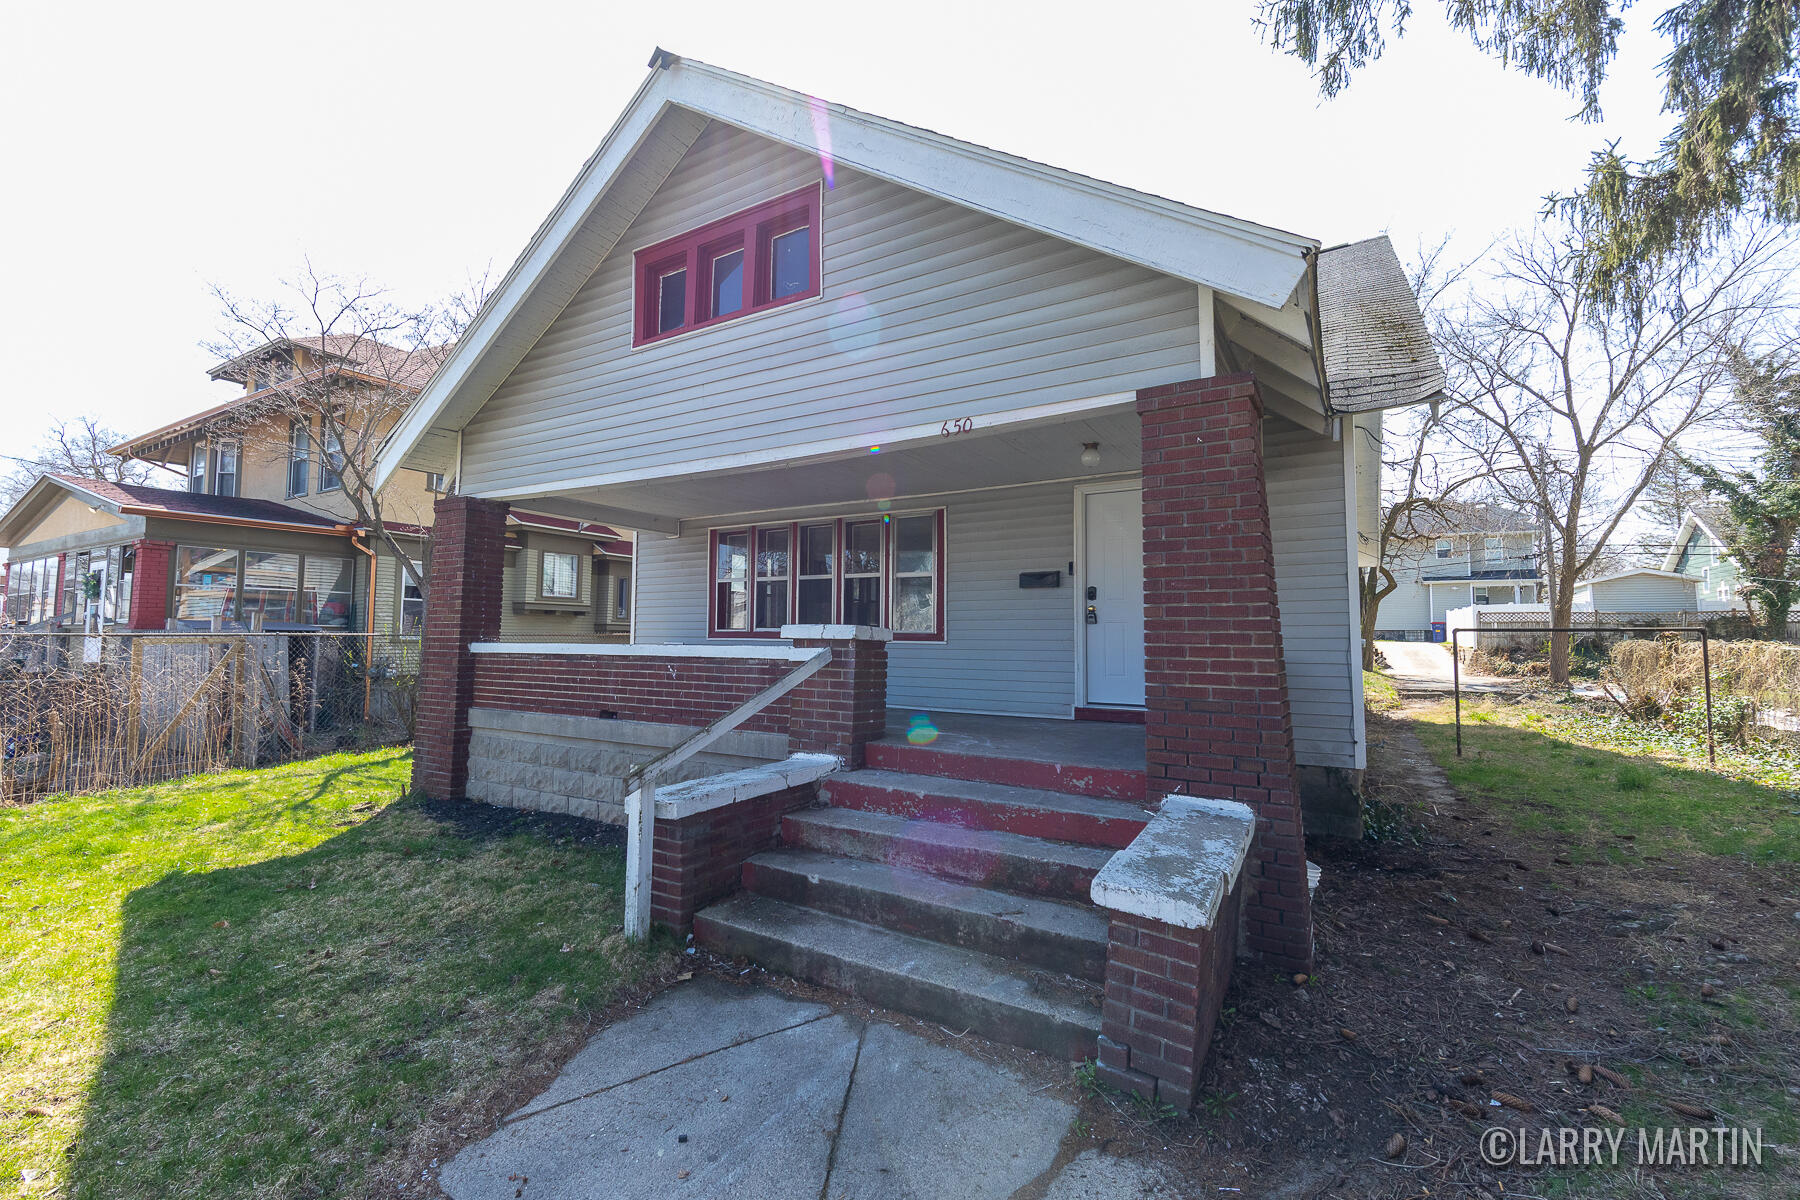
$200,000
4
bds
|
1
ba
|
1,784
sqft
|
built
1922
650 Worden St SE, Grand Rapids, MI 49507
$225
Cash flow
5.9%
Cash-on-Cash Return
7.6%
Cap rate
1.0%
Rent to Value Ratio
40 out of 569 properties for sale in Kent County
Limited Results Shown
Create a free account, or log in to reveal all property listings and enjoy the complete experience.

$415,000
4
bds
|
3
ba
|
2,011
sqft
|
built
2004
1548 Lillyview Ct SW, Wyoming, MI 49509
$-591
Cash flow
-7.4%
Cash-on-Cash Return
4.6%
Cap rate
0.7%
Rent to Value Ratio

$235,000
3
bds
|
1
ba
|
1,216
sqft
|
built
1925
234 Celia St SE, Wyoming, MI 49548
$72
Cash flow
1.6%
Cash-on-Cash Return
6.6%
Cap rate
0.9%
Rent to Value Ratio

$289,900
3
bds
|
2
ba
|
1,938
sqft
|
built
1965
1524 Oakcrest St SW, Wyoming, MI 49509
$-412
Cash flow
-7.4%
Cash-on-Cash Return
4.6%
Cap rate
0.7%
Rent to Value Ratio

$285,900
2
bds
|
1
ba
|
1,641
sqft
|
built
1989
3516 Robin Ave SW, Wyoming, MI 49509
$-311
Cash flow
-5.7%
Cash-on-Cash Return
5.0%
Cap rate
0.7%
Rent to Value Ratio

$519,000
5
bds
|
4
ba
|
2,888
sqft
|
built
2001
4218 Del Mar Ct SW, Wyoming, MI 49418
$-1,211
Cash flow
-12.2%
Cash-on-Cash Return
3.5%
Cap rate
0.6%
Rent to Value Ratio

$250,000
2
bds
|
1
ba
|
1,030
sqft
|
built
1930
5055 Haughey Ave SW, Wyoming, MI 49548
$-317
Cash flow
-6.6%
Cash-on-Cash Return
4.7%
Cap rate
0.8%
Rent to Value Ratio
$340,000
bds
|
0
ba
|
0
sqft
|
built
1968
3817 Boone Ave SW, Wyoming, MI 49519
$-778
Cash flow
-11.9%
Cash-on-Cash Return
3.5%
Cap rate
0.6%
Rent to Value Ratio

$399,900
4
bds
|
3
ba
|
3,733
sqft
|
built
1967
2017 Cannon St SW, Wyoming, MI 49519
$-445
Cash flow
-5.8%
Cash-on-Cash Return
4.9%
Cap rate
0.7%
Rent to Value Ratio
$199,900
bds
|
0
ba
|
0
sqft
|
built
1885
371 Hogadone Ave SW, Grand Rapids, MI 49504
$236
Cash flow
6.2%
Cash-on-Cash Return
7.7%
Cap rate
1.0%
Rent to Value Ratio

$642,000
4
bds
|
3
ba
|
3,446
sqft
|
built
1958
8054 Myers Lake Ave NE, Rockford, MI 49341
$-1,433
Cash flow
-11.6%
Cash-on-Cash Return
3.6%
Cap rate
0.5%
Rent to Value Ratio

$749,000
5
bds
|
4
ba
|
4,600
sqft
|
built
1995
7174 Loma Linda Dr NE, Rockford, MI 49341
$-1,801
Cash flow
-12.5%
Cash-on-Cash Return
3.4%
Cap rate
0.5%
Rent to Value Ratio

$280,000
2
bds
|
2
ba
|
1,123
sqft
|
built
2018
3521 Crystal River St SW, Wyoming, MI 49418
$-691
Cash flow
-12.9%
Cash-on-Cash Return
3.3%
Cap rate
0.8%
Rent to Value Ratio

$749,900
5
bds
|
4
ba
|
4,118
sqft
|
built
2003
11815 Henrietta Dr NE, Rockford, MI 49341
$-2,665
Cash flow
-18.5%
Cash-on-Cash Return
2.0%
Cap rate
0.3%
Rent to Value Ratio

$437,900
4
bds
|
2
ba
|
2,592
sqft
|
built
1973
10417 6 Mile Rd NE, Rockford, MI 49341
$-646
Cash flow
-7.7%
Cash-on-Cash Return
4.5%
Cap rate
0.6%
Rent to Value Ratio
$485,000
4
bds
|
3
ba
|
2,844
sqft
|
built
2002
8517 Green Valley Rd SE, Caledonia, MI 49316
$-926
Cash flow
-10.0%
Cash-on-Cash Return
4.0%
Cap rate
0.6%
Rent to Value Ratio
$650,000
6
bds
|
4
ba
|
3,600
sqft
|
built
2000
7152 Russet Vista Dr NE, Rockford, MI 49341
$-1,905
Cash flow
-15.3%
Cash-on-Cash Return
2.7%
Cap rate
0.5%
Rent to Value Ratio
$200,000
4
bds
|
1
ba
|
1,784
sqft
|
built
1922
650 Worden St SE, Grand Rapids, MI 49507
$225
Cash flow
5.9%
Cash-on-Cash Return
7.6%
Cap rate
1.0%
Rent to Value Ratio

$399,900
4
bds
|
2
ba
|
2,562
sqft
|
built
1820
3201 12 Mile Rd NE, Rockford, MI 49341
$-289
Cash flow
-3.8%
Cash-on-Cash Return
5.4%
Cap rate
0.8%
Rent to Value Ratio
$223,500
5
bds
|
2
ba
|
1,876
sqft
|
built
1910
605 New Ave SW, Grand Rapids, MI 49503
$-154
Cash flow
-3.6%
Cash-on-Cash Return
5.4%
Cap rate
0.9%
Rent to Value Ratio
$849,900
4
bds
|
3
ba
|
3,228
sqft
|
built
1976
1901 Forest Shores Dr SE, Grand Rapids, MI 49546
$-2,548
Cash flow
-15.6%
Cash-on-Cash Return
2.7%
Cap rate
0.4%
Rent to Value Ratio
$447,900
bds
|
0
ba
|
0
sqft
|
built
1875
248 Hollister Ave SE, Grand Rapids, MI 49506
$-1,031
Cash flow
-12.0%
Cash-on-Cash Return
3.5%
Cap rate
0.6%
Rent to Value Ratio

$585,000
4
bds
|
2
ba
|
2,008
sqft
|
built
1987
11411 Sandy Bottom Rd NE, Rockford, MI 49341
$-1,382
Cash flow
-12.3%
Cash-on-Cash Return
3.4%
Cap rate
0.5%
Rent to Value Ratio

$269,000
4
bds
|
1
ba
|
1,683
sqft
|
built
1890
519 Bissell St NE, Grand Rapids, MI 49503
$-78
Cash flow
-1.5%
Cash-on-Cash Return
5.9%
Cap rate
0.8%
Rent to Value Ratio

$424,900
4
bds
|
1
ba
|
1,844
sqft
|
built
1947
415 Charlotte Ave NW, Grand Rapids, MI 49504
$-727
Cash flow
-8.9%
Cash-on-Cash Return
4.2%
Cap rate
0.6%
Rent to Value Ratio

$569,900
4
bds
|
3
ba
|
3,692
sqft
|
built
1995
14320 Keiber Rd NE, Greenville, MI 48838
$-1,496
Cash flow
-13.7%
Cash-on-Cash Return
3.1%
Cap rate
0.5%
Rent to Value Ratio
$2,100,000
6
bds
|
4
ba
|
4,394
sqft
|
built
2011
7192 Wilkinson Dr NE, Rockford, MI 49341
$-8,822
Cash flow
-21.9%
Cash-on-Cash Return
1.2%
Cap rate
0.2%
Rent to Value Ratio
$380,000
4
bds
|
3
ba
|
2,536
sqft
|
built
1961
6233 Meadowlark St NE, Rockford, MI 49341
$-454
Cash flow
-6.2%
Cash-on-Cash Return
4.8%
Cap rate
0.7%
Rent to Value Ratio

$809,000
4
bds
|
4
ba
|
2,823
sqft
|
built
2023
3848 Autumn Acres Ct, Rockford, MI 49341
$-3,826
Cash flow
-24.7%
Cash-on-Cash Return
0.6%
Cap rate
0.2%
Rent to Value Ratio
$700,000
4
bds
|
3
ba
|
3,407
sqft
|
built
2020
1716 Gloryfield Dr SW, Byron Center, MI 49315
$-1,473
Cash flow
-11.0%
Cash-on-Cash Return
3.7%
Cap rate
0.6%
Rent to Value Ratio
$1,200,000
6
bds
|
5
ba
|
4,806
sqft
|
built
2007
10377 Ivanrest Ave SW, Byron Center, MI 49315
$-4,154
Cash flow
-18.1%
Cash-on-Cash Return
2.1%
Cap rate
0.3%
Rent to Value Ratio
$795,000
3
bds
|
3
ba
|
2,765
sqft
|
built
2000
6817 Martin View St NE, Rockford, MI 49341
$-2,387
Cash flow
-15.7%
Cash-on-Cash Return
2.7%
Cap rate
0.4%
Rent to Value Ratio
$574,900
5
bds
|
4
ba
|
3,106
sqft
|
built
2013
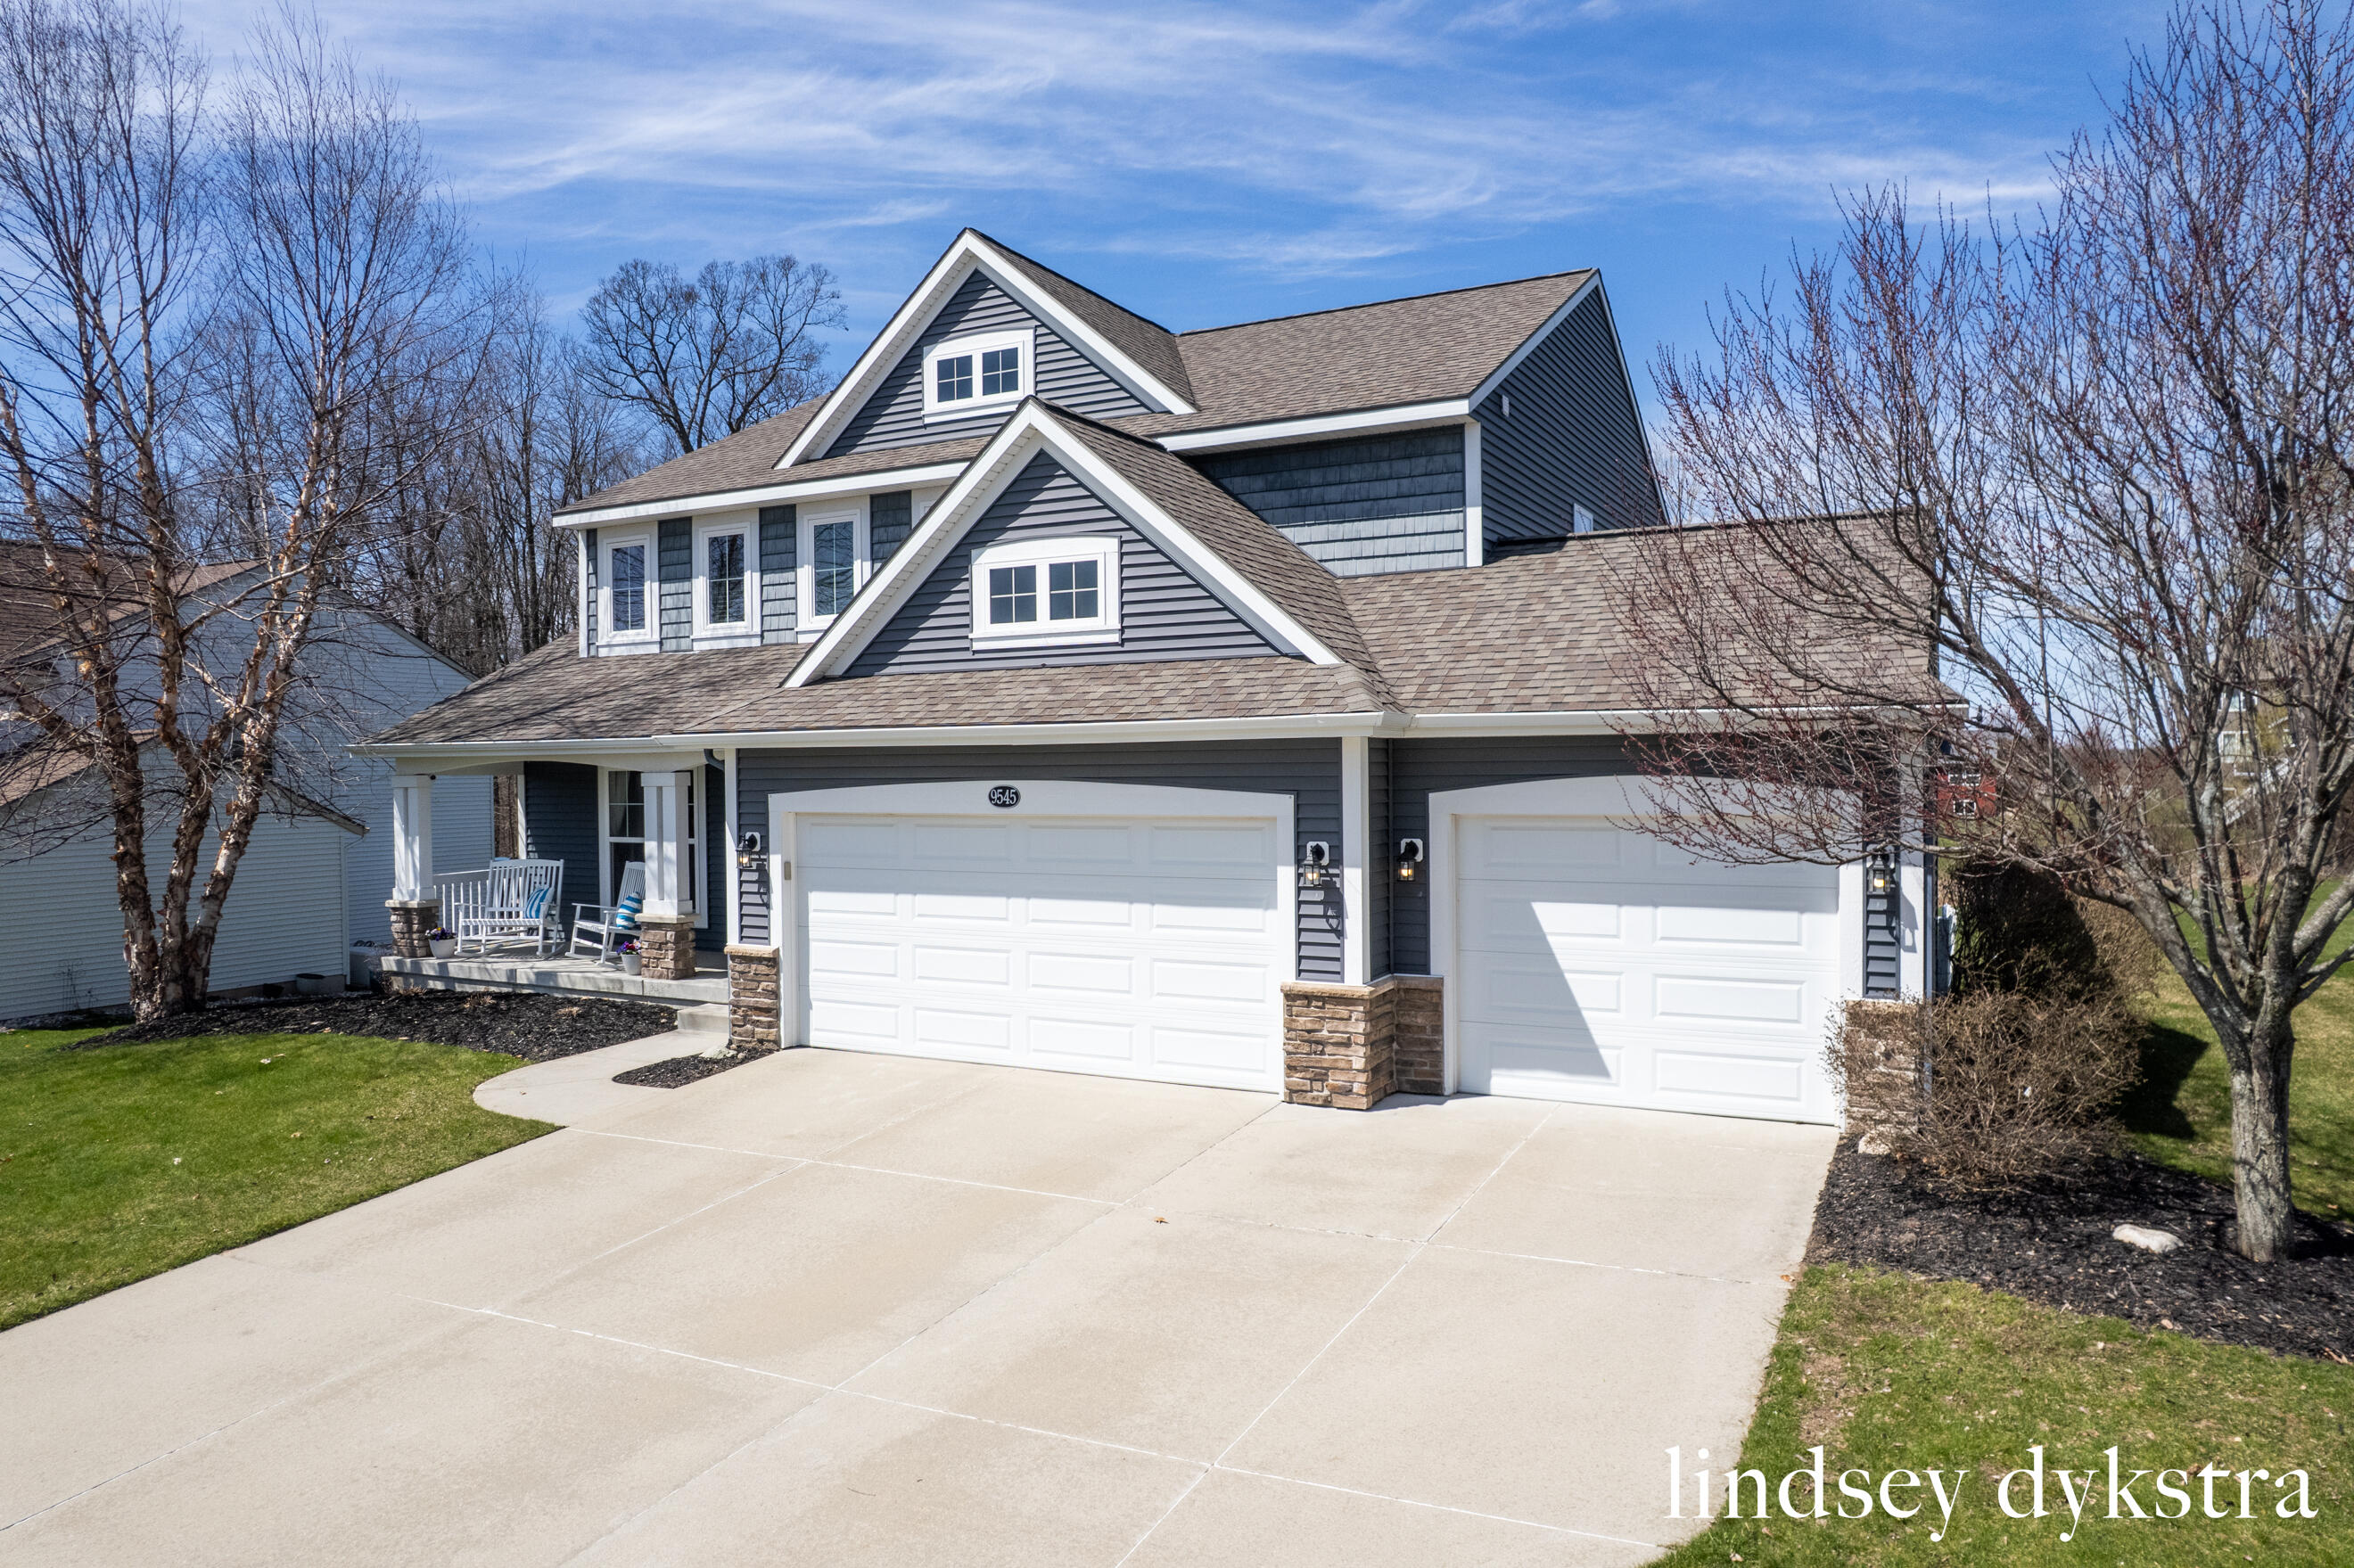
9545 Sunset Ridge Dr NE, Rockford, MI 49341
$-1,272
Cash flow
-11.5%
Cash-on-Cash Return
3.6%
Cap rate
0.6%
Rent to Value Ratio

$365,000
2
bds
|
5
ba
|
1,500
sqft
|
built
2019
6965 Myers Lake Ave NE, Rockford, MI 49341
$-609
Cash flow
-8.7%
Cash-on-Cash Return
4.3%
Cap rate
0.7%
Rent to Value Ratio
$380,000
3
bds
|
3
ba
|
2,276
sqft
|
built
1995
7263 11 Mile Rd NE, Rockford, MI 49341
$-372
Cash flow
-5.1%
Cash-on-Cash Return
5.1%
Cap rate
0.7%
Rent to Value Ratio
$675,000
5
bds
|
4
ba
|
4,143
sqft
|
built
2022
658 Petoskey Stone Dr SW, Byron Center, MI 49315
$-1,782
Cash flow
-13.8%
Cash-on-Cash Return
3.1%
Cap rate
0.5%
Rent to Value Ratio

$649,900
5
bds
|
4
ba
|
3,810
sqft
|
built
2014
7198 Limerick Ln, Byron Center, MI 49315
$-1,630
Cash flow
-13.1%
Cash-on-Cash Return
3.3%
Cap rate
0.5%
Rent to Value Ratio
$639,900
5
bds
|
4
ba
|
3,116
sqft
|
built
2012
2250 Byron Shores Dr SW, Byron Center, MI 49315
$-1,256
Cash flow
-10.2%
Cash-on-Cash Return
3.9%
Cap rate
0.6%
Rent to Value Ratio
$1,975,000
5
bds
|
4
ba
|
5,100
sqft
|
built
2018
7275 Peninsula Dr NE, Rockford, MI 49341
$-6,627
Cash flow
-17.5%
Cash-on-Cash Return
2.2%
Cap rate
0.4%
Rent to Value Ratio

$475,000
4
bds
|
2
ba
|
2,341
sqft
|
built
1997
2511 Bowenton Pl SW, Wyoming, MI 49519
$-933
Cash flow
-10.2%
Cash-on-Cash Return
3.9%
Cap rate
0.6%
Rent to Value Ratio
$459,900
4
bds
|
3
ba
|
2,552
sqft
|
built
2005
9660 Sunset Ridge Dr NE, Rockford, MI 49341
$-903
Cash flow
-10.2%
Cash-on-Cash Return
3.9%
Cap rate
0.6%
Rent to Value Ratio