Lexington, MA Investment Properties for Sale
Browse homes for sale and investment properties in Lexington, MA. Refine your search by price, property type, or more.
Best cash flowing properties in Lexington, MA

$890,000
3
bds
|
1
ba
|
1,333
sqft
|
built
1917
18 Spring St, Lexington, MA 02421
$-2,351
Cash flow
-13.8%
Cash-on-Cash Return
2.5%
Cap rate
0.4%
Rent to Value Ratio

$1,865,000
4
bds
|
4
ba
|
3,114
sqft
|
built
1936
9 Richard Rd, Lexington, MA 02421
$-3,858
Cash flow
-10.8%
Cash-on-Cash Return
3.2%
Cap rate
0.4%
Rent to Value Ratio
31 out of 53 properties for sale in Lexington, MA
Limited Results Shown
Create a free account, or log in to reveal all property listings and enjoy the complete experience.

$2,950,000
6
bds
|
6
ba
|
4,969
sqft
|
built
1987
12 Solomon Pierce Rd, Lexington, MA 02420
$-8,966
Cash flow
-15.9%
Cash-on-Cash Return
2.0%
Cap rate
0.4%
Rent to Value Ratio

$1,995,000
5
bds
|
3
ba
|
4,040
sqft
|
built
1978
6 Apollo Cir, Lexington, MA 02421
$-5,776
Cash flow
-15.1%
Cash-on-Cash Return
2.2%
Cap rate
0.4%
Rent to Value Ratio

$3,368,000
5
bds
|
6
ba
|
7,012
sqft
|
built
2018
311 Concord Ave, Lexington, MA 02421
$-13,368
Cash flow
-20.7%
Cash-on-Cash Return
0.9%
Cap rate
0.2%
Rent to Value Ratio
$1,389,000
4
bds
|
3
ba
|
2,324
sqft
|
built
1961
31 Lillian Rd, Lexington, MA 02420
$-3,922
Cash flow
-14.7%
Cash-on-Cash Return
2.3%
Cap rate
0.4%
Rent to Value Ratio
$1,865,000
4
bds
|
4
ba
|
3,114
sqft
|
built
1936
9 Richard Rd, Lexington, MA 02421
$-3,858
Cash flow
-10.8%
Cash-on-Cash Return
3.2%
Cap rate
0.4%
Rent to Value Ratio
$1,849,000
4
bds
|
4
ba
|
3,309
sqft
|
built
2001
28 Sullivan St, Lexington, MA 02420
$-5,533
Cash flow
-15.6%
Cash-on-Cash Return
2.1%
Cap rate
0.4%
Rent to Value Ratio
$1,399,000
3
bds
|
2
ba
|
2,230
sqft
|
built
1952
101 Burlington St, Lexington, MA 02420
$-4,273
Cash flow
-15.9%
Cash-on-Cash Return
2.0%
Cap rate
0.4%
Rent to Value Ratio
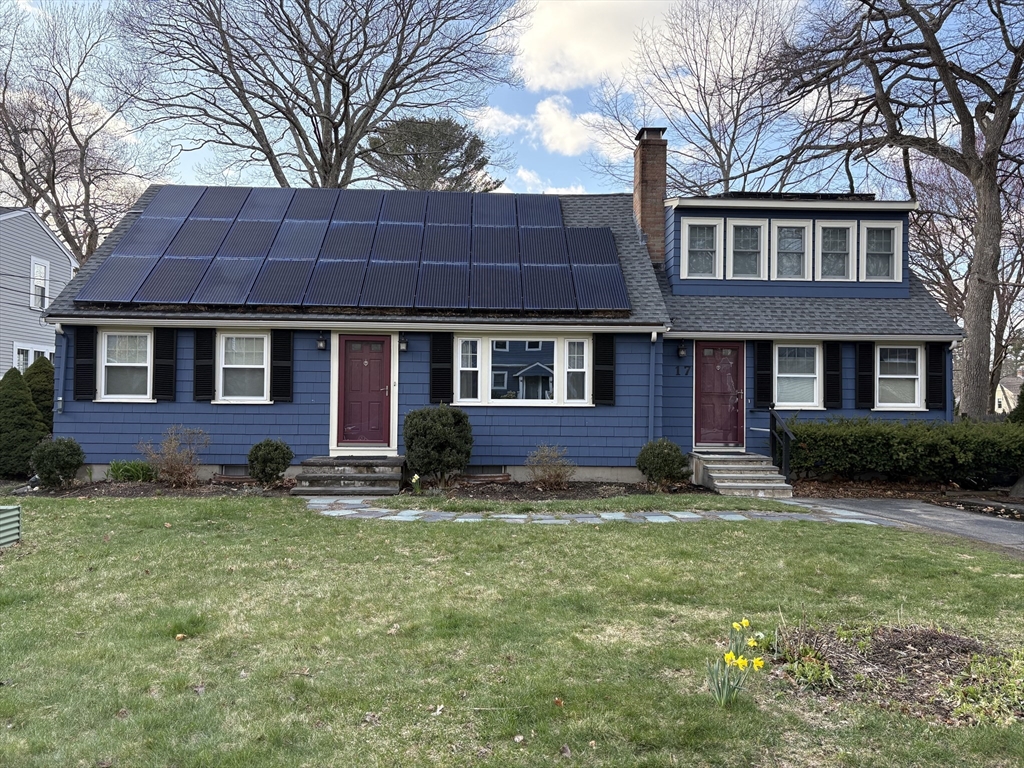
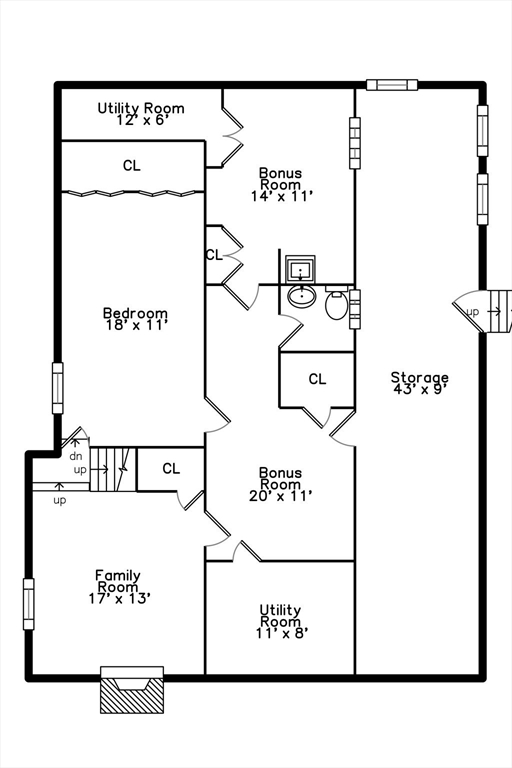
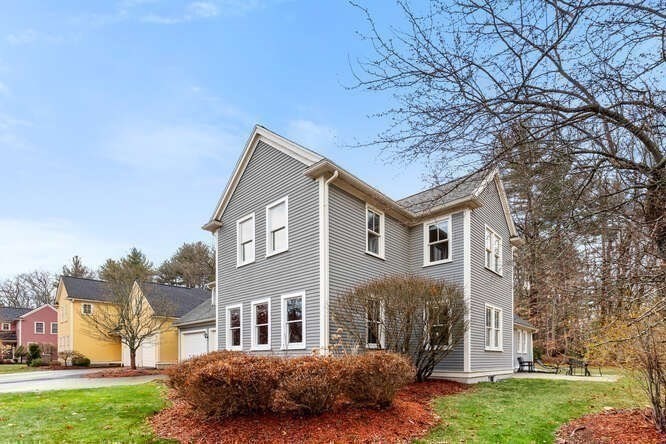
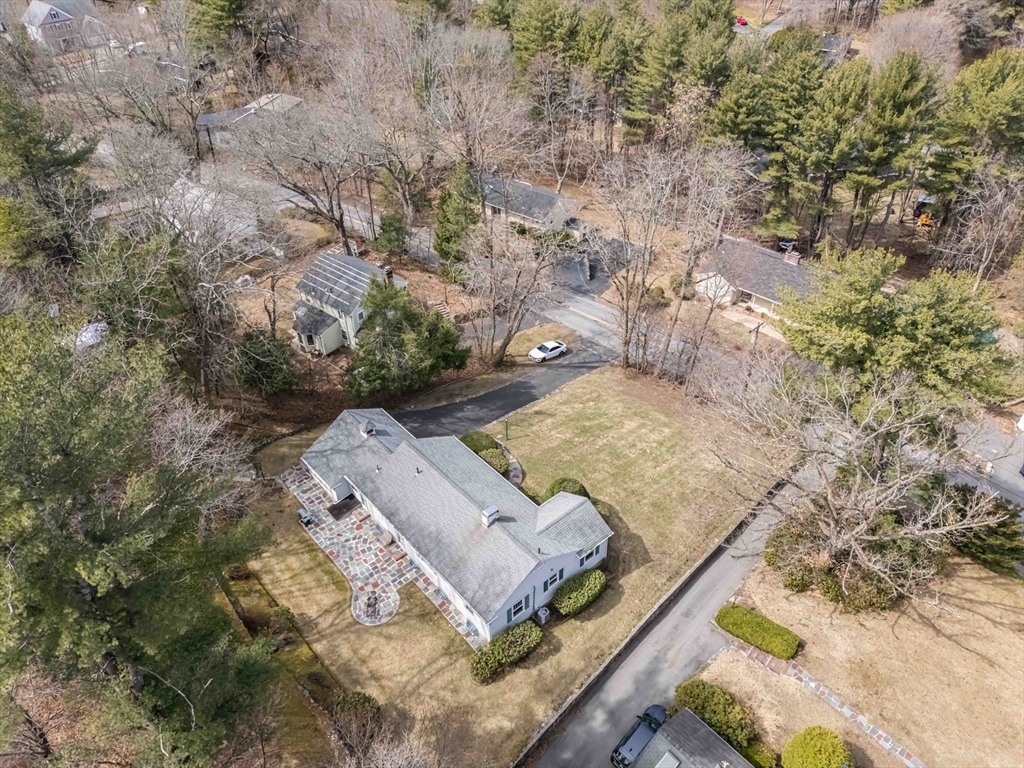
$1,390,000
5
bds
|
3
ba
|
2,550
sqft
|
built
1958
17 Hamblen St, Lexington, MA 02421
$-3,923
Cash flow
-14.7%
Cash-on-Cash Return
2.3%
Cap rate
0.4%
Rent to Value Ratio

$3,285,000
7
bds
|
6
ba
|
6,945
sqft
|
built
2015
10 Woodland Rd, Lexington, MA 02420
$-12,617
Cash flow
-20.0%
Cash-on-Cash Return
1.1%
Cap rate
0.2%
Rent to Value Ratio

$2,499,000
5
bds
|
5
ba
|
4,835
sqft
|
built
2025
111 Cedar St, Lexington, MA 02421
$-5,795
Cash flow
-12.1%
Cash-on-Cash Return
2.9%
Cap rate
0.5%
Rent to Value Ratio
$2,495,000
6
bds
|
5
ba
|
4,072
sqft
|
built
2025
50 School St, Lexington, MA 02421
$-8,702
Cash flow
-18.2%
Cash-on-Cash Return
1.5%
Cap rate
0.2%
Rent to Value Ratio
$1,199,000
4
bds
|
4
ba
|
2,630
sqft
|
built
1886
229 Bedford St, Lexington, MA 02420
$-3,929
Cash flow
-17.1%
Cash-on-Cash Return
1.7%
Cap rate
0.3%
Rent to Value Ratio
$890,000
3
bds
|
1
ba
|
1,333
sqft
|
built
1917
18 Spring St, Lexington, MA 02421
$-2,351
Cash flow
-13.8%
Cash-on-Cash Return
2.5%
Cap rate
0.4%
Rent to Value Ratio
$1,695,000
4
bds
|
3
ba
|
3,345
sqft
|
built
1971
5 Middle St, Lexington, MA 02421
$-3,905
Cash flow
-12.0%
Cash-on-Cash Return
2.9%
Cap rate
0.5%
Rent to Value Ratio
$2,350,000
4
bds
|
5
ba
|
4,300
sqft
|
built
2025
383 Marrett Rd, Lexington, MA 02421
$-16,694
Cash flow
-37.1%
Cash-on-Cash Return
-2.8%
Cap rate
0.2%
Rent to Value Ratio
$4,250,000
6
bds
|
6
ba
|
6,905
sqft
|
built
2025
7 Whipple Rd, Lexington, MA 02420
$-17,630
Cash flow
-21.6%
Cash-on-Cash Return
0.7%
Cap rate
0.1%
Rent to Value Ratio

$1,699,000
3
bds
|
2
ba
|
2,494
sqft
|
built
1964
28 Baskin Rd, Lexington, MA 02421
$-5,453
Cash flow
-16.7%
Cash-on-Cash Return
1.8%
Cap rate
0.3%
Rent to Value Ratio

$2,899,000
5
bds
|
6
ba
|
4,250
sqft
|
built
2025
17 Hamilton Rd, Lexington, MA 02420
$-19,016
Cash flow
-34.2%
Cash-on-Cash Return
-2.2%
Cap rate
0.2%
Rent to Value Ratio
$3,295,000
4
bds
|
6
ba
|
7,830
sqft
|
built
1989
8 Jonas Stone Cir, Lexington, MA 02420
$-12,429
Cash flow
-19.7%
Cash-on-Cash Return
1.2%
Cap rate
0.3%
Rent to Value Ratio
$3,199,000
6
bds
|
6
ba
|
6,161
sqft
|
built
2025
123 Woburn St, Lexington, MA 02420
$-12,034
Cash flow
-19.6%
Cash-on-Cash Return
1.2%
Cap rate
0.1%
Rent to Value Ratio
$2,200,000
6
bds
|
5
ba
|
4,000
sqft
|
built
2013
7 Middleby Rd, Lexington, MA 02421
$-6,818
Cash flow
-16.2%
Cash-on-Cash Return
2.0%
Cap rate
0.4%
Rent to Value Ratio
$3,250,000
4
bds
|
4
ba
|
3,649
sqft
|
built
1950
6 Moon Hill Rd, Lexington, MA 02421
$-10,692
Cash flow
-17.2%
Cash-on-Cash Return
1.7%
Cap rate
0.3%
Rent to Value Ratio
$1,674,000
3
bds
|
4
ba
|
2,348
sqft
|
built
1870
58 Hancock St, Lexington, MA 02420
$-4,050
Cash flow
-12.6%
Cash-on-Cash Return
2.8%
Cap rate
0.5%
Rent to Value Ratio
$6,150,000
6
bds
|
10
ba
|
8,649
sqft
|
built
2024
23 Thoreau Rd, Lexington, MA 02420
$-25,994
Cash flow
-22.1%
Cash-on-Cash Return
0.6%
Cap rate
0.2%
Rent to Value Ratio
$2,950,000
5
bds
|
6
ba
|
5,311
sqft
|
built
2025
12 Wilson Rd, Lexington, MA 02421
$-10,855
Cash flow
-19.2%
Cash-on-Cash Return
1.3%
Cap rate
0.2%
Rent to Value Ratio

$2,199,000
5
bds
|
4
ba
|
3,012
sqft
|
built
2023
10 Bowker St, Lexington, MA 02421
$-5,253
Cash flow
-12.5%
Cash-on-Cash Return
2.8%
Cap rate
0.4%
Rent to Value Ratio
$4,595,000
6
bds
|
8
ba
|
6,196
sqft
|
built
2025
3 Brown Rd, Lexington, MA 02420
$-26,283
Cash flow
-29.8%
Cash-on-Cash Return
-1.2%
Cap rate
0.1%
Rent to Value Ratio

$4,600,000
6
bds
|
7
ba
|
7,739
sqft
|
built
2024
15 Tyler Rd, Lexington, MA 02420
$-14,179
Cash flow
-16.1%
Cash-on-Cash Return
2.0%
Cap rate
0.2%
Rent to Value Ratio

$5,395,000
6
bds
|
10
ba
|
8,220
sqft
|
built
2009
23 Burroughs Rd, Lexington, MA 02420
$-22,382
Cash flow
-21.6%
Cash-on-Cash Return
0.7%
Cap rate
0.2%
Rent to Value Ratio

$5,250,000
5
bds
|
8
ba
|
9,825
sqft
|
built
2003
197 Grant St, Lexington, MA 02420
$-20,768
Cash flow
-20.6%
Cash-on-Cash Return
0.9%
Cap rate
0.2%
Rent to Value Ratio

$1,885,000
3
bds
|
2
ba
|
2,927
sqft
|
built
1800
1900 Massachusetts Ave, Lexington, MA 02421
$-7,255
Cash flow
-20.1%
Cash-on-Cash Return
1.1%
Cap rate
0.2%
Rent to Value Ratio