Fishers, IN Investment Properties for Sale
Browse homes for sale and investment properties in Fishers, IN. Refine your search by price, property type, or more.
Best cash flowing properties in Fishers, IN

$269,900
3
bds
|
3
ba
|
1,706
sqft
|
built
1999
9808 Worthington Blvd, Fishers, IN 46038
$-103
Cash flow
-2.0%
Cash-on-Cash Return
5.7%
Cap rate
0.7%
Rent to Value Ratio
$269,900
3
bds
|
3
ba
|
1,540
sqft
|
built
2014
12683 White Chapel Cir, Fishers, IN 46037
$-193
Cash flow
-3.7%
Cash-on-Cash Return
5.3%
Cap rate
0.7%
Rent to Value Ratio
23 out of 125 properties for sale in Fishers, IN
Limited Results Shown
Create a free account, or log in to reveal all property listings and enjoy the complete experience.
$400,000
4
bds
|
3
ba
|
2,407
sqft
|
built
1995
9243 Crossing Dr, Fishers, IN 46037
$-341
Cash flow
-4.4%
Cash-on-Cash Return
5.1%
Cap rate
0.6%
Rent to Value Ratio

$489,000
4
bds
|
3
ba
|
3,326
sqft
|
built
1998
12332 Cobblefield Ct, Fishers, IN 46037
$-529
Cash flow
-5.6%
Cash-on-Cash Return
4.8%
Cap rate
0.6%
Rent to Value Ratio
$899,000
5
bds
|
6
ba
|
5,230
sqft
|
built
2018
14747 Harvest Glen Blvd S, Fishers, IN 46037
$-341
Cash flow
-2.0%
Cash-on-Cash Return
5.7%
Cap rate
0.7%
Rent to Value Ratio
$3,300,000
6
bds
|
7
ba
|
9,525
sqft
|
built
1999
395 Breakwater Dr, Fishers, IN 46037
$-12,186
Cash flow
-19.3%
Cash-on-Cash Return
1.7%
Cap rate
0.2%
Rent to Value Ratio
$809,999
4
bds
|
5
ba
|
5,760
sqft
|
built
2007
9877 Wading Crane Ave, Fishers, IN 46055
$-1,194
Cash flow
-7.7%
Cash-on-Cash Return
4.4%
Cap rate
0.5%
Rent to Value Ratio
$366,900
4
bds
|
3
ba
|
1,880
sqft
|
built
2008
13124 S Elster Way, Fishers, IN 46037
$-406
Cash flow
-5.8%
Cash-on-Cash Return
4.8%
Cap rate
0.6%
Rent to Value Ratio
$525,000
4
bds
|
4
ba
|
3,554
sqft
|
built
2013
12964 Walbeck Dr, Fishers, IN 46037
$-328
Cash flow
-3.3%
Cash-on-Cash Return
5.4%
Cap rate
0.7%
Rent to Value Ratio

$745,000
5
bds
|
4
ba
|
4,502
sqft
|
built
2015
11383 Sea Side Ct, Fishers, IN 46040
$-847
Cash flow
-5.9%
Cash-on-Cash Return
4.8%
Cap rate
0.6%
Rent to Value Ratio

$284,900
3
bds
|
3
ba
|
1,920
sqft
|
built
2004
12657 Republic Dr, Fishers, IN 46037
$-250
Cash flow
-4.6%
Cash-on-Cash Return
5.1%
Cap rate
0.6%
Rent to Value Ratio
$524,999
3
bds
|
3
ba
|
3,063
sqft
|
built
2013
12610 Broadmoor Ct N, Fishers, IN 46037
$-1,159
Cash flow
-11.5%
Cash-on-Cash Return
3.5%
Cap rate
0.5%
Rent to Value Ratio
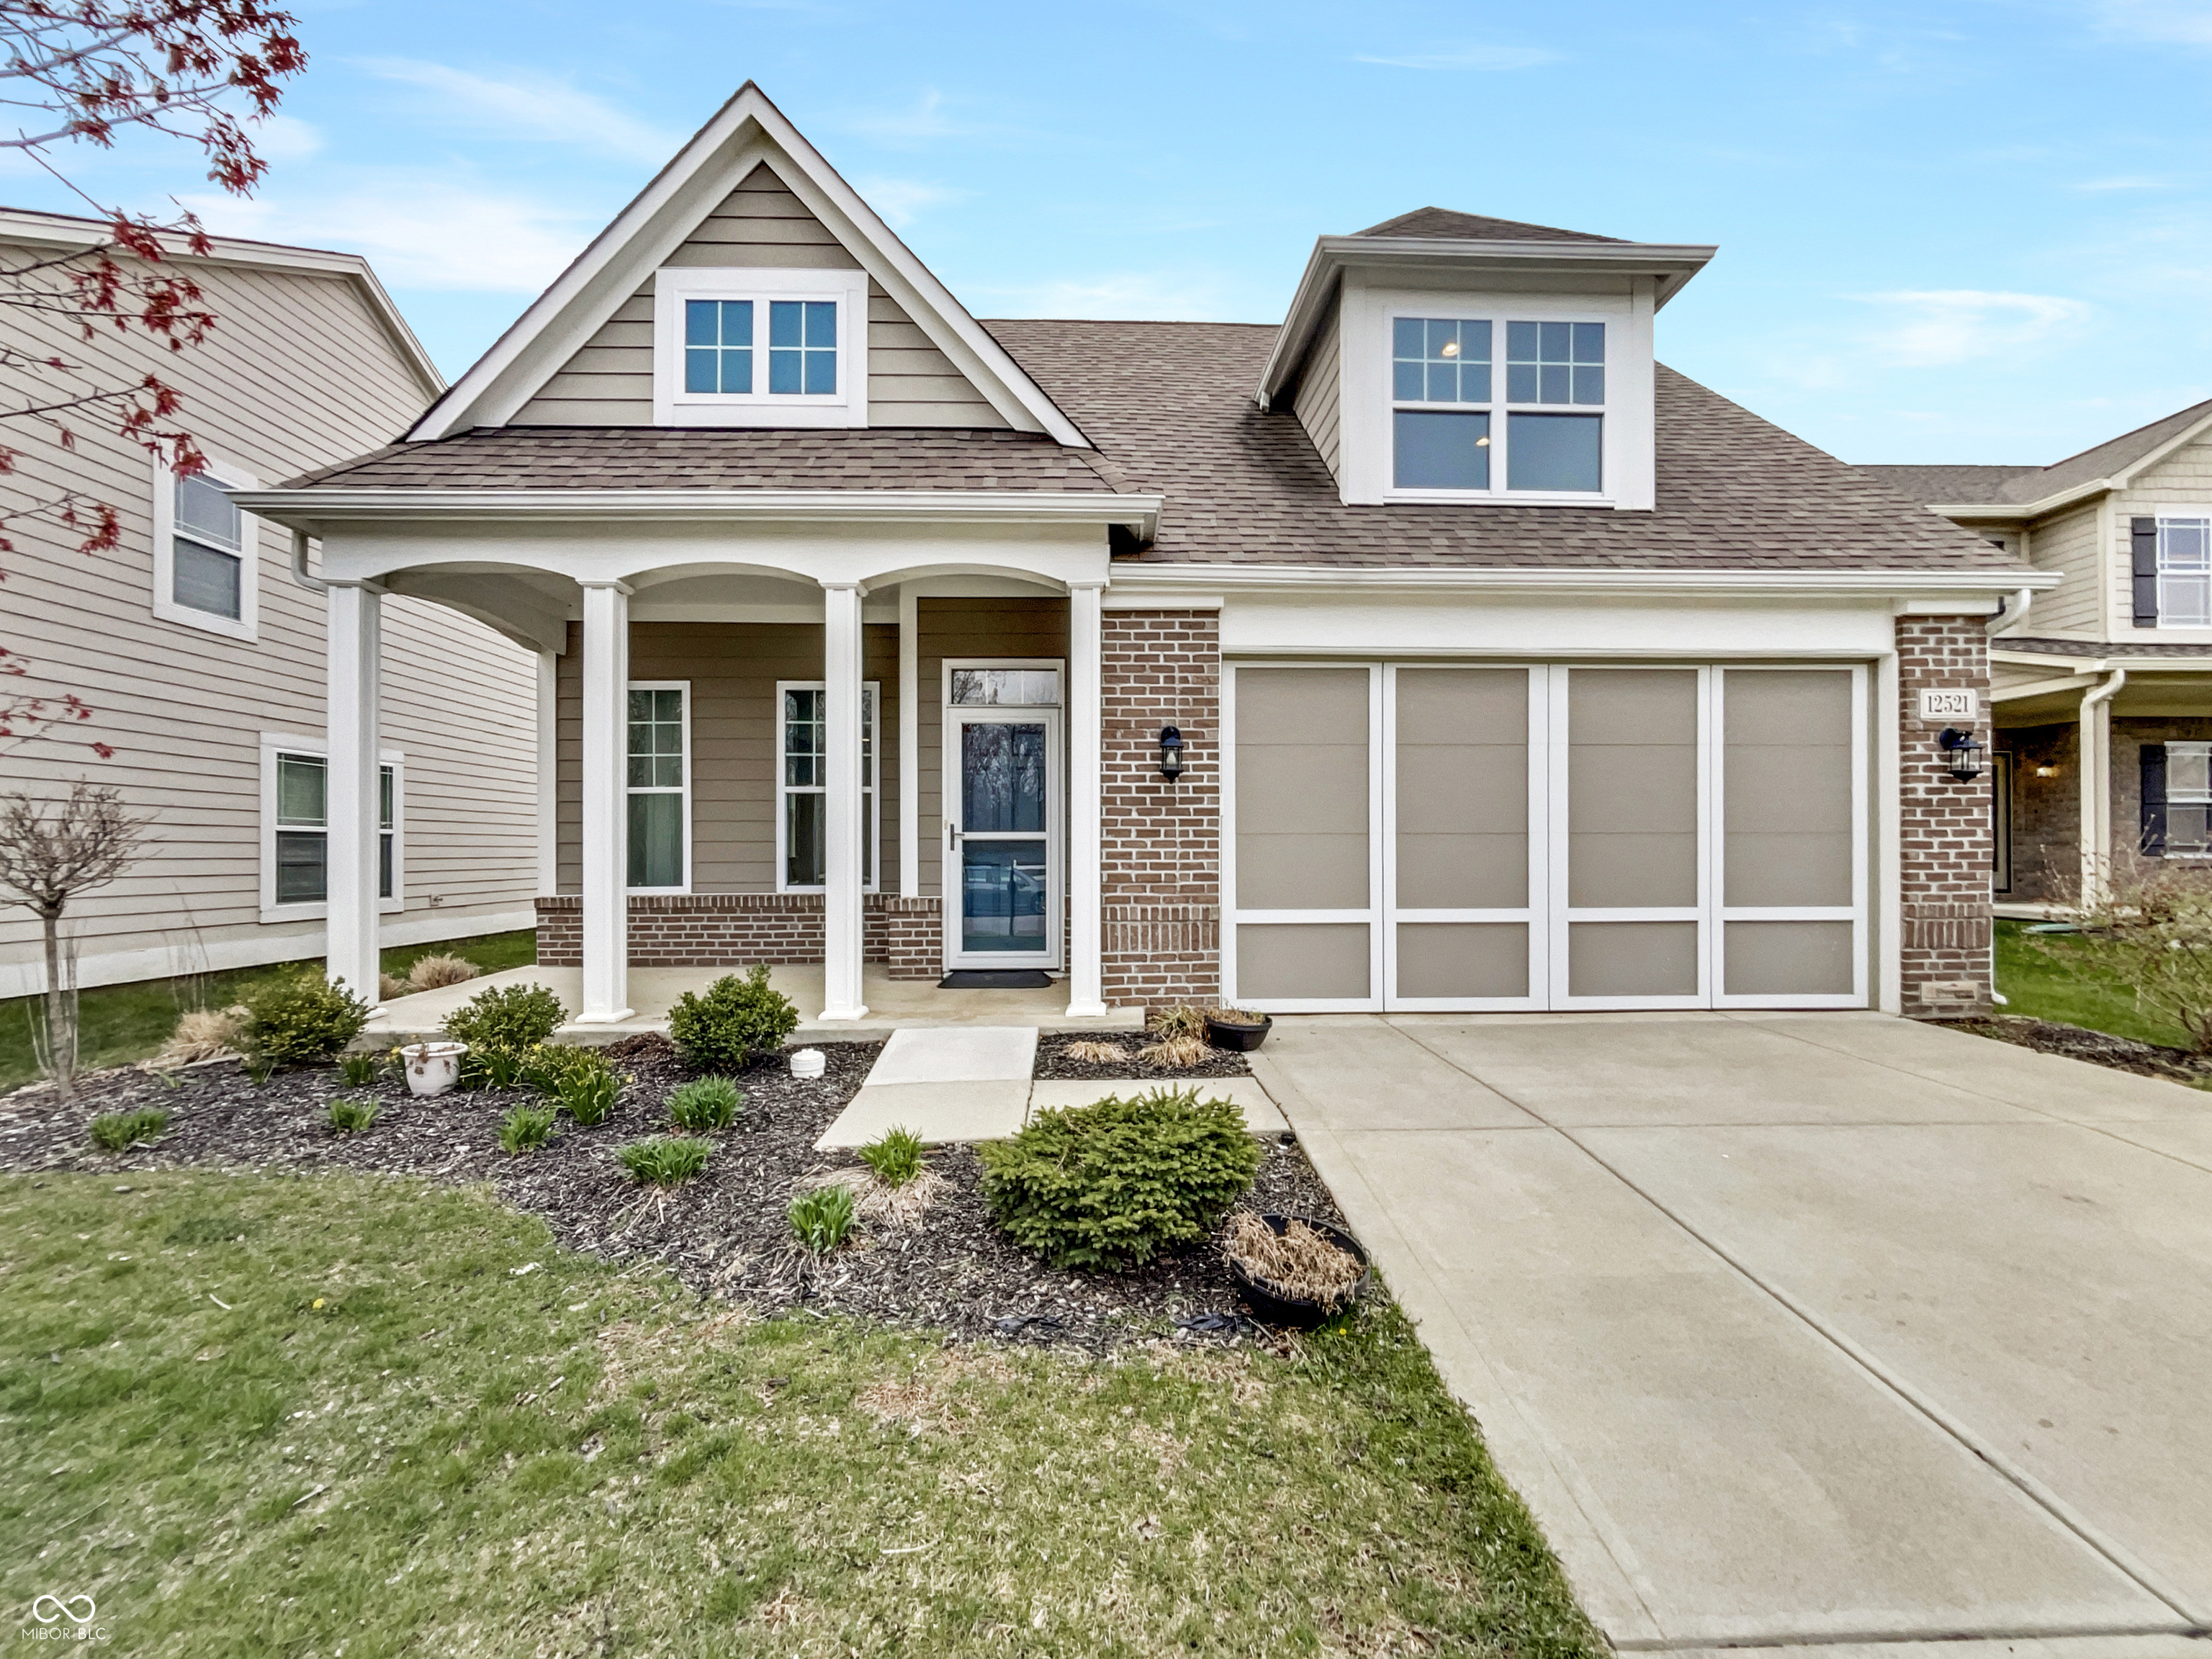
$420,000
3
bds
|
2
ba
|
1,759
sqft
|
built
2015
12521 Hawks Lndg, Fishers, IN 46037
$-407
Cash flow
-5.1%
Cash-on-Cash Return
5.0%
Cap rate
0.6%
Rent to Value Ratio
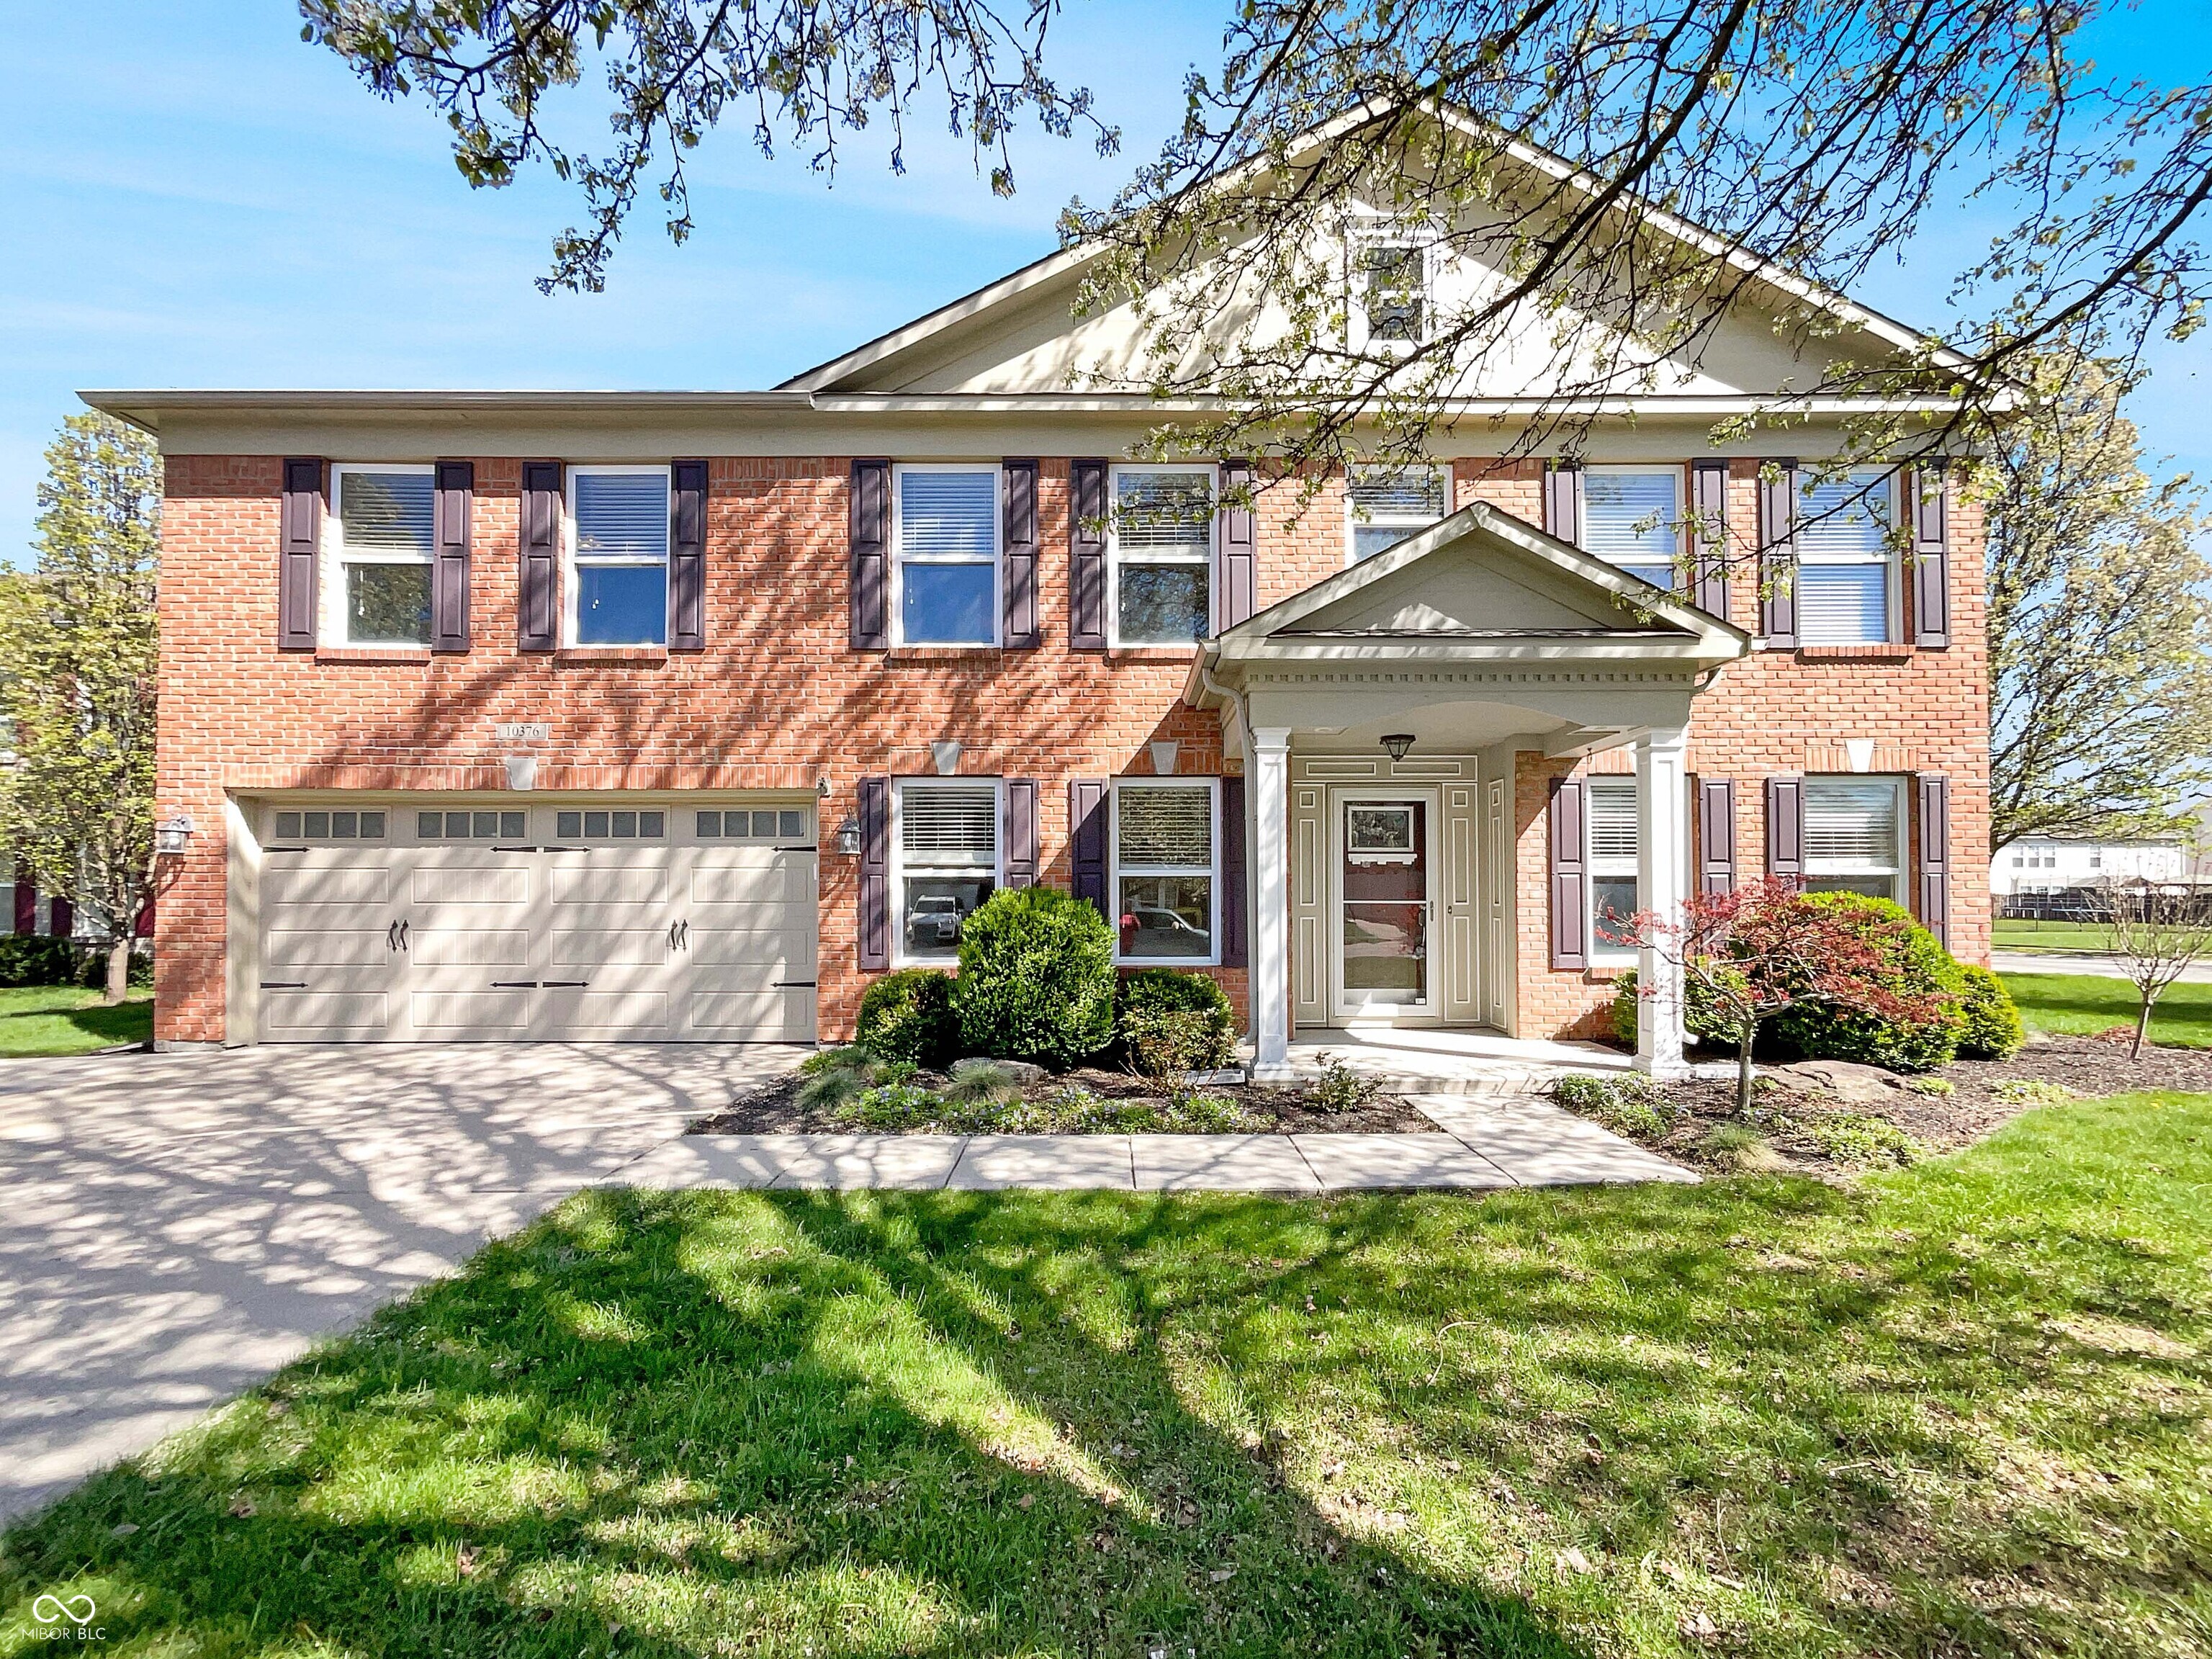
$450,000
4
bds
|
4
ba
|
3,651
sqft
|
built
2001
10376 Alice Ct, Fishers, IN 46038
$-624
Cash flow
-7.2%
Cash-on-Cash Return
4.5%
Cap rate
0.6%
Rent to Value Ratio

$1,100,000
5
bds
|
5
ba
|
6,099
sqft
|
built
2017
15694 Provincial Ln, Fishers, IN 46040
$-1,859
Cash flow
-8.8%
Cash-on-Cash Return
4.1%
Cap rate
0.5%
Rent to Value Ratio
$1,195,000
5
bds
|
5
ba
|
6,451
sqft
|
built
1992
12536 Lowery Way, Fishers, IN 46037
$-3,135
Cash flow
-13.7%
Cash-on-Cash Return
3.0%
Cap rate
0.4%
Rent to Value Ratio

$424,000
3
bds
|
3
ba
|
2,392
sqft
|
built
2020
14474 Treasure Creek Ln, Fishers, IN 46038
$-597
Cash flow
-7.3%
Cash-on-Cash Return
4.5%
Cap rate
0.6%
Rent to Value Ratio
$499,000
2
bds
|
2
ba
|
2,588
sqft
|
built
2007
16156 Oliver St, Fishers, IN 46037
$-826
Cash flow
-8.6%
Cash-on-Cash Return
4.2%
Cap rate
0.6%
Rent to Value Ratio

$630,000
5
bds
|
5
ba
|
3,670
sqft
|
built
2021
12073 Springtide Ln, Fishers, IN 46037
$-822
Cash flow
-6.8%
Cash-on-Cash Return
4.6%
Cap rate
0.6%
Rent to Value Ratio
$2,499,000
6
bds
|
8
ba
|
8,254
sqft
|
built
2002
10821 Club Point Dr, Fishers, IN 46037
$-8,704
Cash flow
-18.2%
Cash-on-Cash Return
2.0%
Cap rate
0.3%
Rent to Value Ratio

$699,900
3
bds
|
3
ba
|
2,898
sqft
|
built
2021
12594 Tidecrest Dr, Fishers, IN 46037
$-210
Cash flow
-1.6%
Cash-on-Cash Return
5.8%
Cap rate
0.7%
Rent to Value Ratio

$429,900
4
bds
|
3
ba
|
2,845
sqft
|
built
2001
10622 Howe Rd, Fishers, IN 46038
$-452
Cash flow
-5.5%
Cash-on-Cash Return
4.9%
Cap rate
0.6%
Rent to Value Ratio
$269,900
3
bds
|
3
ba
|
1,540
sqft
|
built
2014
12683 White Chapel Cir, Fishers, IN 46037
$-193
Cash flow
-3.7%
Cash-on-Cash Return
5.3%
Cap rate
0.7%
Rent to Value Ratio
$269,900
3
bds
|
3
ba
|
1,706
sqft
|
built
1999
9808 Worthington Blvd, Fishers, IN 46038
$-103
Cash flow
-2.0%
Cash-on-Cash Return
5.7%
Cap rate
0.7%
Rent to Value Ratio

$525,000
4
bds
|
3
ba
|
3,140
sqft
|
built
2004
11419 Romeo Pl, Fishers, IN 46040
$-256
Cash flow
-2.5%
Cash-on-Cash Return
5.6%
Cap rate
0.7%
Rent to Value Ratio