Chicago, IL Investment Properties for Sale
Browse homes for sale and investment properties in Chicago, IL. Refine your search by price, property type, or more.
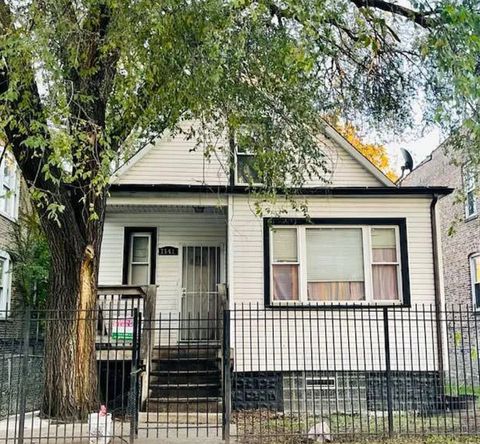
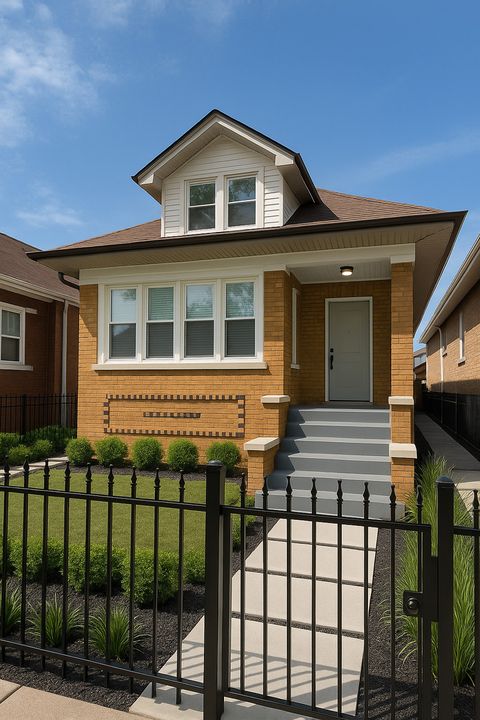
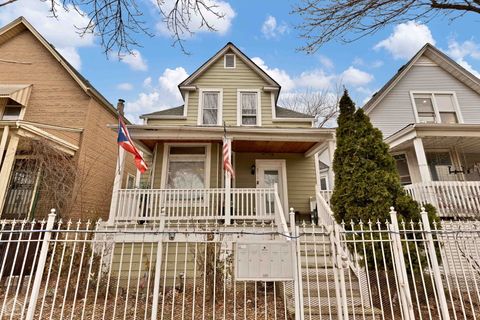
Best cash flowing properties in Chicago, IL
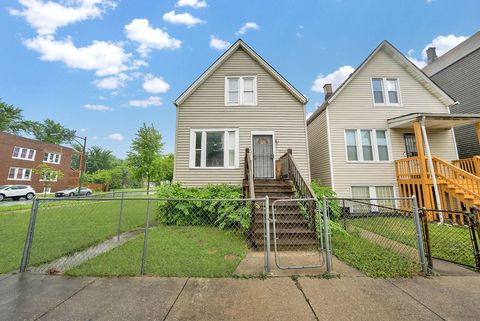
Active
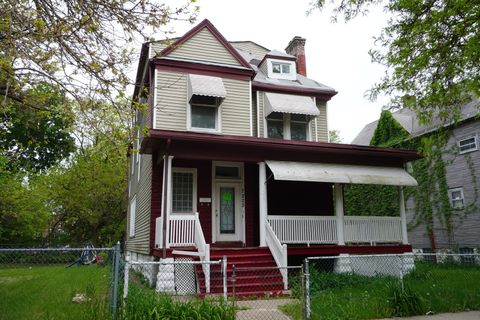
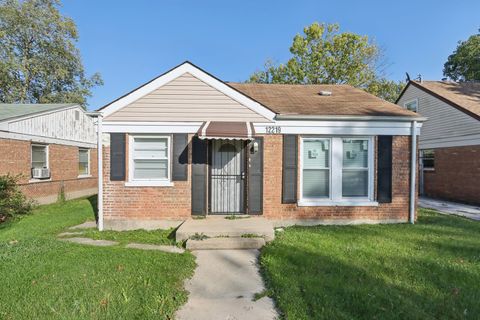
$175,000
7
bds
|
5
ba
|
2,300
sqft
|
built
1883
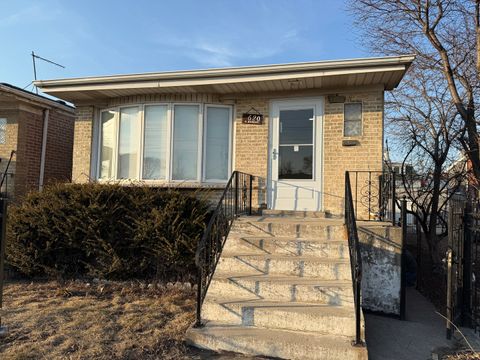
7225 S Princeton Ave, Chicago, IL 60621
$1,473
Cash flow
43.9%
Cash-on-Cash Return
15.8%
Cap rate
2.0%
Rent to Value Ratio
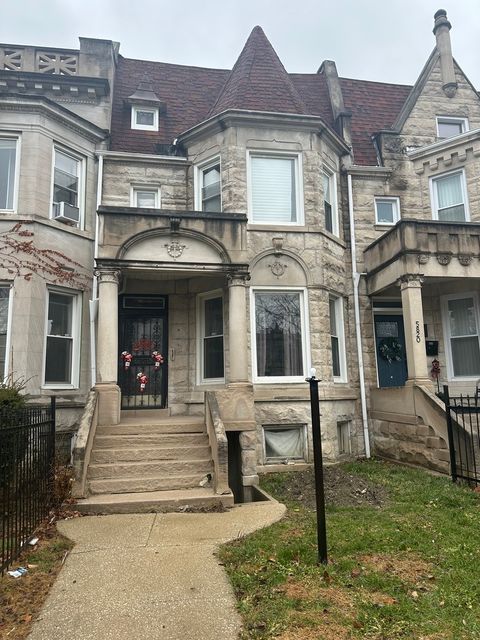
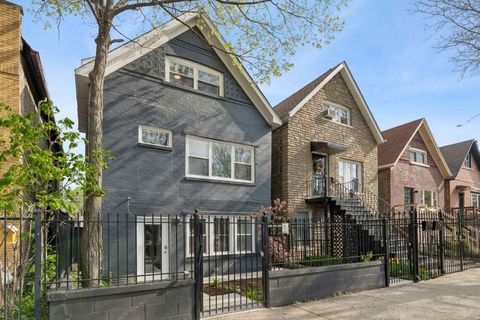
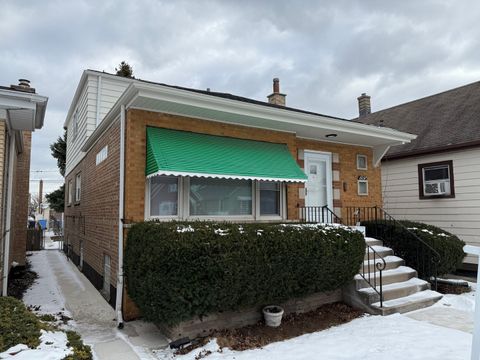
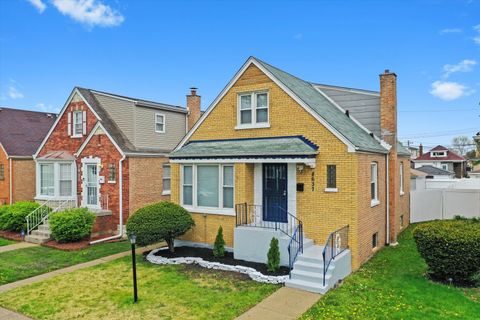
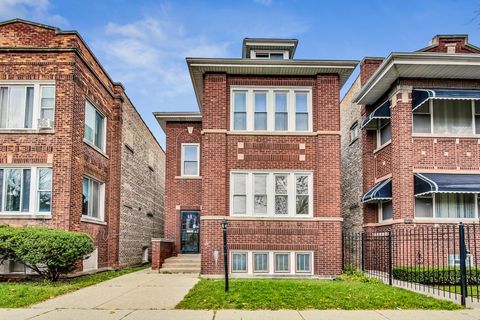
Active
$198,997
4
bds
|
3
ba
|
2,040
sqft
|
built
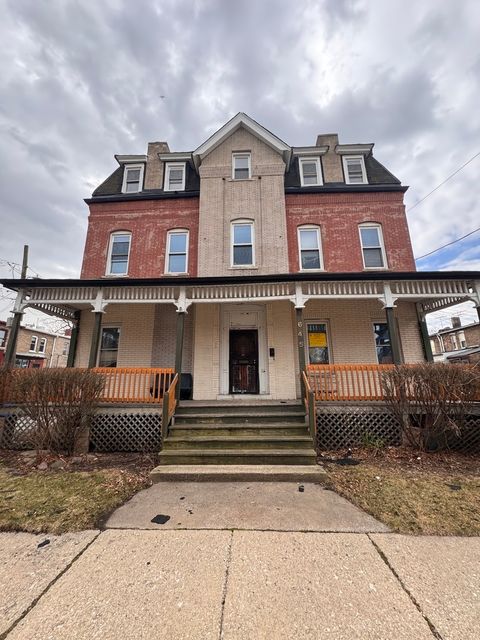
1888
5822 W Washington Blvd, Chicago, IL 60644
$830
Cash flow
21.8%
Cash-on-Cash Return
10.7%
Cap rate
1.5%
Rent to Value Ratio
3,449 out of 4,033 properties for sale in Chicago, IL
Limited Results Shown
Create a free account, or log in to reveal all property listings and enjoy the complete experience.
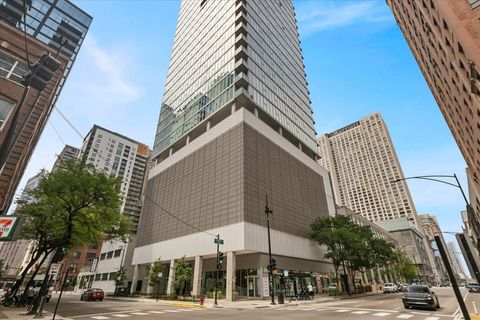
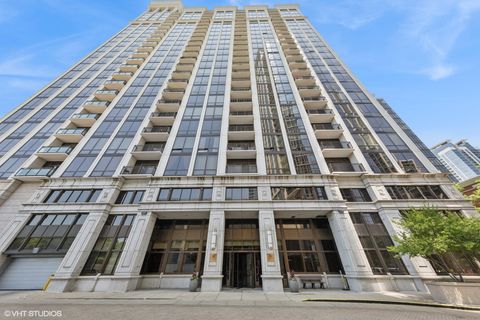
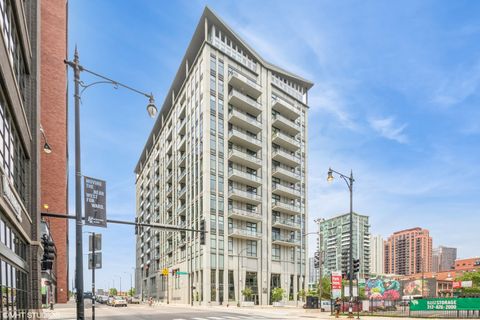
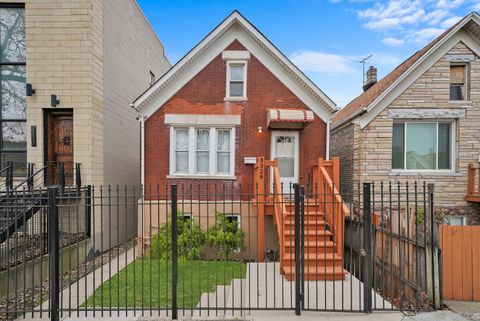
Active
$1,475,000
4
bds
|
3
ba
|
3,200
sqft
|
built
2008
550 N Saint Clair St, Chicago, IL 60611
$-9,278
Cash flow
-32.8%
Cash-on-Cash Return
-1.9%
Cap rate
0.3%
Rent to Value Ratio
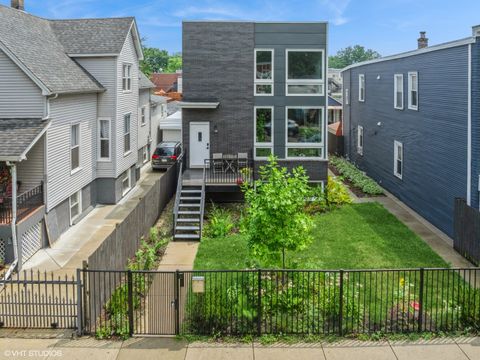
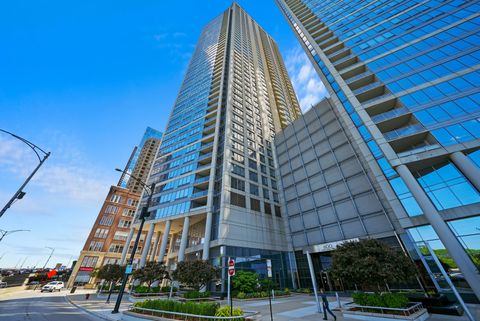
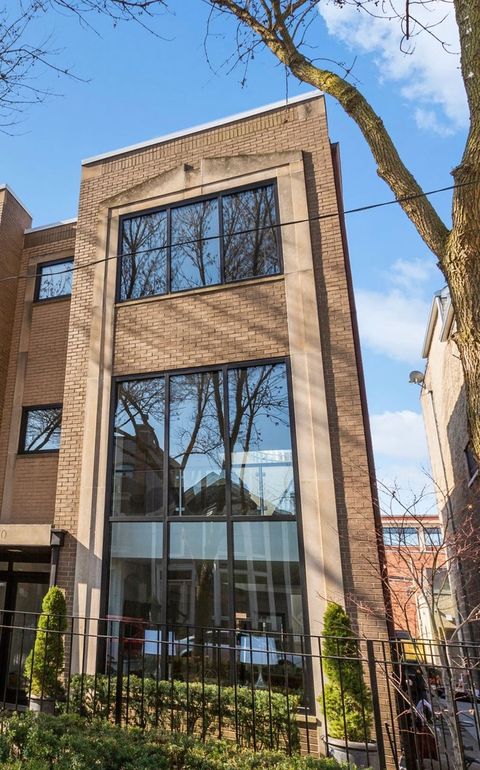
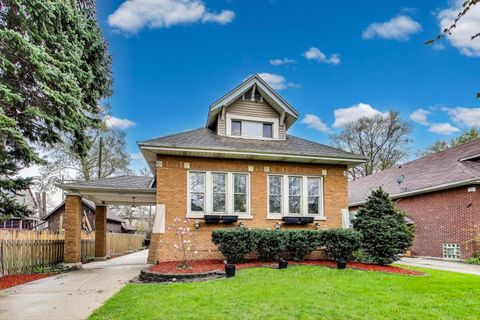
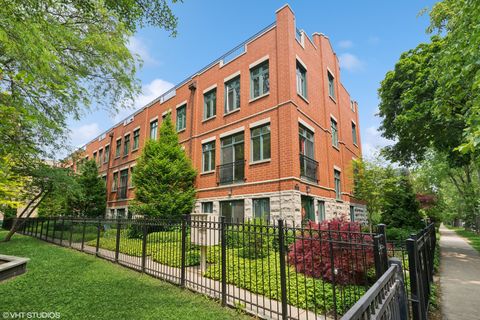
Active
$799,000
3
bds
|
4
ba
|
3,632
sqft
|
built
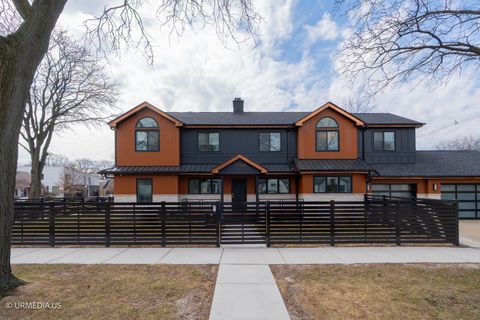
2016
1633 N Saint Louis Ave, Chicago, IL 60647
$-848
Cash flow
-5.5%
Cash-on-Cash Return
4.4%
Cap rate
0.7%
Rent to Value Ratio
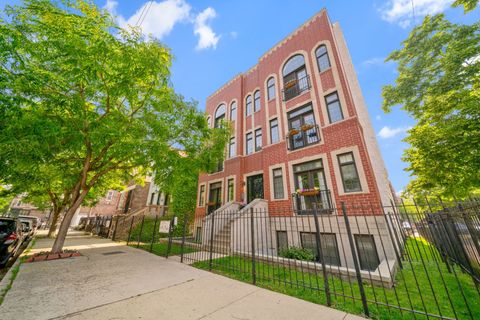
Active
$865,000
5
bds
|
4
ba
|
3,000
sqft
|
built
1888
2534 W Haddon Ave, Chicago, IL 60622
$-1,818
Cash flow
-11.0%
Cash-on-Cash Return
3.2%
Cap rate
0.6%
Rent to Value Ratio
Active
$419,900
2
bds
|
2
ba
|
0
sqft
|
built
2005
233 E 13th St, Chicago, IL 60605
$-1,359
Cash flow
-16.9%
Cash-on-Cash Return
1.8%
Cap rate
0.7%
Rent to Value Ratio
Active
$169,900
5
bds
|
2
ba
|
0
sqft
|
built
1899
7254 S Morgan St, Chicago, IL 60621
$509
Cash flow
15.6%
Cash-on-Cash Return
9.3%
Cap rate
1.2%
Rent to Value Ratio
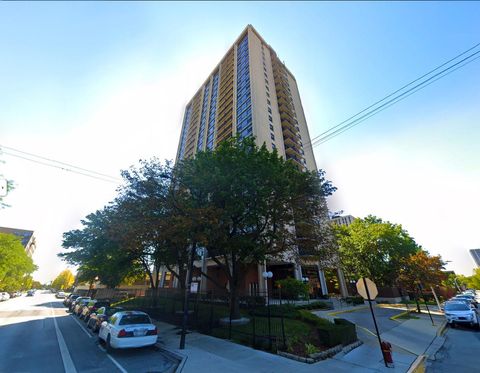
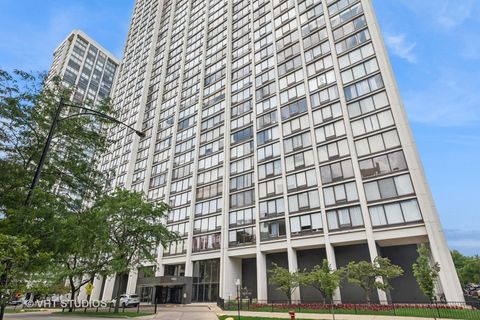
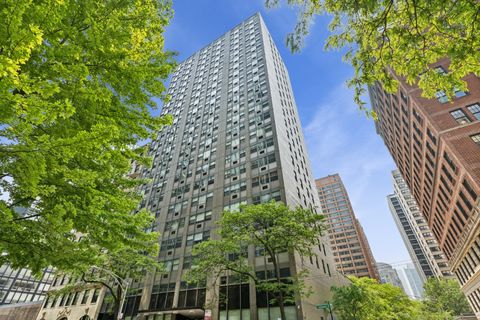
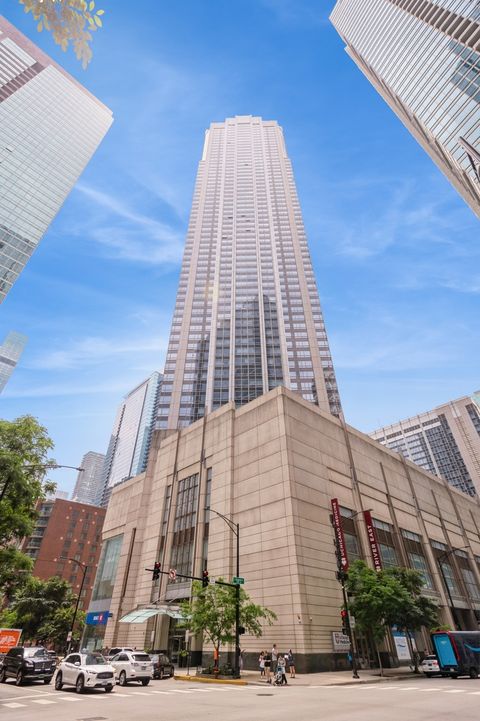
Active
$1,499,000
3
bds
|
4
ba
|
2,540
sqft
|
built
2008
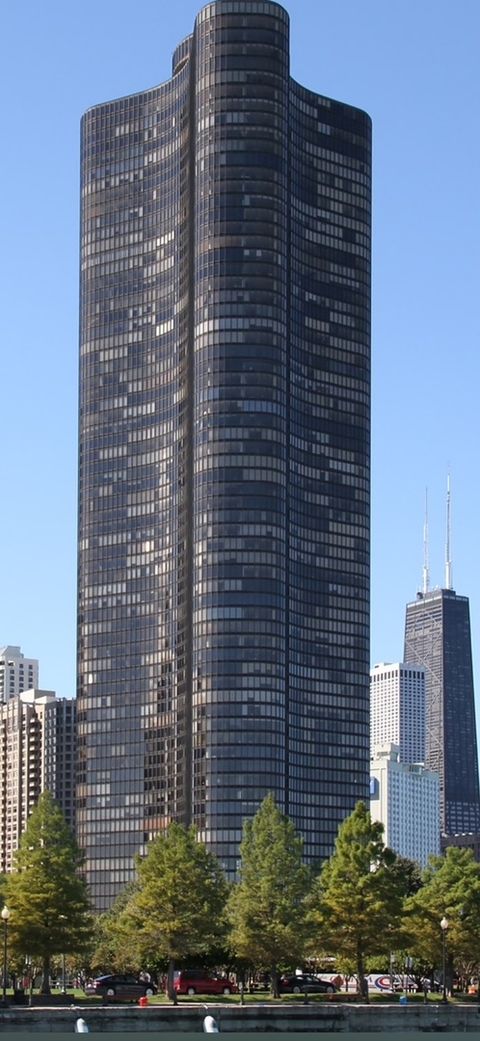
600 N Lake Shore Dr, Chicago, IL 60611
$-5,520
Cash flow
-19.2%
Cash-on-Cash Return
1.3%
Cap rate
0.5%
Rent to Value Ratio
Active
$1,049,999
5
bds
|
4
ba
|
3,408
sqft
|
built
1946
7100 N Sioux Ave, Chicago, IL 60646
$-1,851
Cash flow
-9.2%
Cash-on-Cash Return
3.6%
Cap rate
0.6%
Rent to Value Ratio
Active
$309,900
3
bds
|
2
ba
|
1,600
sqft
|
built
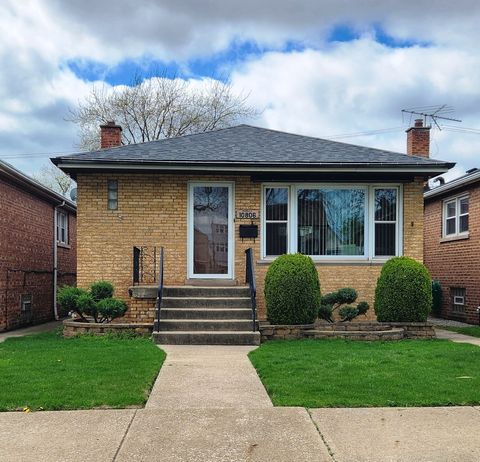
1955
10806 S Avenue O, Chicago, IL 60617
$-193
Cash flow
-3.2%
Cash-on-Cash Return
4.9%
Cap rate
0.6%
Rent to Value Ratio
Active
$125,000
7
bds
|
4
ba
|
0
sqft
|
built
1916
645 E 113th St, Chicago, IL 60628
$421
Cash flow
17.6%
Cash-on-Cash Return
9.7%
Cap rate
1.4%
Rent to Value Ratio
Active
$1,349,000
3
bds
|
3
ba
|
3,200
sqft
|
built
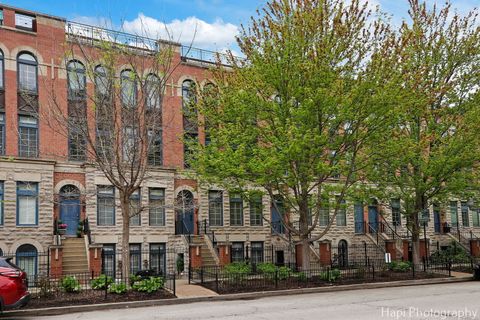
1998
358 W Huron St, Chicago, IL 60654
$-4,414
Cash flow
-17.1%
Cash-on-Cash Return
1.8%
Cap rate
0.5%
Rent to Value Ratio
Active
$167,900
2
bds
|
2
ba
|
1,325
sqft
|
built
1971
2605 S Indiana Ave, Chicago, IL 60616
$-147
Cash flow
-4.6%
Cash-on-Cash Return
4.6%
Cap rate
1.5%
Rent to Value Ratio
Active
$389,000
2
bds
|
2
ba
|
1,200
sqft
|
built
2005
1704 S Carpenter St, Chicago, IL 60608
$-687
Cash flow
-9.2%
Cash-on-Cash Return
3.6%
Cap rate
0.6%
Rent to Value Ratio
Active
$155,000
4
bds
|
2
ba
|
0
sqft
|
built
1903
7541 S Evans Ave, Chicago, IL 60619
$376
Cash flow
12.7%
Cash-on-Cash Return
8.6%
Cap rate
1.2%
Rent to Value Ratio
Active
$1,550,000
3
bds
|
3
ba
|
3,000
sqft
|
built
1989
1850 N Maud Ave, Chicago, IL 60614
$-3,742
Cash flow
-12.6%
Cash-on-Cash Return
2.8%
Cap rate
0.5%
Rent to Value Ratio
Active
$364,875
2
bds
|
2
ba
|
1,225
sqft
|
built
1972
5445 N Sheridan Rd, Chicago, IL 60640
$-965
Cash flow
-13.8%
Cash-on-Cash Return
2.5%
Cap rate
0.8%
Rent to Value Ratio
Active
$249,900
1
bds
|
1
ba
|
750
sqft
|
built
1910
1550 S Indiana Ave, Chicago, IL 60605
$-56
Cash flow
-1.2%
Cash-on-Cash Return
5.4%
Cap rate
1.1%
Rent to Value Ratio
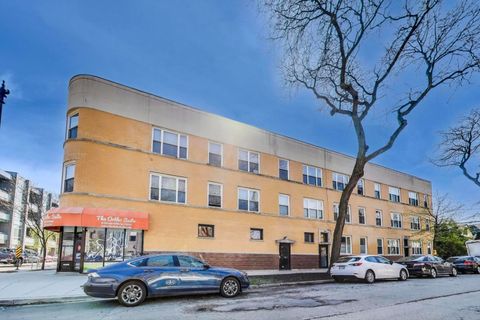
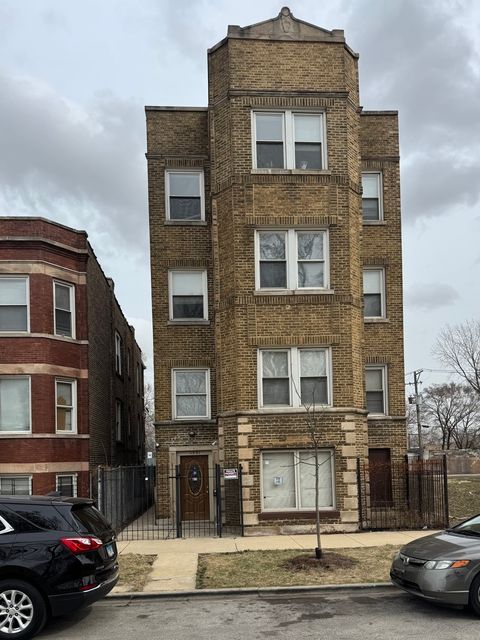
Active
$459,900
6
bds
|
3
ba
|
1,997
sqft
|
built
1917
1428 N Central Ave, Chicago, IL 60651
$-1,221
Cash flow
-13.9%
Cash-on-Cash Return
2.5%
Cap rate
0.4%
Rent to Value Ratio
Active
$459,900
4
bds
|
3
ba
|
2,760
sqft
|
built
1952
6037 S Mason Ave, Chicago, IL 60638
$141
Cash flow
1.6%
Cash-on-Cash Return
6.0%
Cap rate
0.9%
Rent to Value Ratio
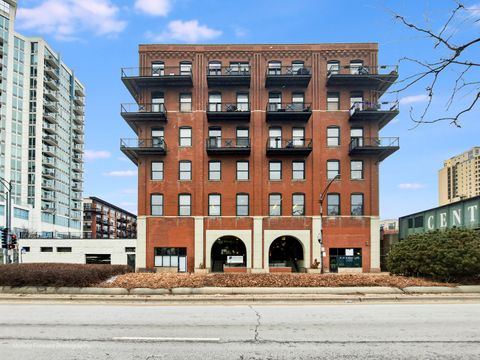
Active
$585,000
2
bds
|
2
ba
|
1,338
sqft
|
built
2007
740 W Fulton St, Chicago, IL 60661
$-1,531
Cash flow
-13.7%
Cash-on-Cash Return
2.5%
Cap rate
0.8%
Rent to Value Ratio
Active
$1,749,000
5
bds
|
6
ba
|
6,263
sqft
|
built
2001
5851 N Newark Ave, Chicago, IL 60631
$-5,614
Cash flow
-16.7%
Cash-on-Cash Return
1.8%
Cap rate
0.4%
Rent to Value Ratio
Active
$210,000
3
bds
|
1
ba
|
2,638
sqft
|
built
1930
8940 S Emerald Ave, Chicago, IL 60620
$670
Cash flow
16.6%
Cash-on-Cash Return
9.5%
Cap rate
1.2%
Rent to Value Ratio
Active
$450,000
3
bds
|
3
ba
|
2,320
sqft
|
built
2003
2515 W Harrison St, Chicago, IL 60612
$-1,204
Cash flow
-14.0%
Cash-on-Cash Return
2.5%
Cap rate
0.6%
Rent to Value Ratio
Active
$99,999
3
bds
|
1
ba
|
880
sqft
|
built
1953
12219 S Throop St, Chicago, IL 60643
$766
Cash flow
40.0%
Cash-on-Cash Return
14.9%
Cap rate
2.0%
Rent to Value Ratio
Active
$344,900
4
bds
|
3
ba
|
2,750
sqft
|
built
1951
8637 S Honore St, Chicago, IL 60620
$-531
Cash flow
-8.0%
Cash-on-Cash Return
3.8%
Cap rate
0.5%
Rent to Value Ratio
Active
$449,000
4
bds
|
2
ba
|
2,000
sqft
|
built
1888
3328 S Damen Ave, Chicago, IL 60608
$-331
Cash flow
-3.8%
Cash-on-Cash Return
4.8%
Cap rate
0.7%
Rent to Value Ratio
Active
$379,900
3
bds
|
2
ba
|
2,108
sqft
|
built
1926
2253 W 110th Pl, Chicago, IL 60643
$172
Cash flow
2.4%
Cash-on-Cash Return
6.2%
Cap rate
0.9%
Rent to Value Ratio
Active
$300,000
2
bds
|
2
ba
|
1,274
sqft
|
built
1917
1949 N Whipple St, Chicago, IL 60647
$-378
Cash flow
-6.6%
Cash-on-Cash Return
4.2%
Cap rate
0.9%
Rent to Value Ratio
Active
$175,000
0
bds
|
1
ba
|
550
sqft
|
built
1957
253 E Delaware Pl, Chicago, IL 60611
$-246
Cash flow
-7.3%
Cash-on-Cash Return
4.0%
Cap rate
1.0%
Rent to Value Ratio
Active
$499,900
4
bds
|
3
ba
|
0
sqft
|
built
1913
3312 N California Ave, Chicago, IL 60618
$-653
Cash flow
-6.8%
Cash-on-Cash Return
4.1%
Cap rate
0.7%
Rent to Value Ratio
Active
$459,000
6
bds
|
2
ba
|
0
sqft
|
built
1924
5092 W Monroe St, Chicago, IL 60644
$-1,169
Cash flow
-13.3%
Cash-on-Cash Return
2.6%
Cap rate
0.4%
Rent to Value Ratio
Active
$449,900
3
bds
|
2
ba
|
1,060
sqft
|
built
1968
2620 W 36th Pl, Chicago, IL 60632
$-1,209
Cash flow
-14.0%
Cash-on-Cash Return
2.5%
Cap rate
0.4%
Rent to Value Ratio
Active
$490,000
5
bds
|
3
ba
|
2,571
sqft
|
built
1929
4517 N Austin Ave, Chicago, IL 60630
$-608
Cash flow
-6.5%
Cash-on-Cash Return
4.2%
Cap rate
0.7%
Rent to Value Ratio
Active
$615,000
2
bds
|
2
ba
|
1,450
sqft
|
built
1968
505 N Lake Shore Dr, Chicago, IL 60611
$-1,938
Cash flow
-16.4%
Cash-on-Cash Return
1.9%
Cap rate
0.7%
Rent to Value Ratio
Active
$689,900
4
bds
|
3
ba
|
3,500
sqft
|
built
1951
5938 N Sacramento Ave, Chicago, IL 60659
$-1,984
Cash flow
-15.0%
Cash-on-Cash Return
2.2%
Cap rate
0.4%
Rent to Value Ratio
Active
$485,000
2
bds
|
2
ba
|
1,241
sqft
|
built
2000
630 N State St, Chicago, IL 60654
$-1,580
Cash flow
-17.0%
Cash-on-Cash Return
1.8%
Cap rate
0.7%
Rent to Value Ratio
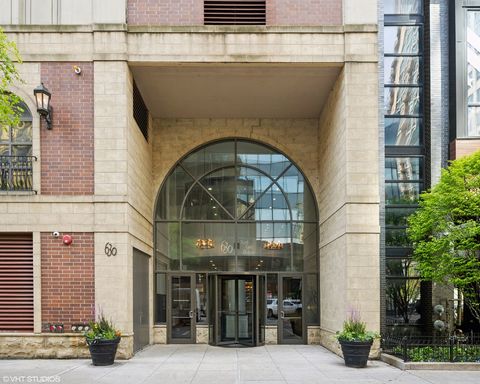
Active
$325,000
1
bds
|
1
ba
|
920
sqft
|
built
2001
512 N Mc Clurg Ct, Chicago, IL 60611
$-793
Cash flow
-12.7%
Cash-on-Cash Return
2.8%
Cap rate
0.8%
Rent to Value Ratio
Active
$759,000
12
bds
|
7
ba
|
0
sqft
|
built
1920
1531 S Kolin Ave, Chicago, IL 60623
$-2,671
Cash flow
-18.4%
Cash-on-Cash Return
1.5%
Cap rate
0.3%
Rent to Value Ratio
Active
$710,000
3
bds
|
3
ba
|
2,400
sqft
|
built
1999
5414 S Greenwood Ave, Chicago, IL 60615
$-1,437
Cash flow
-10.6%
Cash-on-Cash Return
3.3%
Cap rate
0.6%
Rent to Value Ratio