Baton Rouge, LA Investment Properties for Sale
Browse homes for sale and investment properties in Baton Rouge, LA. Refine your search by price, property type, or more.
Best cash flowing properties in Baton Rouge, LA
Active
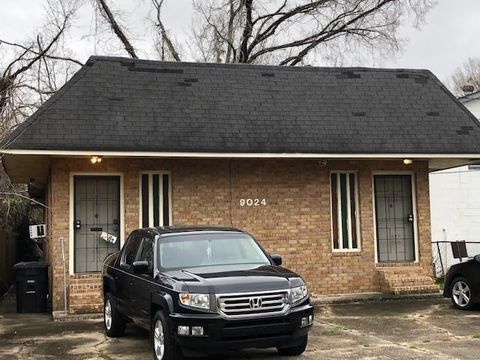
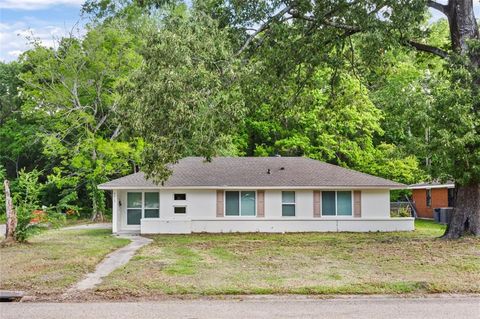
$36,500
3
bds
|
2
ba
|
1,624
sqft
|
built
1982
9024 Scenic Hwy, Baton Rouge, LA 70807
$759
Cash flow
24.2%
Cash-on-Cash Return
25.0%
Cap rate
3.0%
Rent to Value Ratio

Active
$189,000
3
bds
|
3
ba
|
1,533
sqft
|
built
2010
1362 Brightside Dr, Baton Rouge, LA 70820
$486
Cash flow
13.4%
Cash-on-Cash Return
8.8%
Cap rate
1.1%
Rent to Value Ratio
944 out of 1,210 properties for sale in Baton Rouge, LA
Limited Results Shown
Create a free account, or log in to reveal all property listings and enjoy the complete experience.
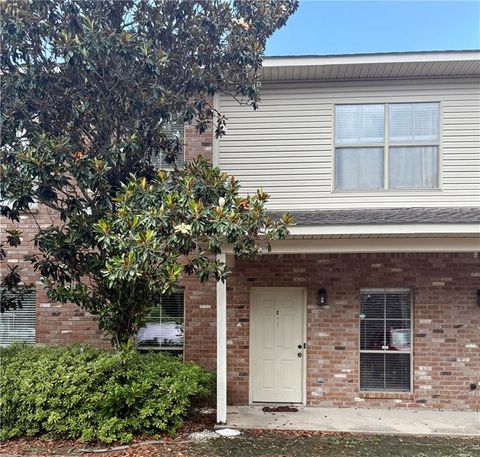
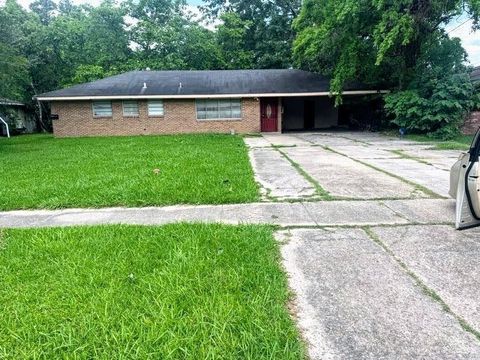
Active
$129,000
2
bds
|
2
ba
|
1,100
sqft
|
built
2008
818 Meadow Bend Dr, Baton Rouge, LA 70820
$224
Cash flow
9.1%
Cash-on-Cash Return
8.3%
Cap rate
1.0%
Rent to Value Ratio
Active
$510,000
4
bds
|
4
ba
|
2,327
sqft
|
built
2004
921 Carriage Way, Baton Rouge, LA 70808
$-141
Cash flow
-1.4%
Cash-on-Cash Return
5.3%
Cap rate
0.6%
Rent to Value Ratio
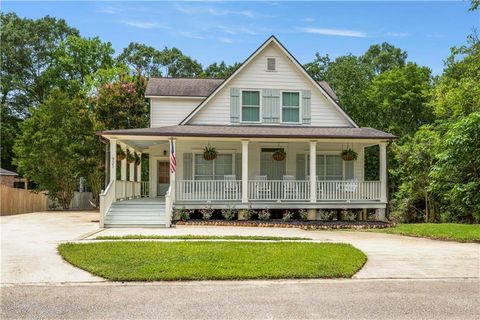
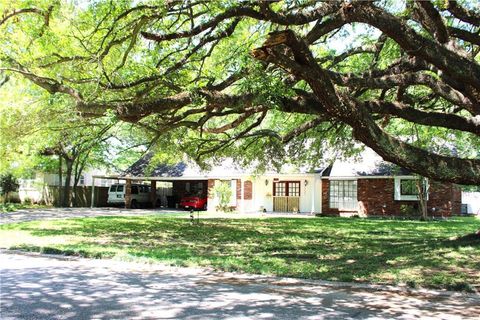
Active
$199,900
4
bds
|
2
ba
|
1,989
sqft
|
built
1950
1435 Monterrey Blvd, Baton Rouge, LA 70815
$198
Cash flow
5.2%
Cash-on-Cash Return
7.5%
Cap rate
0.9%
Rent to Value Ratio
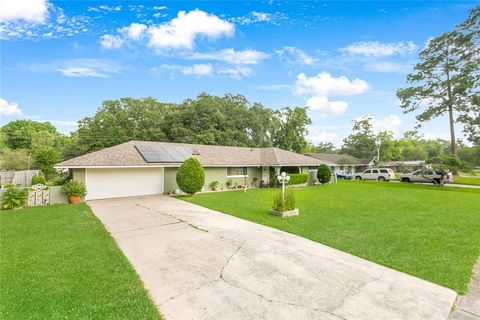
Active
$425,000
4
bds
|
3
ba
|
2,374
sqft
|
built
2013
15314 Mistybrook Dr, Baton Rouge, LA 70816
$-438
Cash flow
-5.4%
Cash-on-Cash Return
5.0%
Cap rate
0.6%
Rent to Value Ratio
Active
$179,000
2
bds
|
3
ba
|
1,374
sqft
|
built
2004
5191 Arlington Ct, Baton Rouge, LA 70820
$25
Cash flow
0.7%
Cash-on-Cash Return
6.4%
Cap rate
0.8%
Rent to Value Ratio
Active
$140,000
3
bds
|
2
ba
|
1,200
sqft
|
built
1970
272 W Harrison St, Baton Rouge, LA 70802
$234
Cash flow
8.7%
Cash-on-Cash Return
7.7%
Cap rate
0.9%
Rent to Value Ratio
Active
$265,000
4
bds
|
0
ba
|
2,161
sqft
|
built
1930
214 16 N 12 Th Street, Baton Rouge, LA 70802
$0
Cash flow
n/a
Cash-on-Cash Return
n/a
Cap rate
n/a
Rent to Value Ratio
Active
$295,000
3
bds
|
2
ba
|
1,667
sqft
|
built
2016
17509 Waterloo Dr, Baton Rouge, LA 70817
$-399
Cash flow
-7.1%
Cash-on-Cash Return
4.6%
Cap rate
0.6%
Rent to Value Ratio
Active
$650,000
4
bds
|
4
ba
|
3,149
sqft
|
built
1993
647 Highland Oaks Dr, Baton Rouge, LA 70810
$-686
Cash flow
-5.5%
Cash-on-Cash Return
4.4%
Cap rate
0.5%
Rent to Value Ratio
Active
$328,900
4
bds
|
3
ba
|
1,833
sqft
|
built
2021
7248 Kenilworth Crossing Ave, Baton Rouge, LA 70820
$331
Cash flow
5.3%
Cash-on-Cash Return
6.9%
Cap rate
0.9%
Rent to Value Ratio

Active
$158,900
1
bds
|
1
ba
|
763
sqft
|
built
2005
6765 Corporate Blvd, Baton Rouge, LA 70809
$7
Cash flow
0.2%
Cash-on-Cash Return
5.7%
Cap rate
0.7%
Rent to Value Ratio
Active
$267,000
3
bds
|
4
ba
|
1,901
sqft
|
built
2008
8000 Stonelake Village Ave, Baton Rouge, LA 70820
$185
Cash flow
3.6%
Cash-on-Cash Return
6.5%
Cap rate
0.8%
Rent to Value Ratio
Active
$285,000
4
bds
|
2
ba
|
1,633
sqft
|
built
2006
3346 Southlake Ave, Baton Rouge, LA 70810
$-11
Cash flow
-0.2%
Cash-on-Cash Return
5.6%
Cap rate
0.7%
Rent to Value Ratio
Active
$193,500
3
bds
|
2
ba
|
1,554
sqft
|
built
2004
4441 Burbank Dr, Baton Rouge, LA 70820
$188
Cash flow
5.1%
Cash-on-Cash Return
6.8%
Cap rate
0.8%
Rent to Value Ratio

Active
$224,000
3
bds
|
3
ba
|
1,555
sqft
|
built
2004
5315 Arlington Ct, Baton Rouge, LA 70820
$107
Cash flow
2.5%
Cash-on-Cash Return
6.3%
Cap rate
0.8%
Rent to Value Ratio
Active
$169,999
2
bds
|
2
ba
|
1,221
sqft
|
built
1999
710 E Boyd Dr, Baton Rouge, LA 70808
$162
Cash flow
5.0%
Cash-on-Cash Return
6.8%
Cap rate
0.8%
Rent to Value Ratio
Active
$210,000
3
bds
|
2
ba
|
1,656
sqft
|
built
1970
8554 S Essen Heights Ct, Baton Rouge, LA 70809
$317
Cash flow
7.9%
Cash-on-Cash Return
7.5%
Cap rate
0.9%
Rent to Value Ratio
Active
$185,000
3
bds
|
2
ba
|
1,270
sqft
|
built
1957
6815 Calumet St, Baton Rouge, LA 70805
$-185
Cash flow
-5.2%
Cash-on-Cash Return
4.5%
Cap rate
0.5%
Rent to Value Ratio
Active
$115,000
3
bds
|
2
ba
|
1,116
sqft
|
built
1967
3076 Elgin St, Baton Rouge, LA 70805
$353
Cash flow
16.0%
Cash-on-Cash Return
9.4%
Cap rate
1.1%
Rent to Value Ratio

Active
$290,000
4
bds
|
2
ba
|
1,987
sqft
|
built
1987
14648 Bailey Dr, Baton Rouge, LA 70816
$146
Cash flow
2.6%
Cash-on-Cash Return
6.3%
Cap rate
0.8%
Rent to Value Ratio
Active
$250,000
4
bds
|
4
ba
|
2,800
sqft
|
built
1985
5525 S Afton Pkwy, Baton Rouge, LA 70806
$59
Cash flow
1.2%
Cash-on-Cash Return
6.0%
Cap rate
0.7%
Rent to Value Ratio
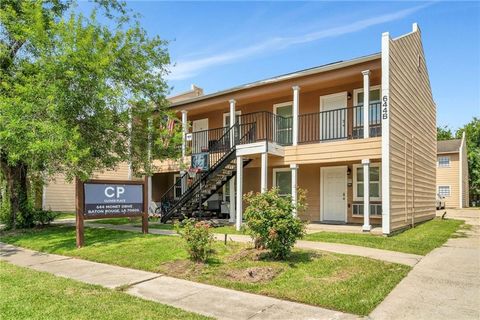
Active
$1,900,000
24
bds
|
0
ba
|
9,600
sqft
|
built
1984
644 Monet Dr, Baton Rouge, LA 70806
$-8,508
Cash flow
-23.4%
Cash-on-Cash Return
0.3%
Cap rate
0.0%
Rent to Value Ratio
Active
$205,000
3
bds
|
2
ba
|
1,748
sqft
|
built
1965
9180 Dancy Ave, Baton Rouge, LA 70814
$134
Cash flow
3.4%
Cash-on-Cash Return
6.5%
Cap rate
0.8%
Rent to Value Ratio

Active
$220,000
6
bds
|
0
ba
|
2,900
sqft
|
built
1982
782-784 Holt Drive, Baton Rouge, LA 70815
$0
Cash flow
n/a
Cash-on-Cash Return
n/a
Cap rate
n/a
Rent to Value Ratio

Active
$220,000
6
bds
|
0
ba
|
2,900
sqft
|
built
1982
774-776 Holt Drive, Baton Rouge, LA 70815
$0
Cash flow
n/a
Cash-on-Cash Return
n/a
Cap rate
n/a
Rent to Value Ratio

Active
$134,900
2
bds
|
3
ba
|
1,330
sqft
|
built
1995
4624 Parkoaks Dr, Baton Rouge, LA 70816
$78
Cash flow
3.0%
Cash-on-Cash Return
6.4%
Cap rate
1.0%
Rent to Value Ratio

Active
$69,500
1
bds
|
1
ba
|
671
sqft
|
built
2005
2045 N Third Street, Baton Rouge, LA 70802
$0
Cash flow
n/a
Cash-on-Cash Return
n/a
Cap rate
n/a
Rent to Value Ratio

Active
$169,500
1
bds
|
1
ba
|
988
sqft
|
built
2004
6765 Corporate Blvd, Baton Rouge, LA 70809
$164
Cash flow
5.0%
Cash-on-Cash Return
6.8%
Cap rate
0.8%
Rent to Value Ratio
Active
$220,000
4
bds
|
0
ba
|
1,703
sqft
|
built
2389 Tennessee St, Baton Rouge, LA 70802
$-75
Cash flow
-1.8%
Cash-on-Cash Return
5.3%
Cap rate
0.6%
Rent to Value Ratio
Active
$85,000
2
bds
|
3
ba
|
1,260
sqft
|
built
1992
1781 Boulevard De Province, Baton Rouge, LA 70816
$87
Cash flow
5.3%
Cash-on-Cash Return
6.9%
Cap rate
1.3%
Rent to Value Ratio

Active
$650,000
20
bds
|
0
ba
|
6,692
sqft
|
built
1975
4708 Tigerland Ave, Baton Rouge, LA 70820
$-1,351
Cash flow
-10.8%
Cash-on-Cash Return
3.2%
Cap rate
0.4%
Rent to Value Ratio

Active
$354,900
4
bds
|
3
ba
|
2,212
sqft
|
built
1978
1431 Oakferd Dr, Baton Rouge, LA 70810
$115
Cash flow
1.7%
Cash-on-Cash Return
6.1%
Cap rate
0.7%
Rent to Value Ratio

Active
$336,900
3
bds
|
2
ba
|
1,782
sqft
|
built
2017
2637 Cresthaven Ave, Baton Rouge, LA 70810
$-565
Cash flow
-8.7%
Cash-on-Cash Return
3.7%
Cap rate
0.5%
Rent to Value Ratio
Active
$689,000
4
bds
|
4
ba
|
2,659
sqft
|
built
2020
5341 Mimosa St, Baton Rouge, LA 70808
$-2
Cash flow
0.0%
Cash-on-Cash Return
5.7%
Cap rate
0.7%
Rent to Value Ratio

Active
$669,000
4
bds
|
4
ba
|
3,843
sqft
|
built
1993
5802 Highland Rd, Baton Rouge, LA 70808
$-406
Cash flow
-3.2%
Cash-on-Cash Return
5.0%
Cap rate
0.6%
Rent to Value Ratio
Active
$315,000
3
bds
|
3
ba
|
2,625
sqft
|
built
2009
2009 Lac Cache Ct, Baton Rouge, LA 70816
$-219
Cash flow
-3.6%
Cash-on-Cash Return
4.8%
Cap rate
0.6%
Rent to Value Ratio
Active
$659,900
6
bds
|
5
ba
|
3,539
sqft
|
built
1994
10813 N Oak Hills Pkwy, Baton Rouge, LA 70810
$-453
Cash flow
-3.6%
Cash-on-Cash Return
4.9%
Cap rate
0.6%
Rent to Value Ratio

Active
$490,000
3
bds
|
2
ba
|
2,638
sqft
|
built
1916
2122 Government St, Baton Rouge, LA 70806
$-180
Cash flow
-1.9%
Cash-on-Cash Return
5.2%
Cap rate
0.6%
Rent to Value Ratio