Davidson County Investment Properties for Sale
Browse homes for sale and investment properties in Davidson County. Refine your search by price, property type, or more.
Best cash flowing properties in Davidson County
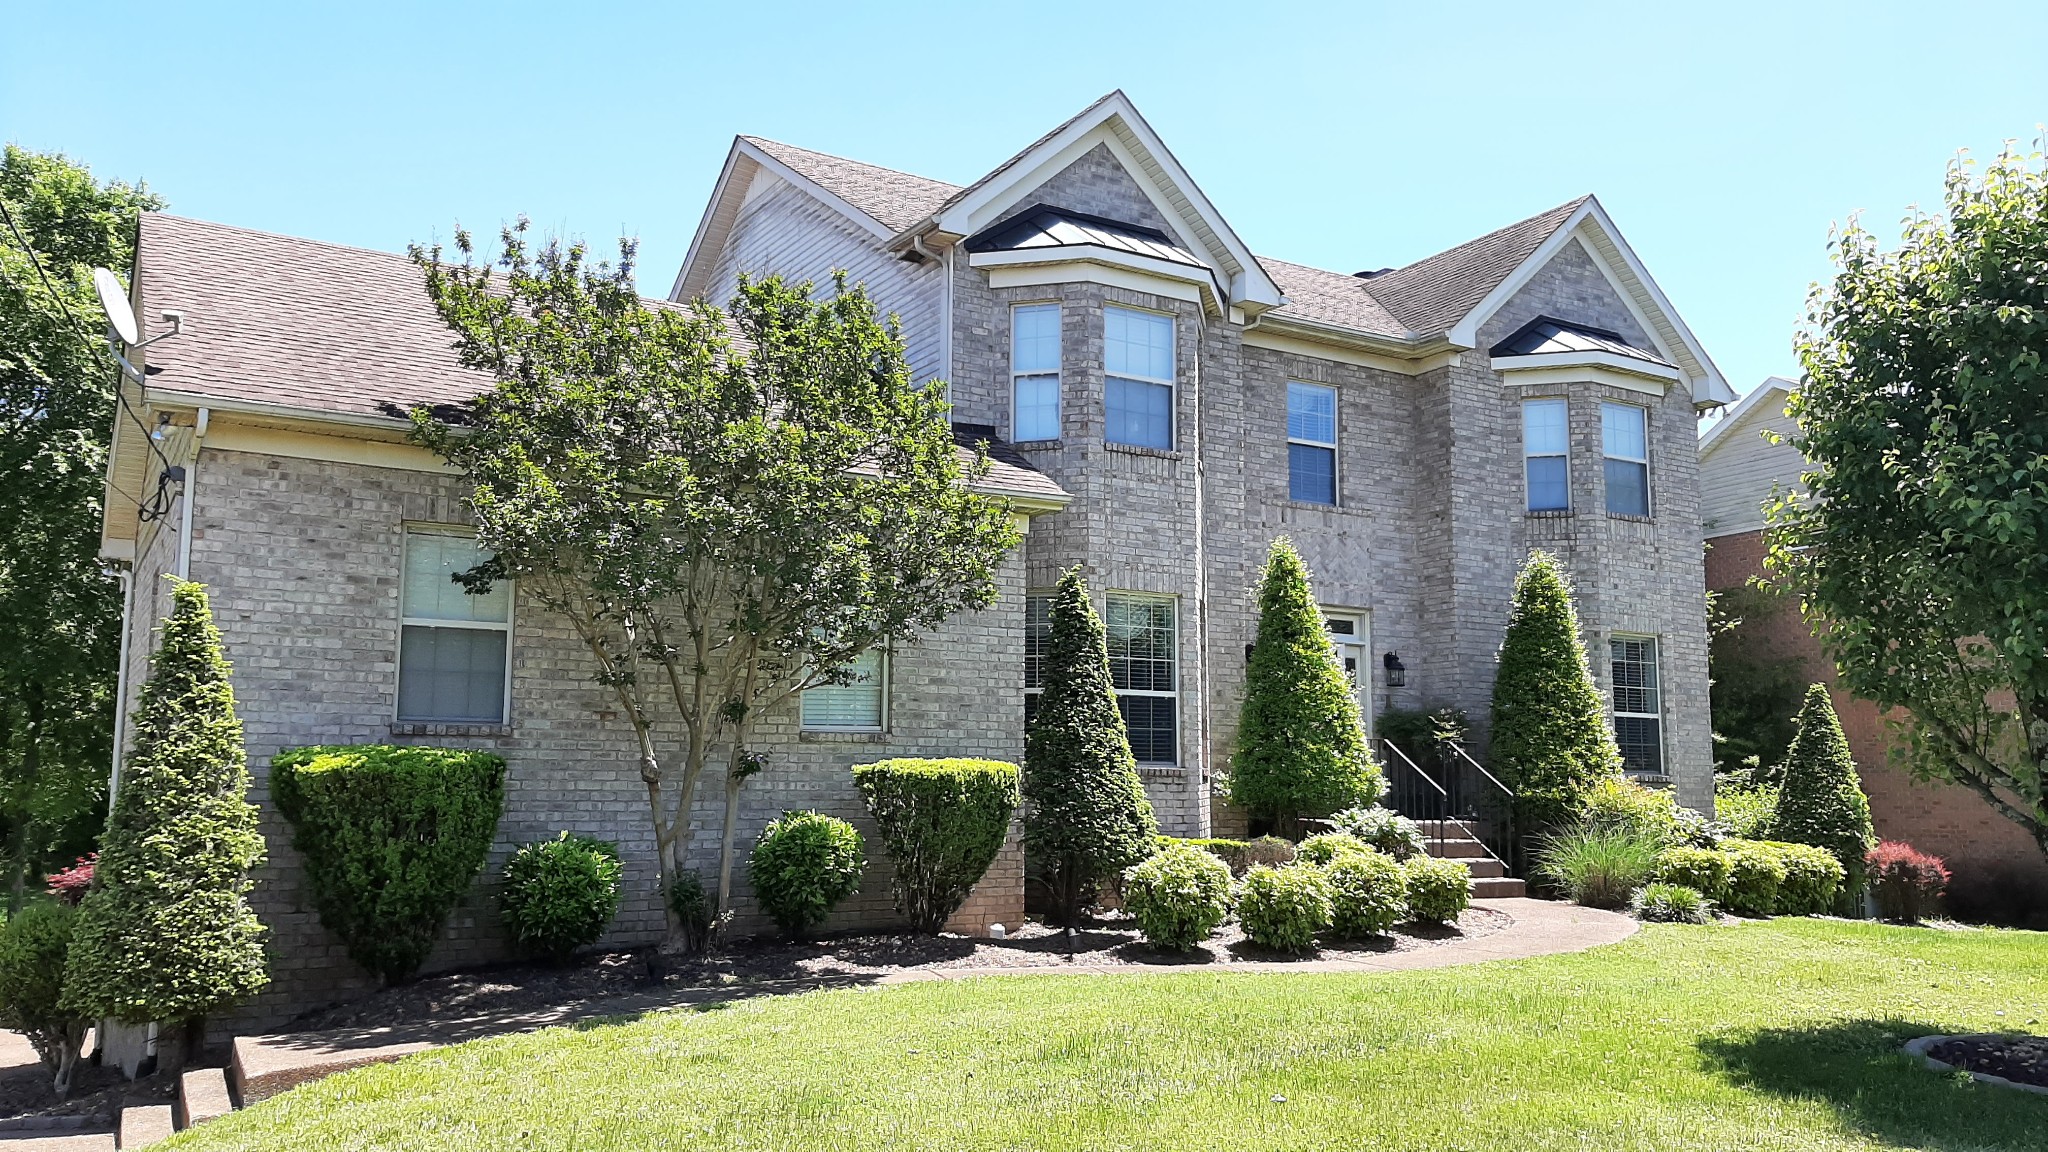
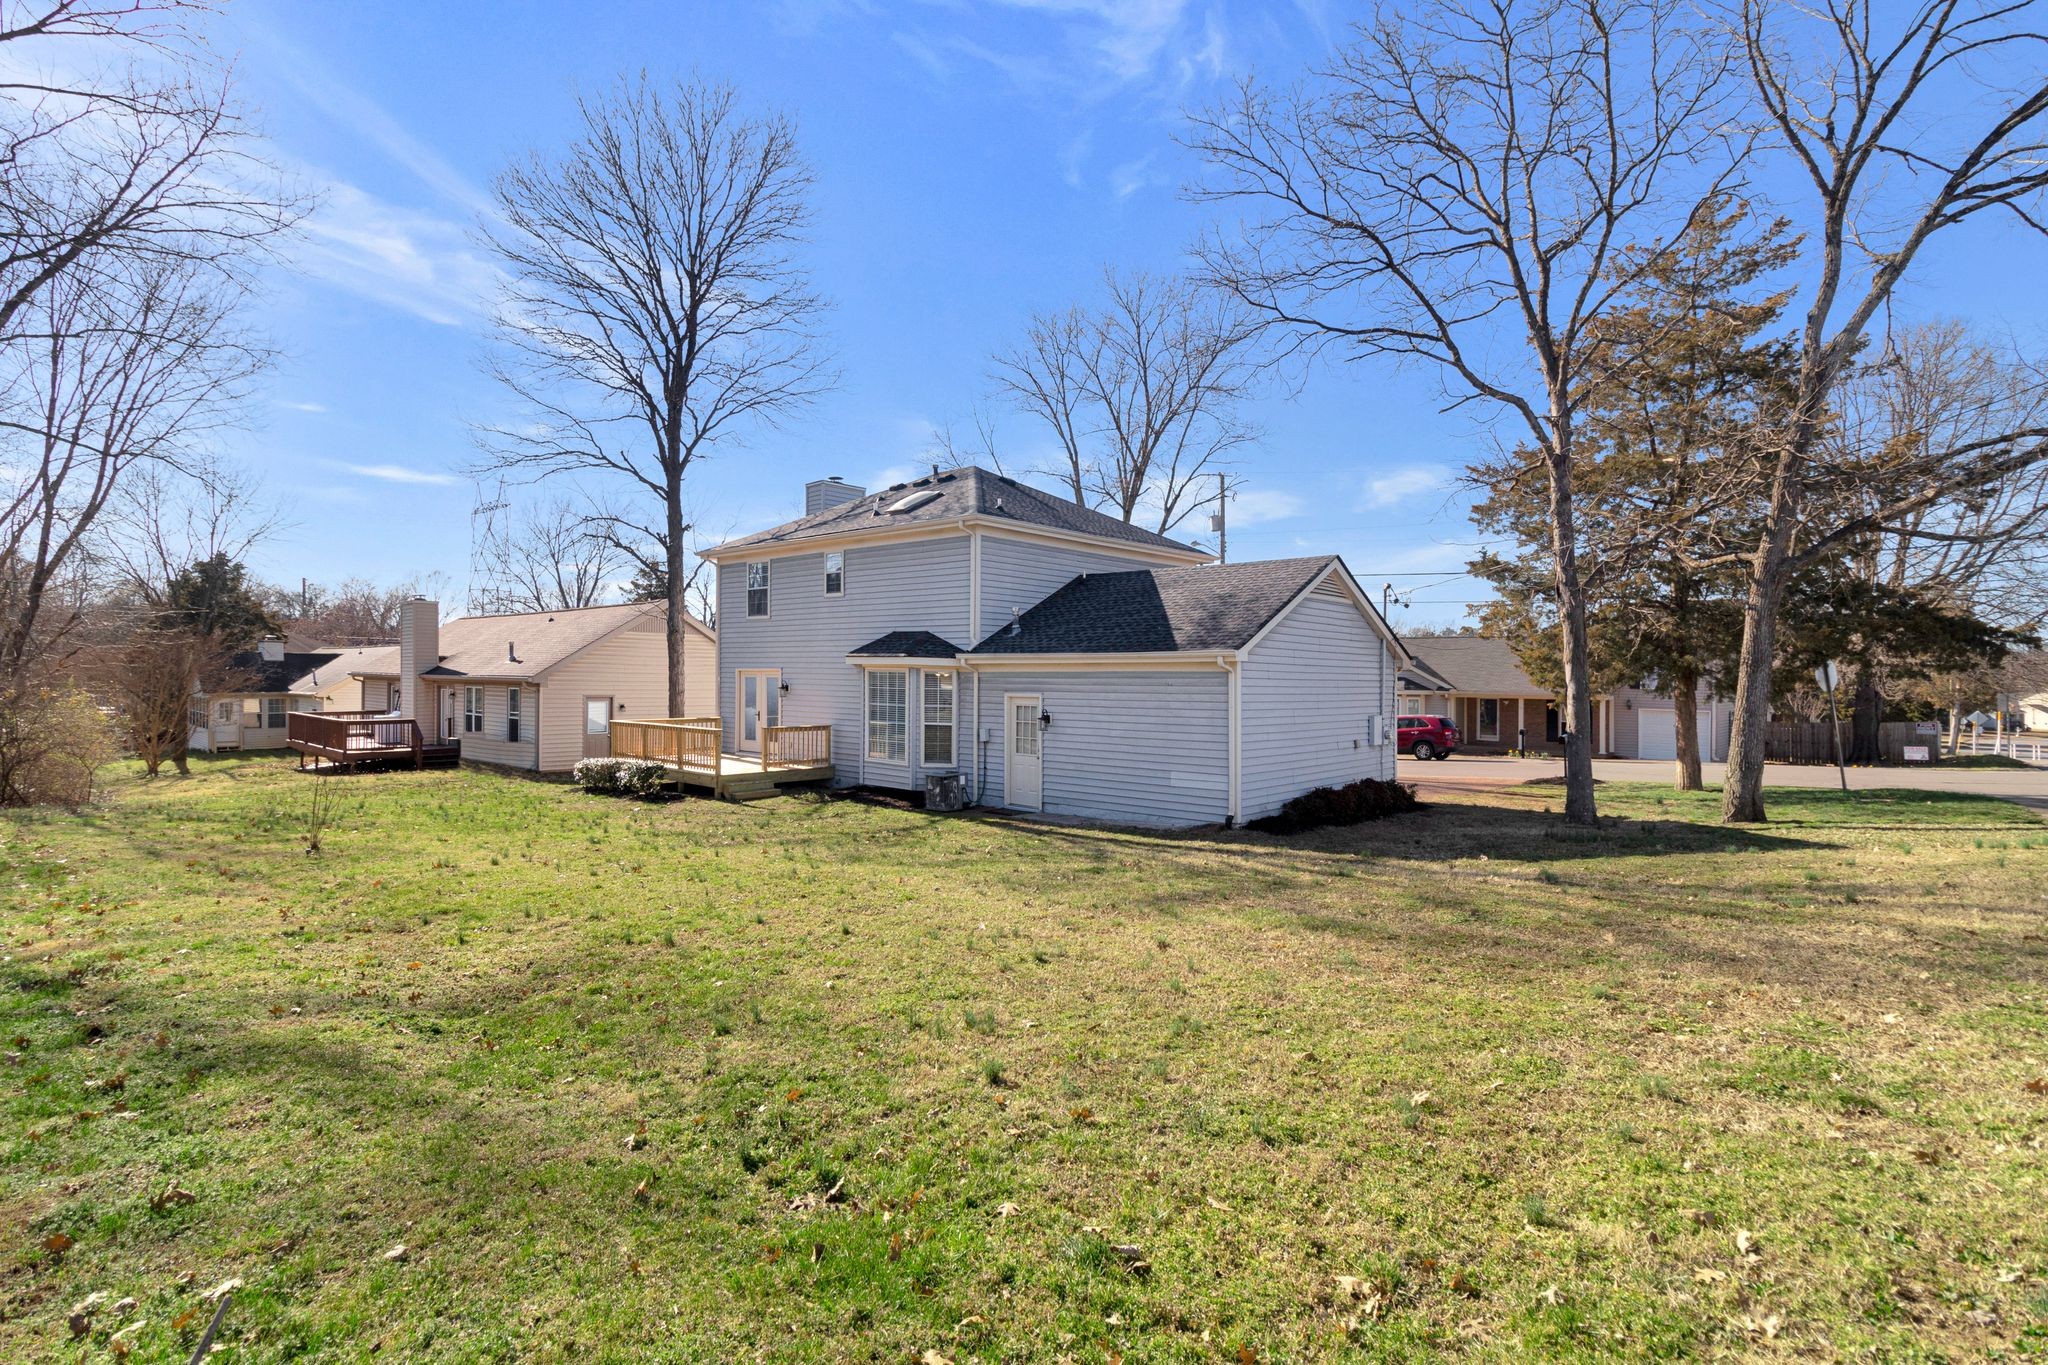
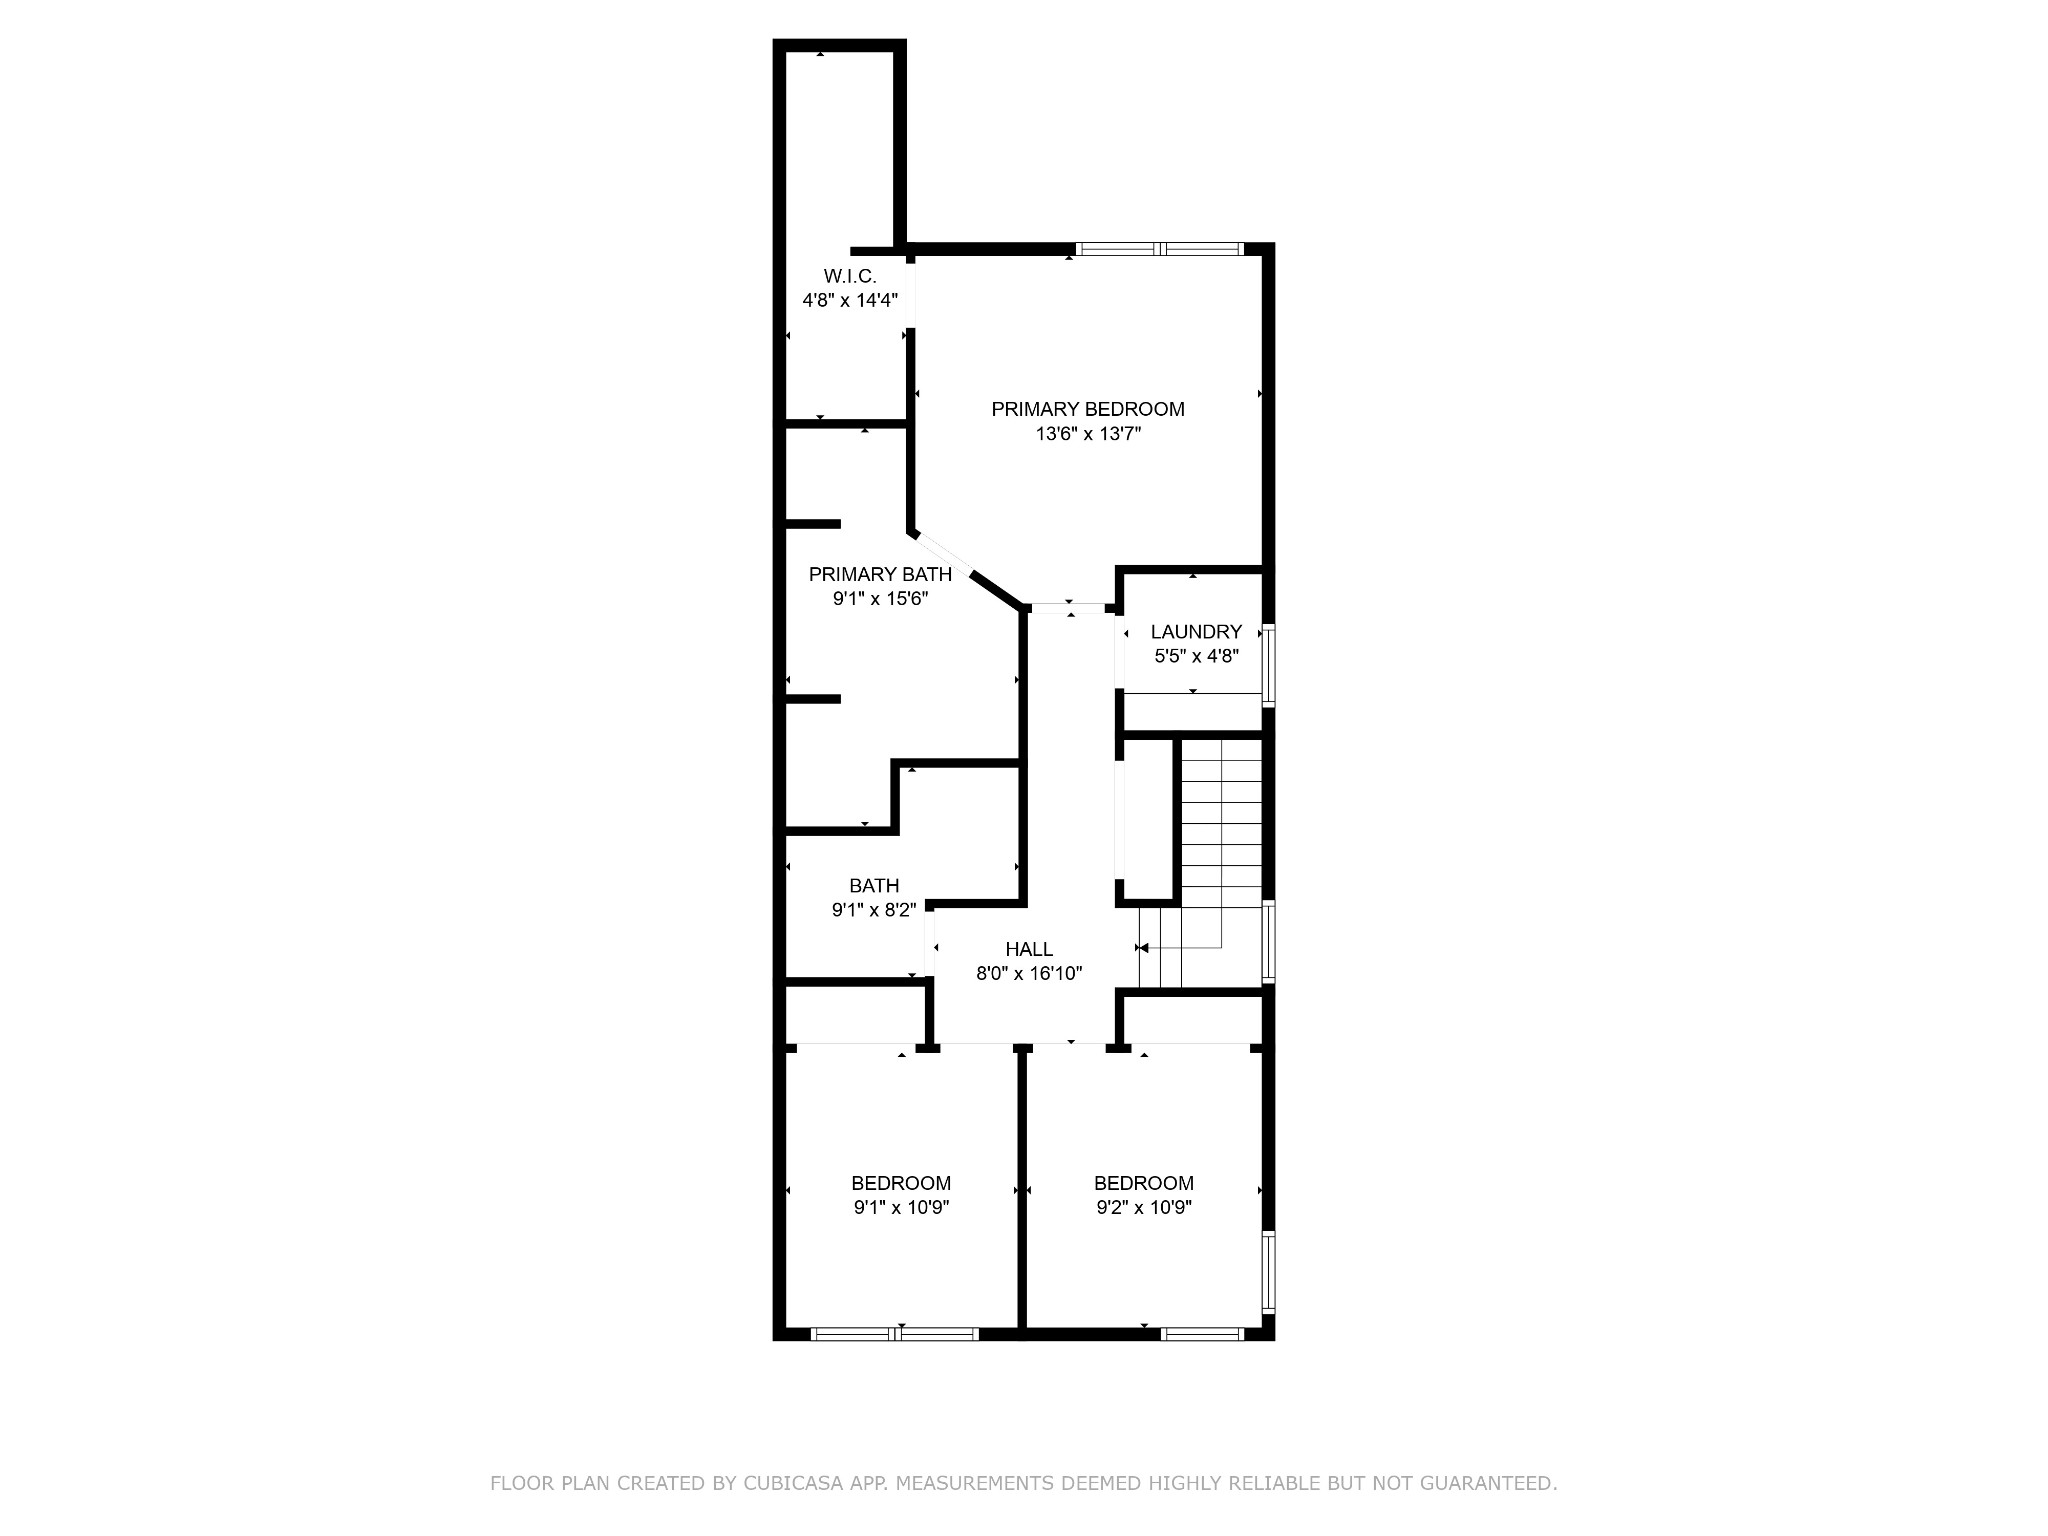
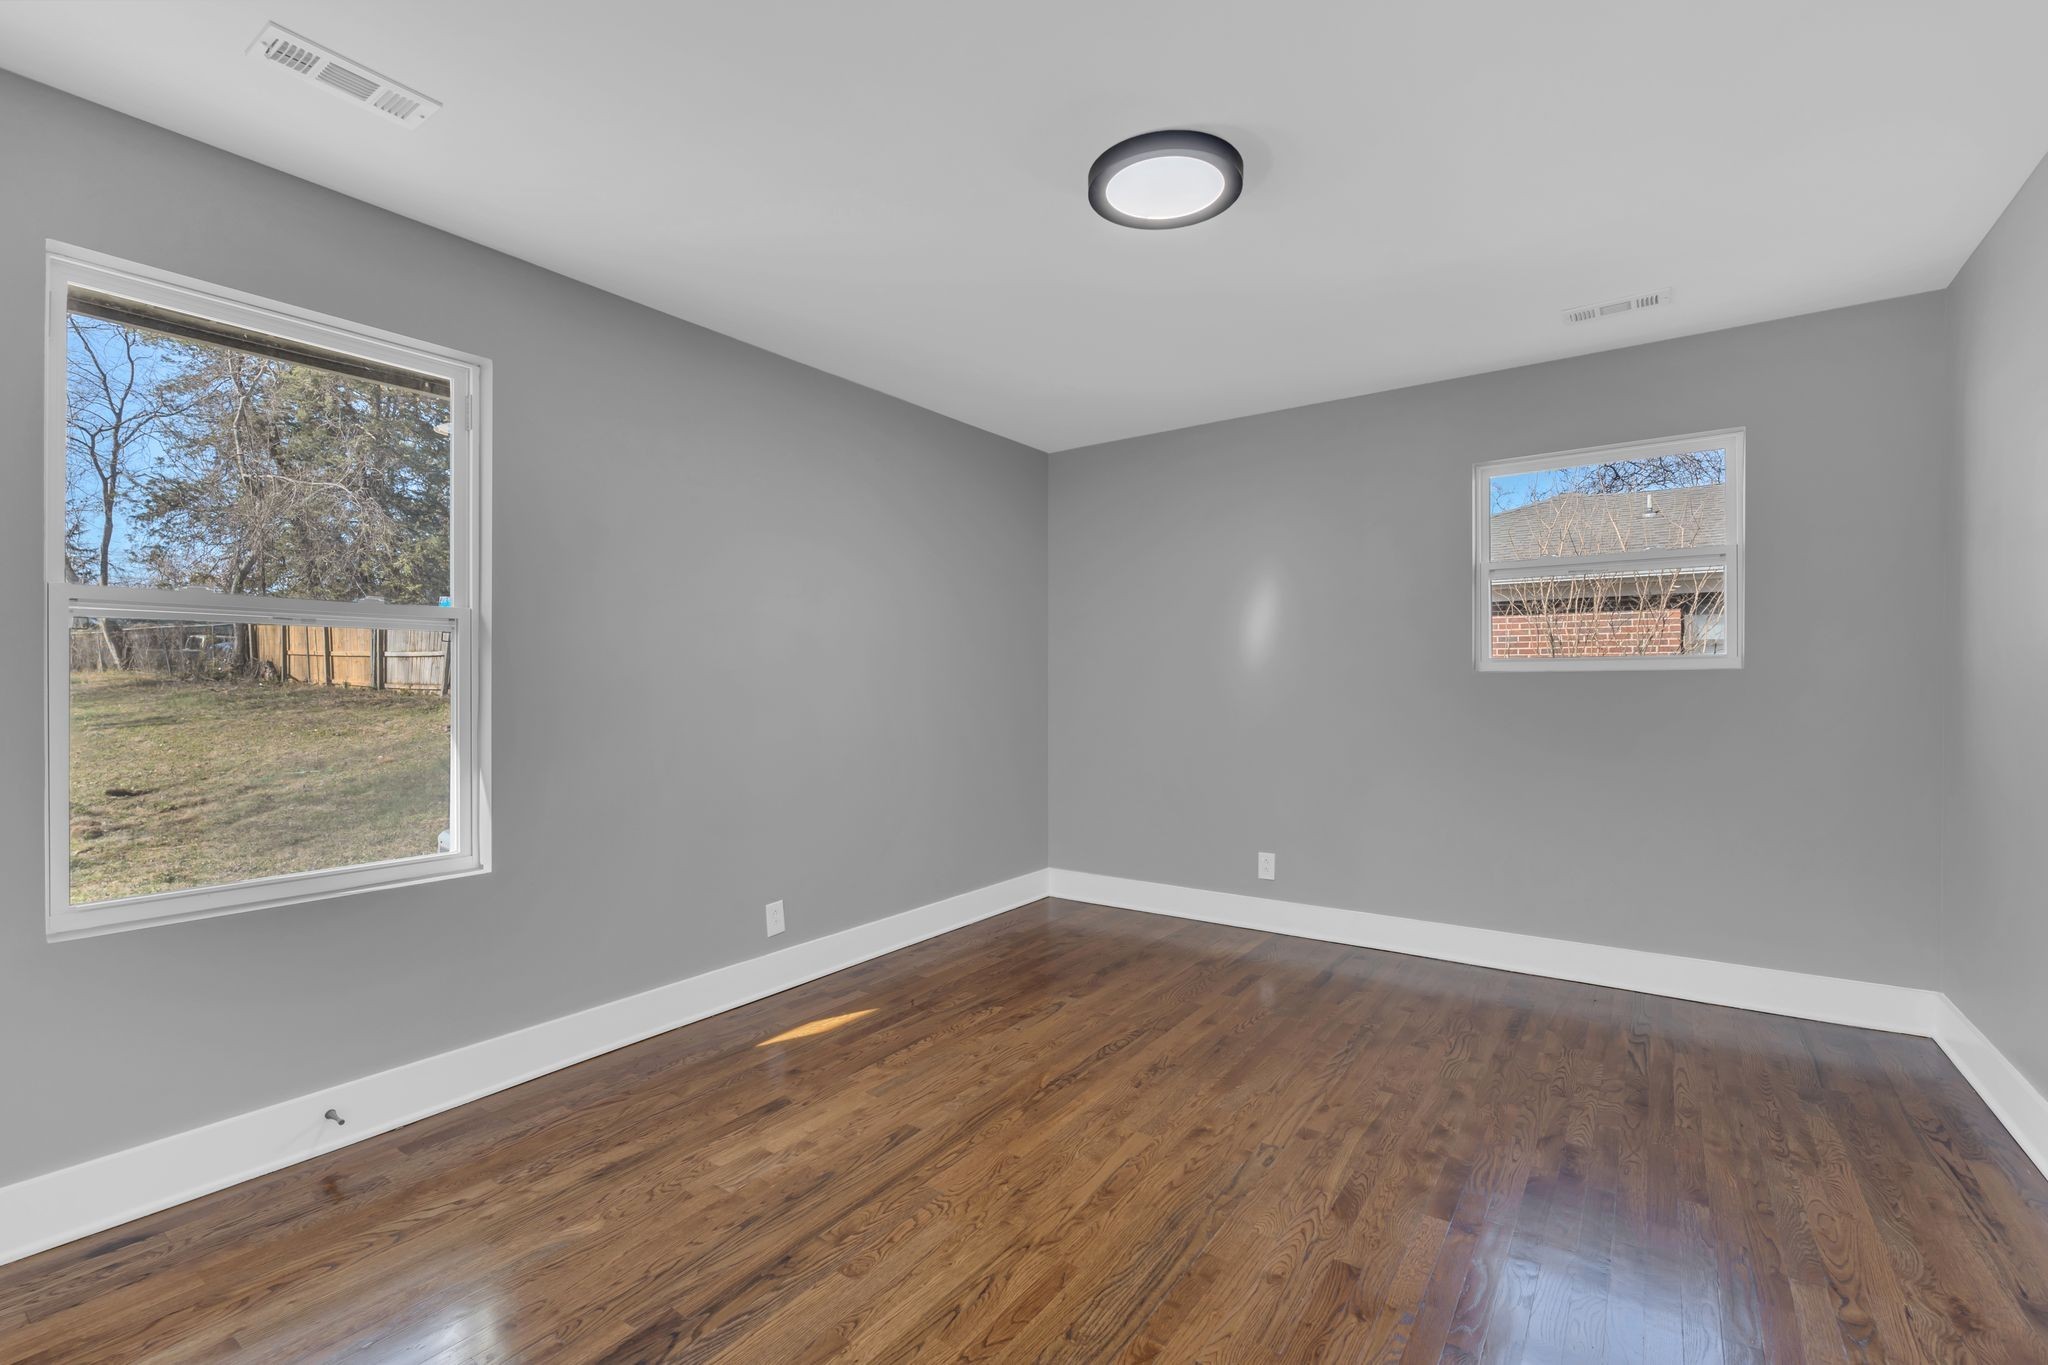
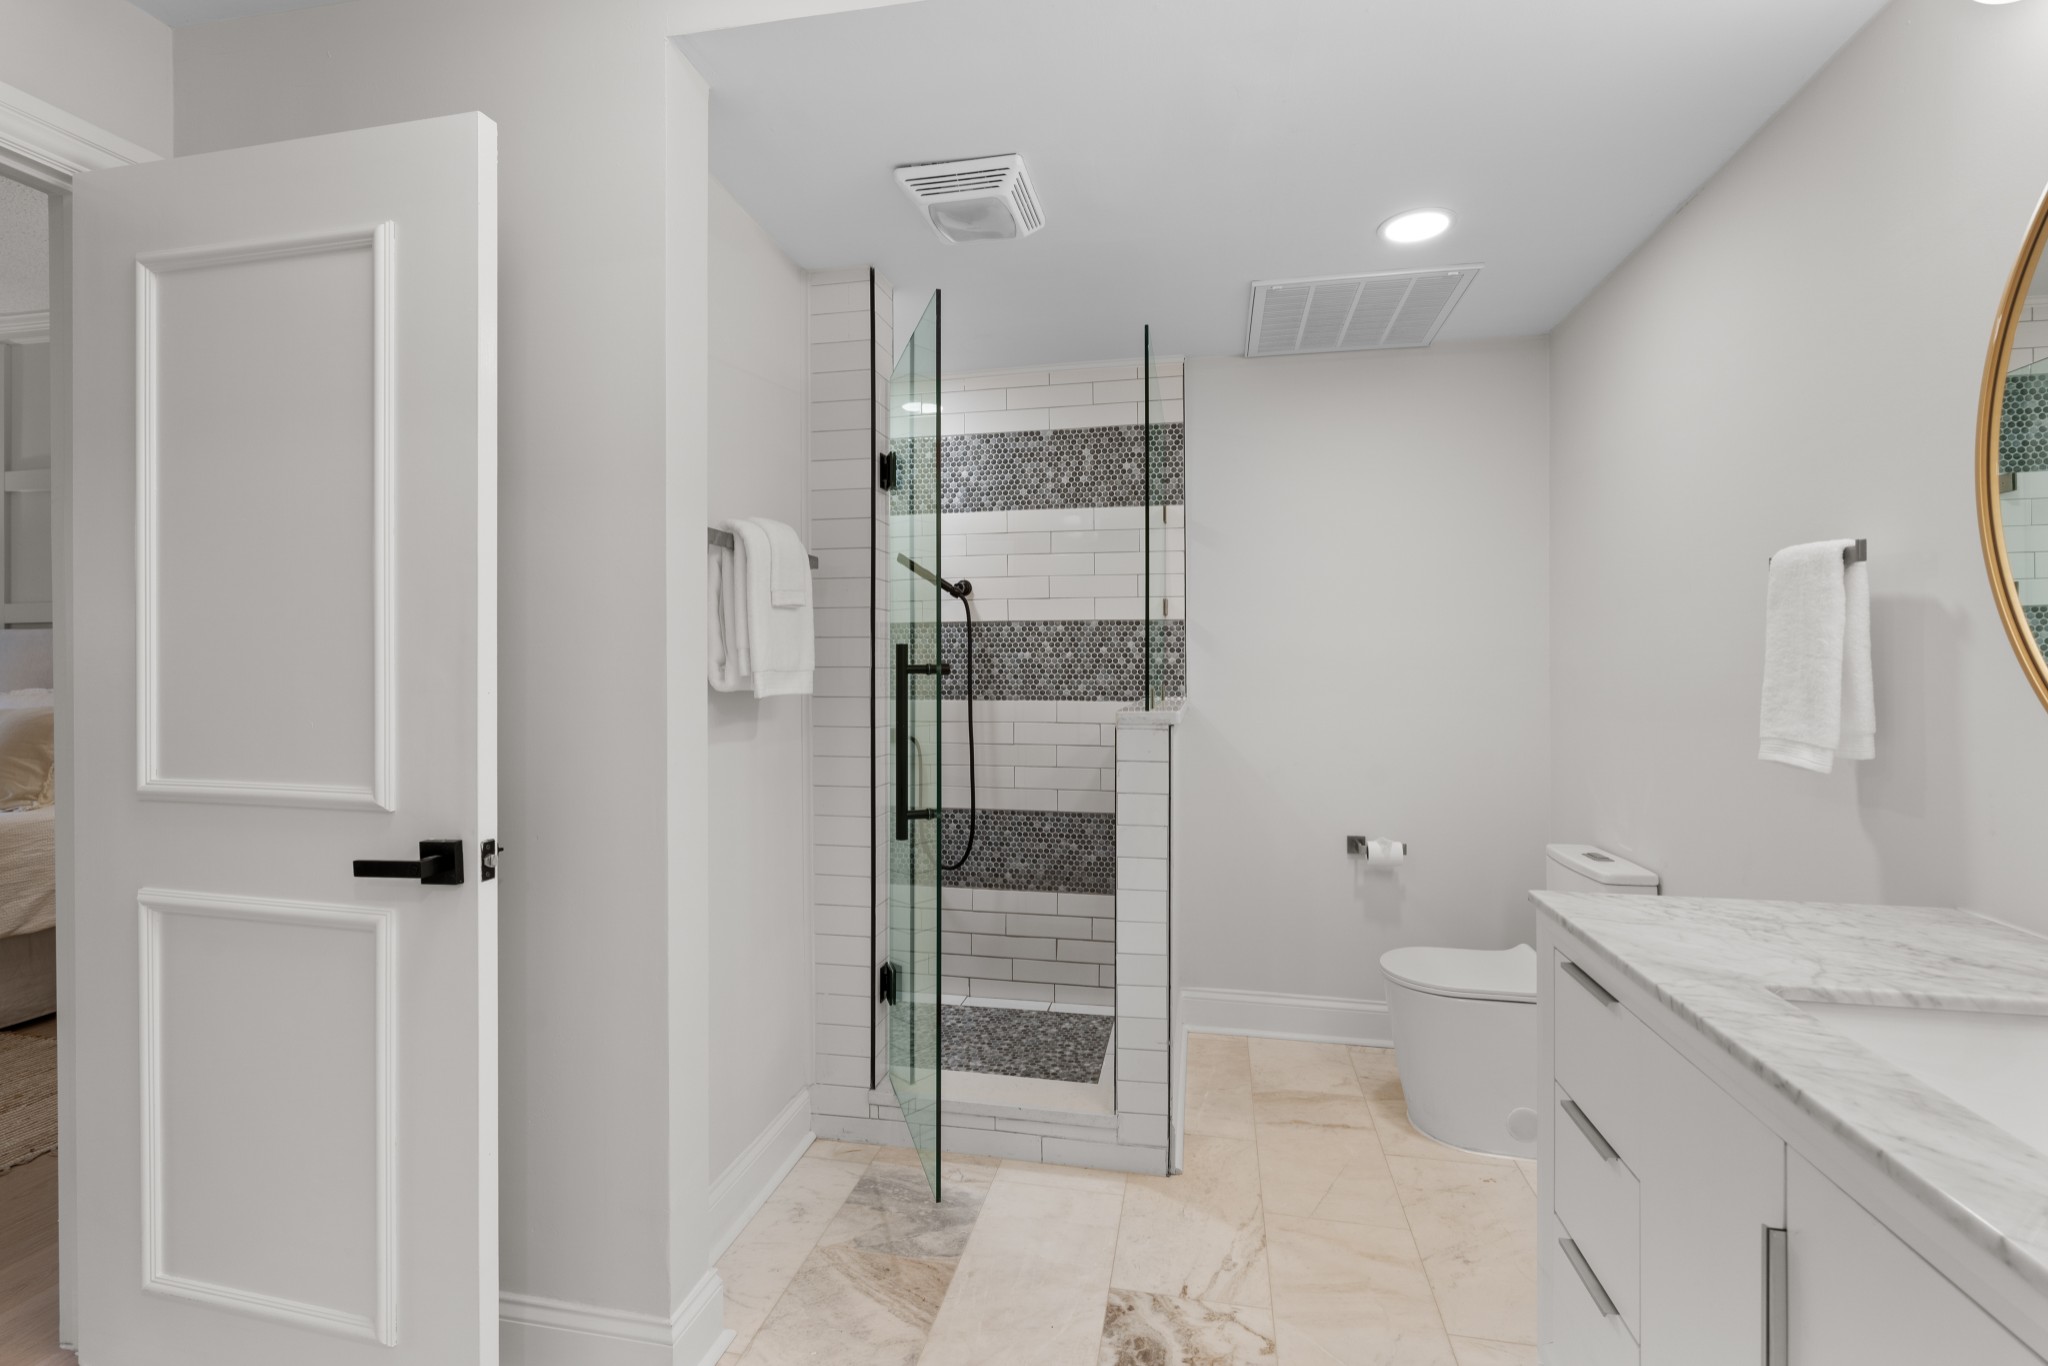
$490,000
5
bds
|
4
ba
|
2,306
sqft
|
built
1963
3962 Lawing Dr, Nashville, TN 37207
$317
Cash flow
3.4%
Cash-on-Cash Return
7.0%
Cap rate
0.9%
Rent to Value Ratio

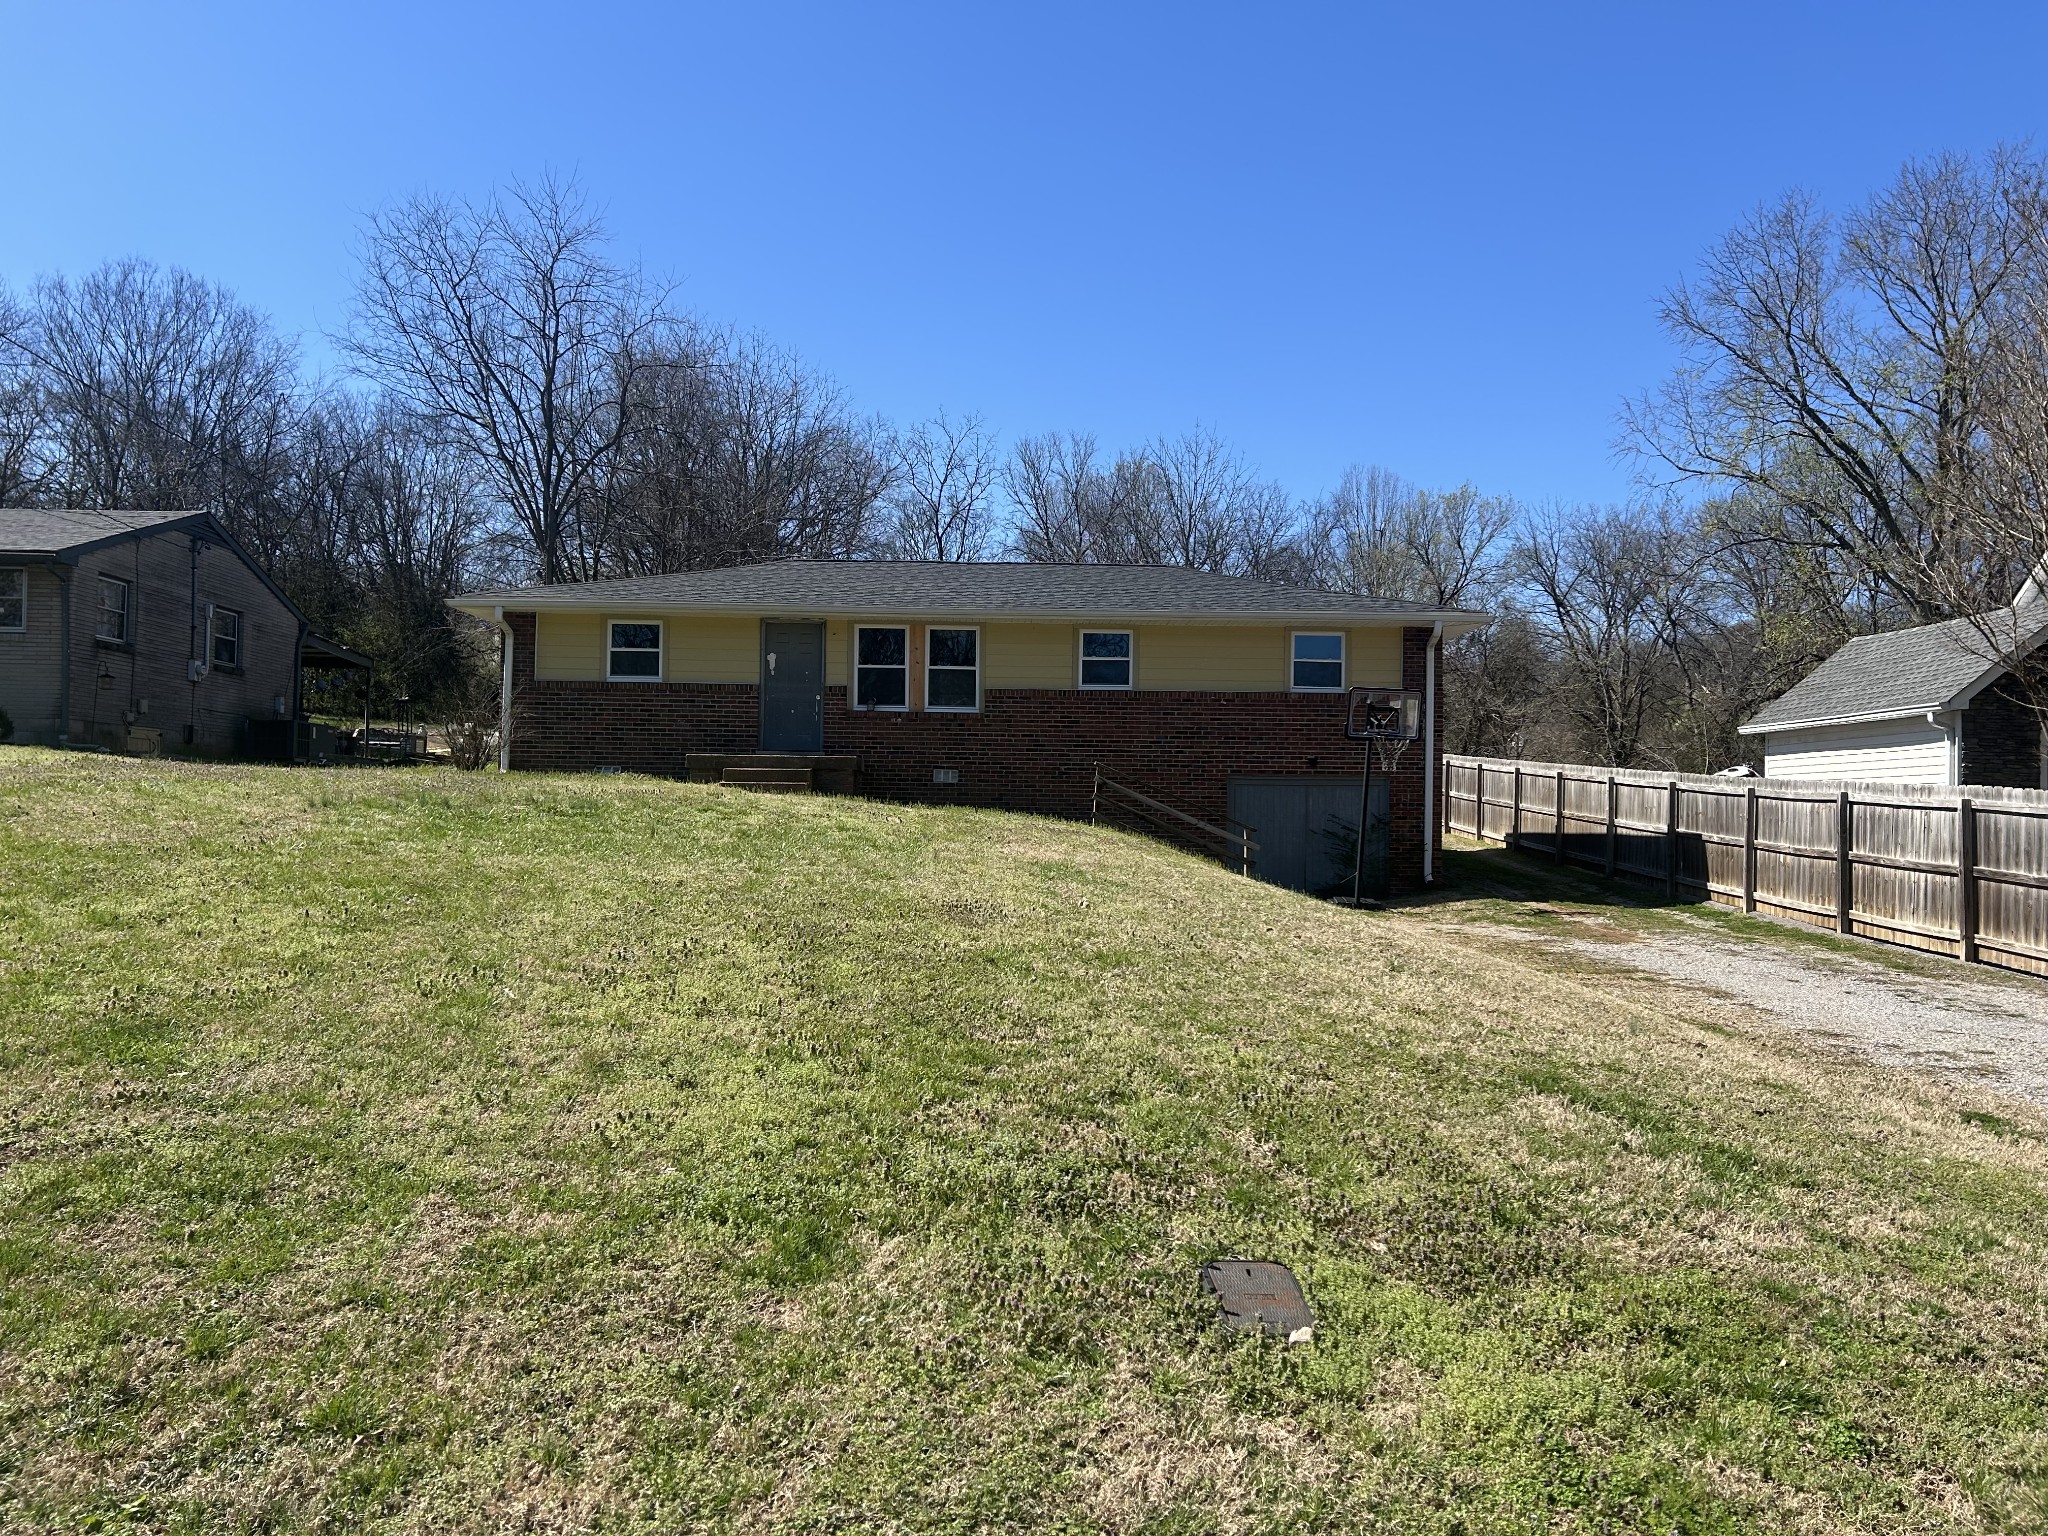
$309,500
3
bds
|
3
ba
|
2,255
sqft
|
built
2015
809 Cedarstone Way, Nashville, TN 37214
$162
Cash flow
2.7%
Cash-on-Cash Return
6.9%
Cap rate
0.9%
Rent to Value Ratio
39 out of 2,531 properties for sale in Davidson County
Limited Results Shown
Create a free account, or log in to reveal all property listings and enjoy the complete experience.
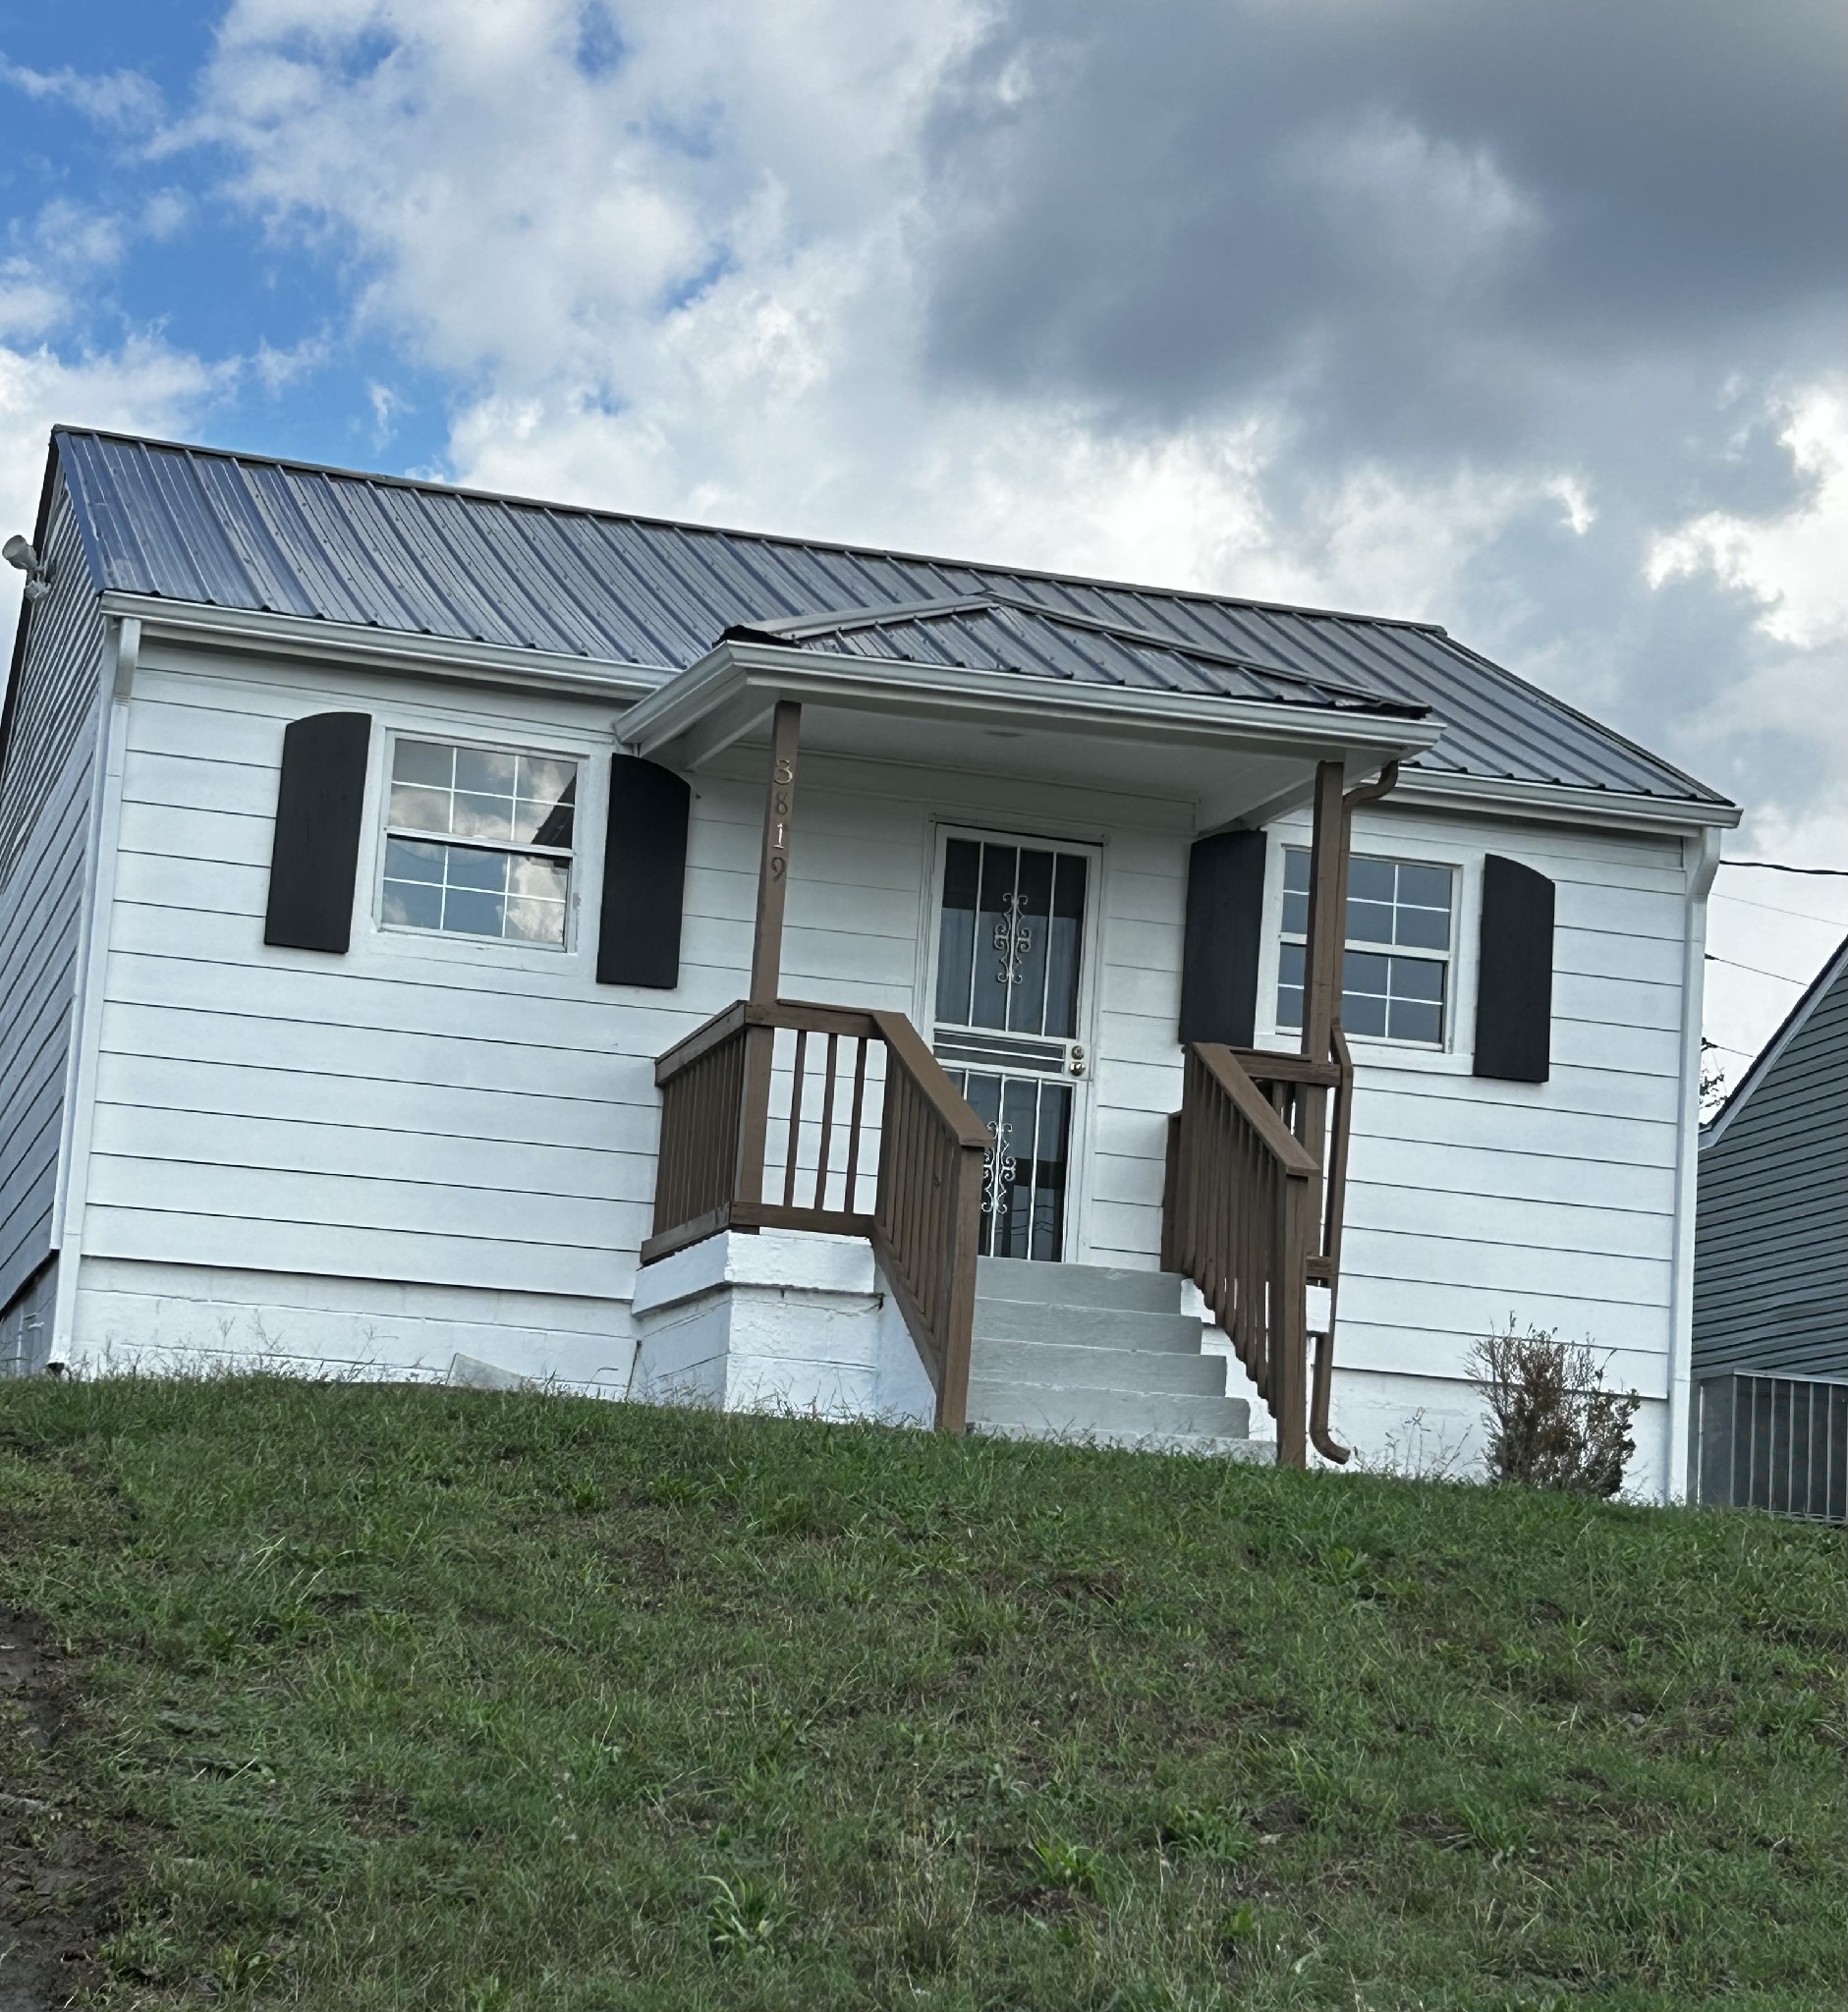
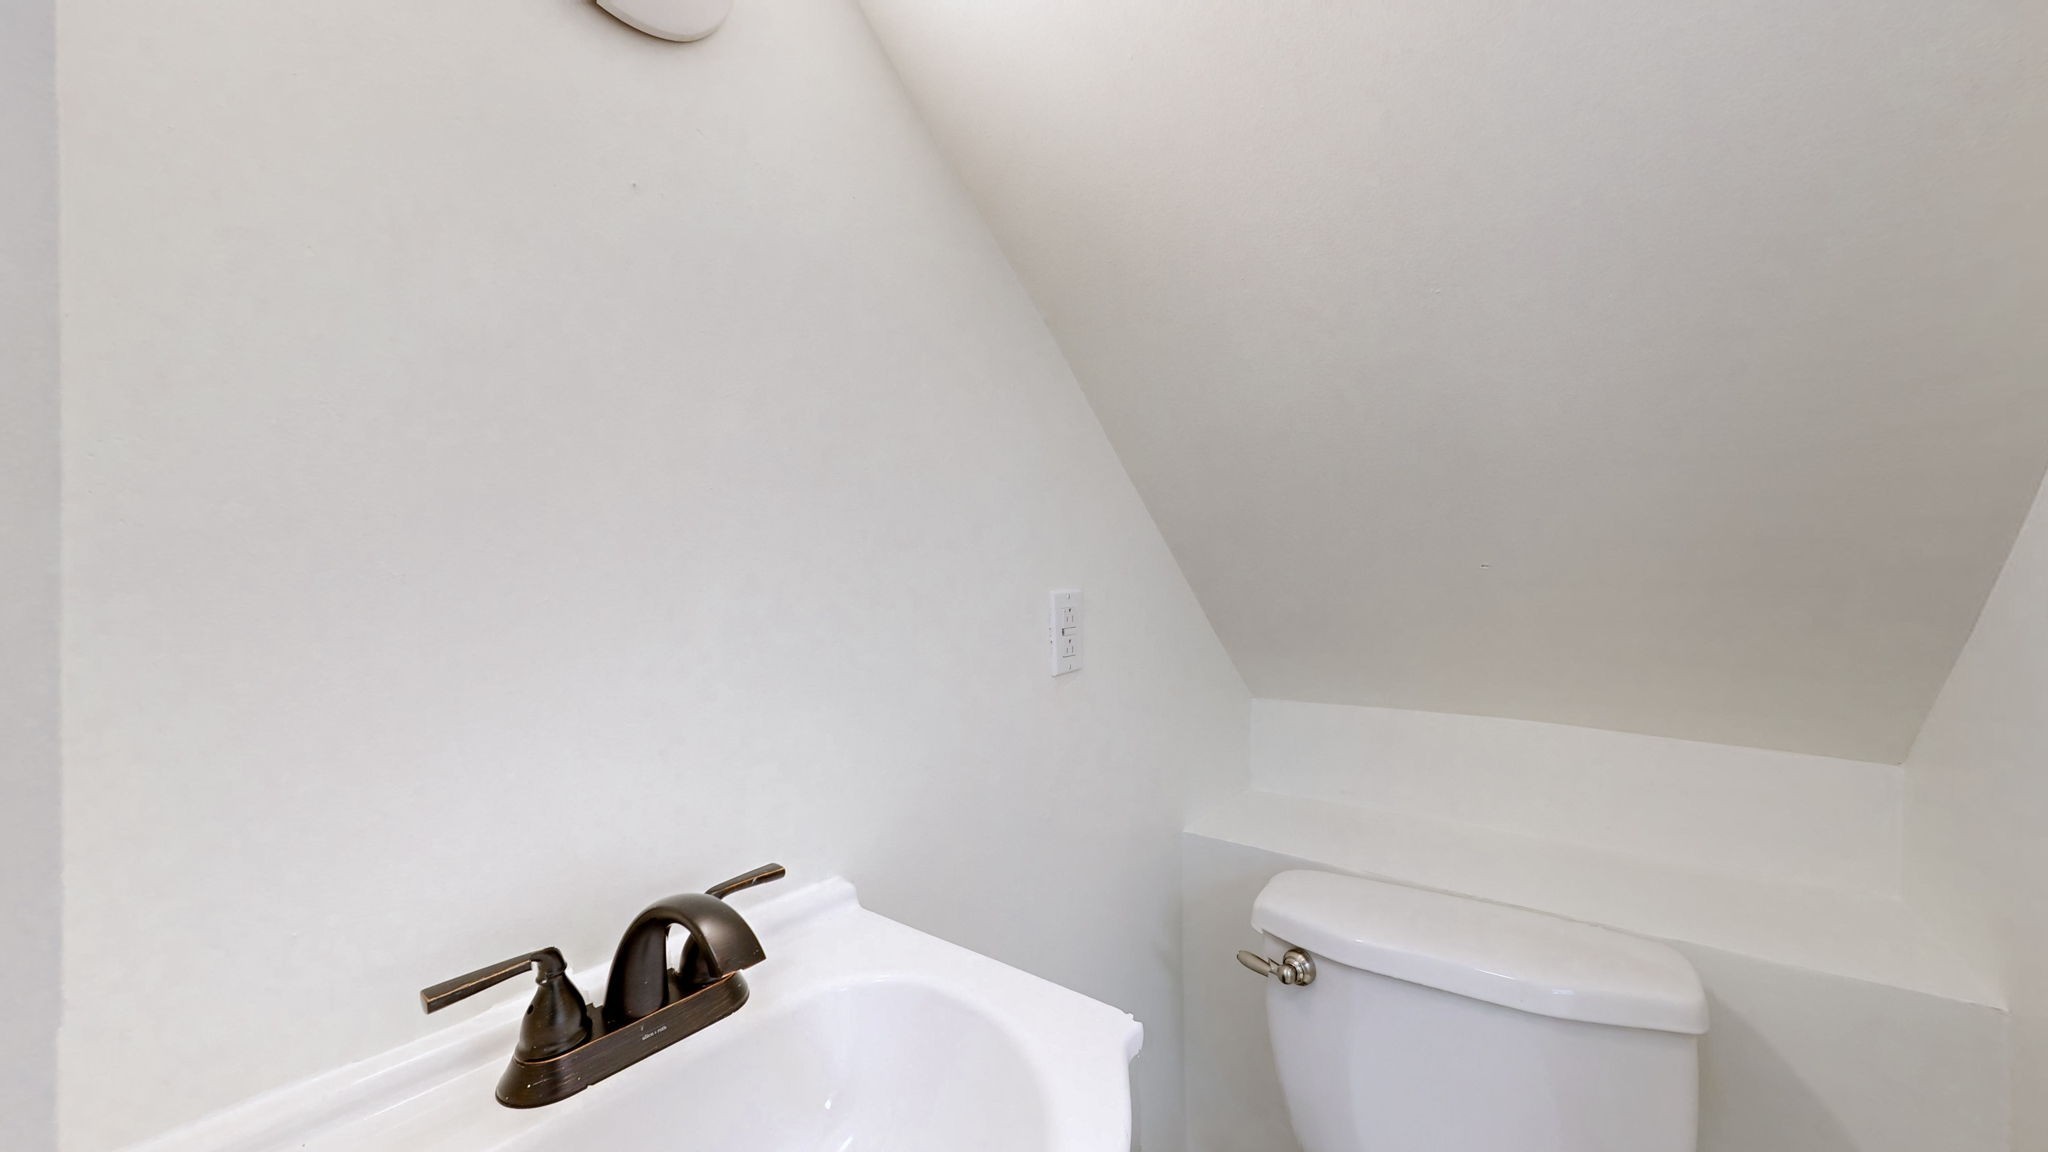
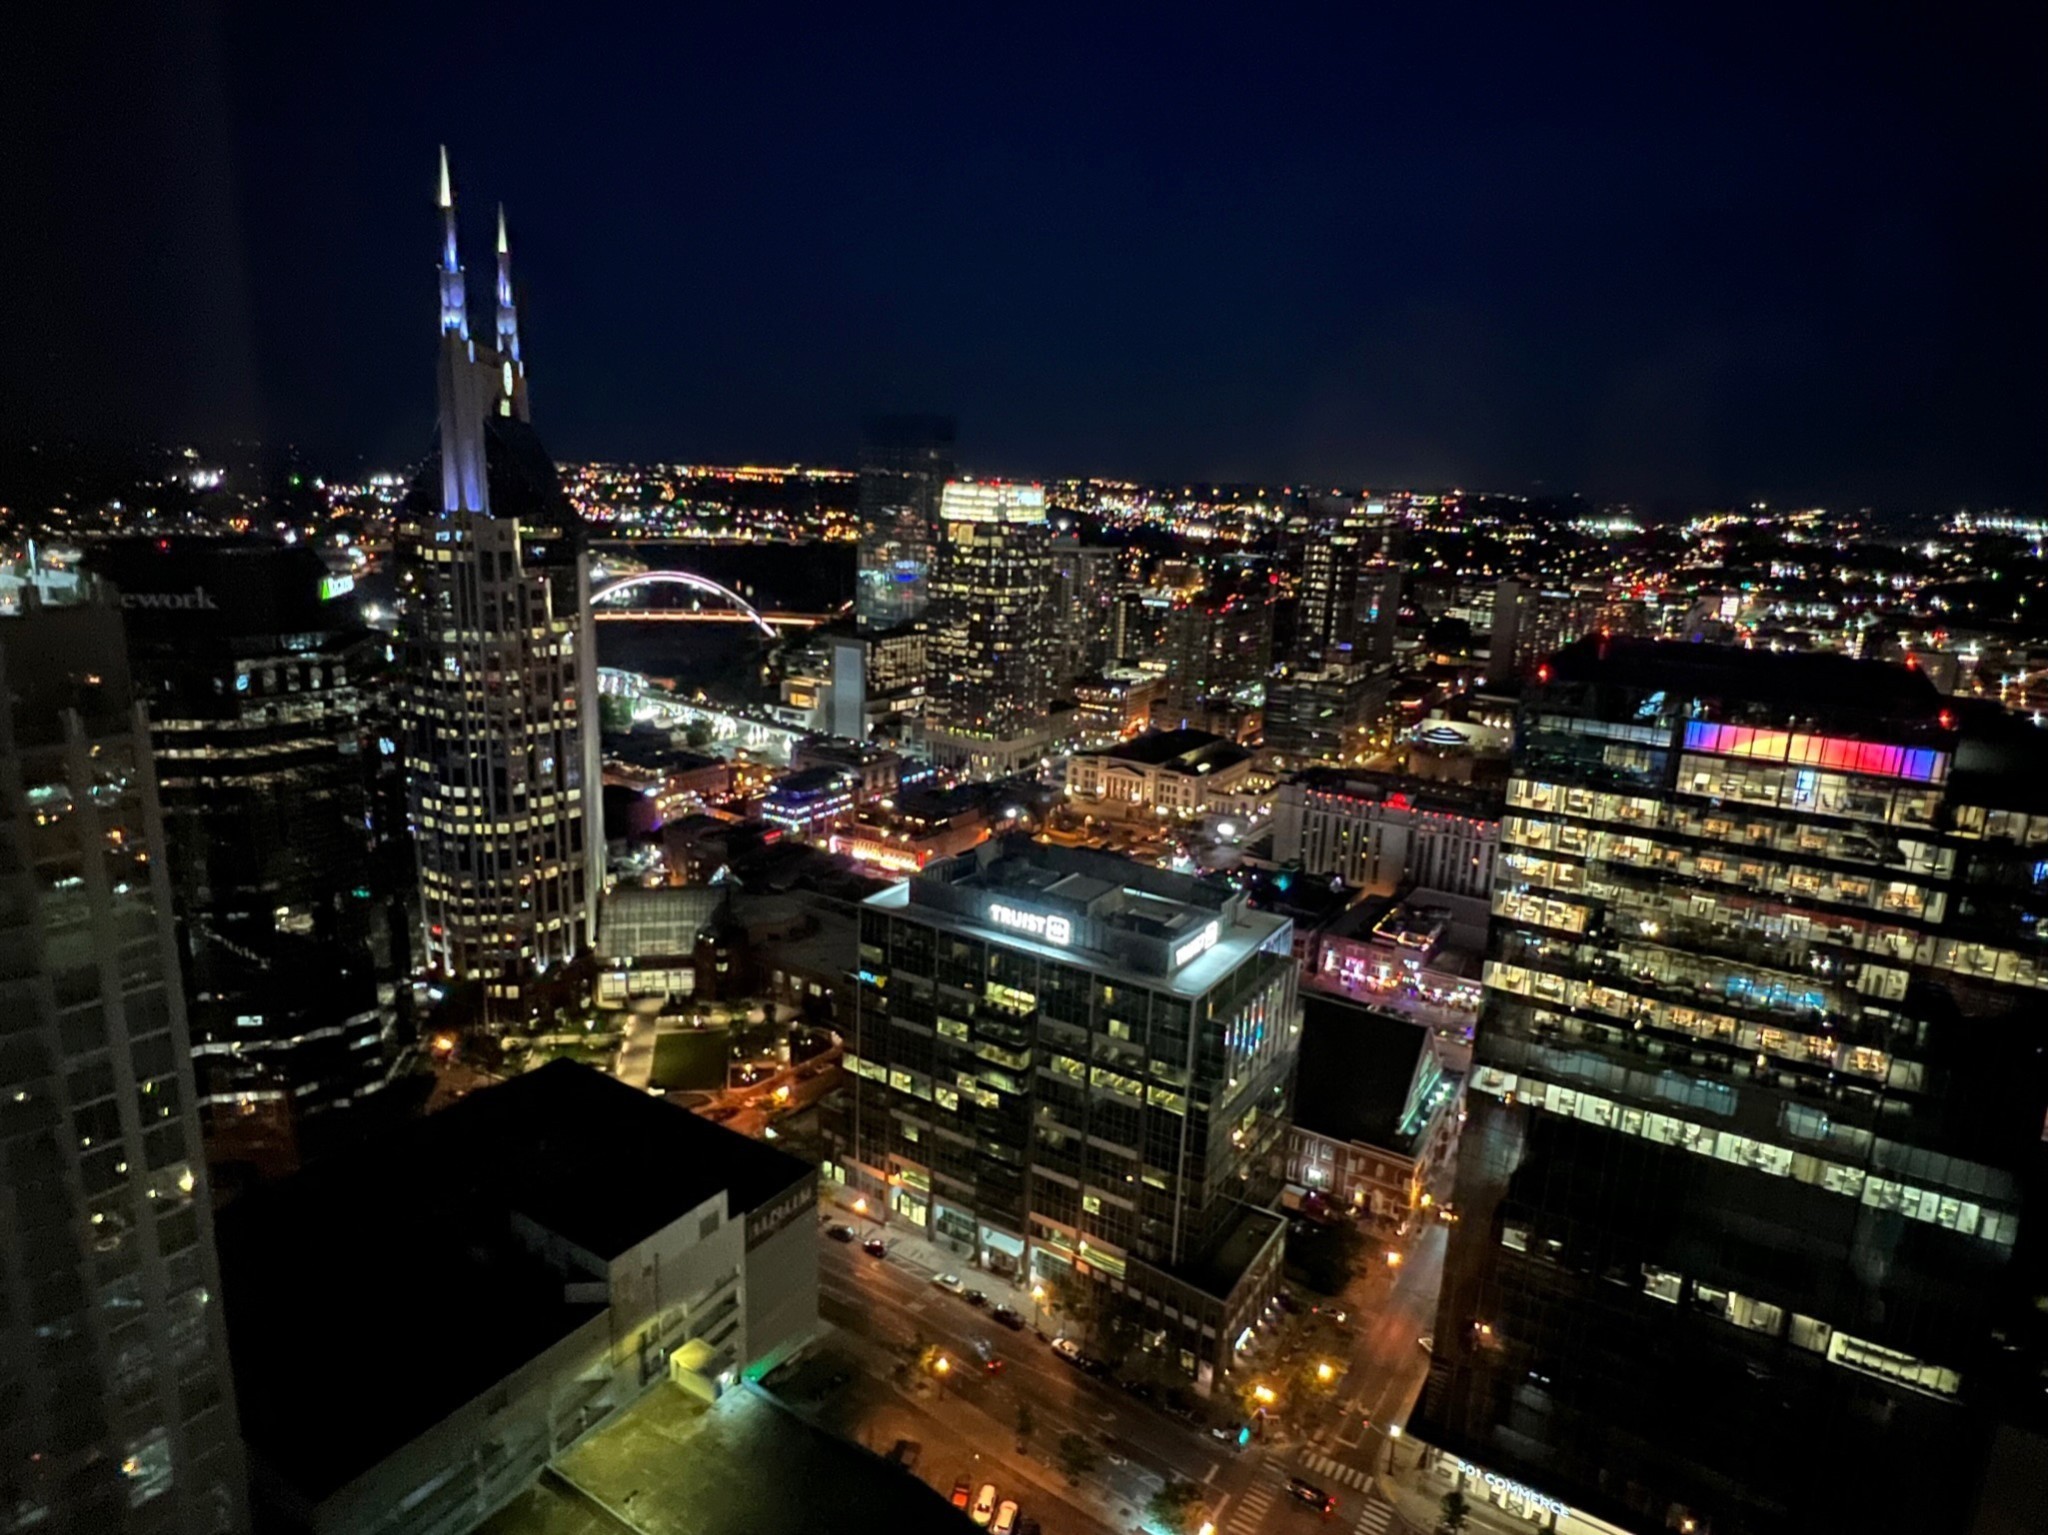
$299,900
2
bds
|
1
ba
|
924
sqft
|
built
1954
3819 Ashland City Hwy, Nashville, TN 37218
$-406
Cash flow
-7.1%
Cash-on-Cash Return
4.6%
Cap rate
0.6%
Rent to Value Ratio

$1,680,000
4
bds
|
3
ba
|
3,284
sqft
|
built
1925
1907 Russell St, Nashville, TN 37206
$-3,710
Cash flow
-11.5%
Cash-on-Cash Return
3.6%
Cap rate
0.5%
Rent to Value Ratio

$2,100,000
5
bds
|
3
ba
|
3,613
sqft
|
built
1948
208 Fairfax Ave, Nashville, TN 37212
$-5,759
Cash flow
-14.3%
Cash-on-Cash Return
3.0%
Cap rate
0.4%
Rent to Value Ratio
$1,299,999
4
bds
|
4
ba
|
4,180
sqft
|
built
1999
104 Portsmouth Cv, Brentwood, TN 37027
$-3,371
Cash flow
-13.5%
Cash-on-Cash Return
3.2%
Cap rate
0.4%
Rent to Value Ratio
$631,500
5
bds
|
4
ba
|
3,062
sqft
|
built
2022
264 Blackpool Dr, Nashville, TN 37211
$-1,372
Cash flow
-11.3%
Cash-on-Cash Return
3.7%
Cap rate
0.5%
Rent to Value Ratio
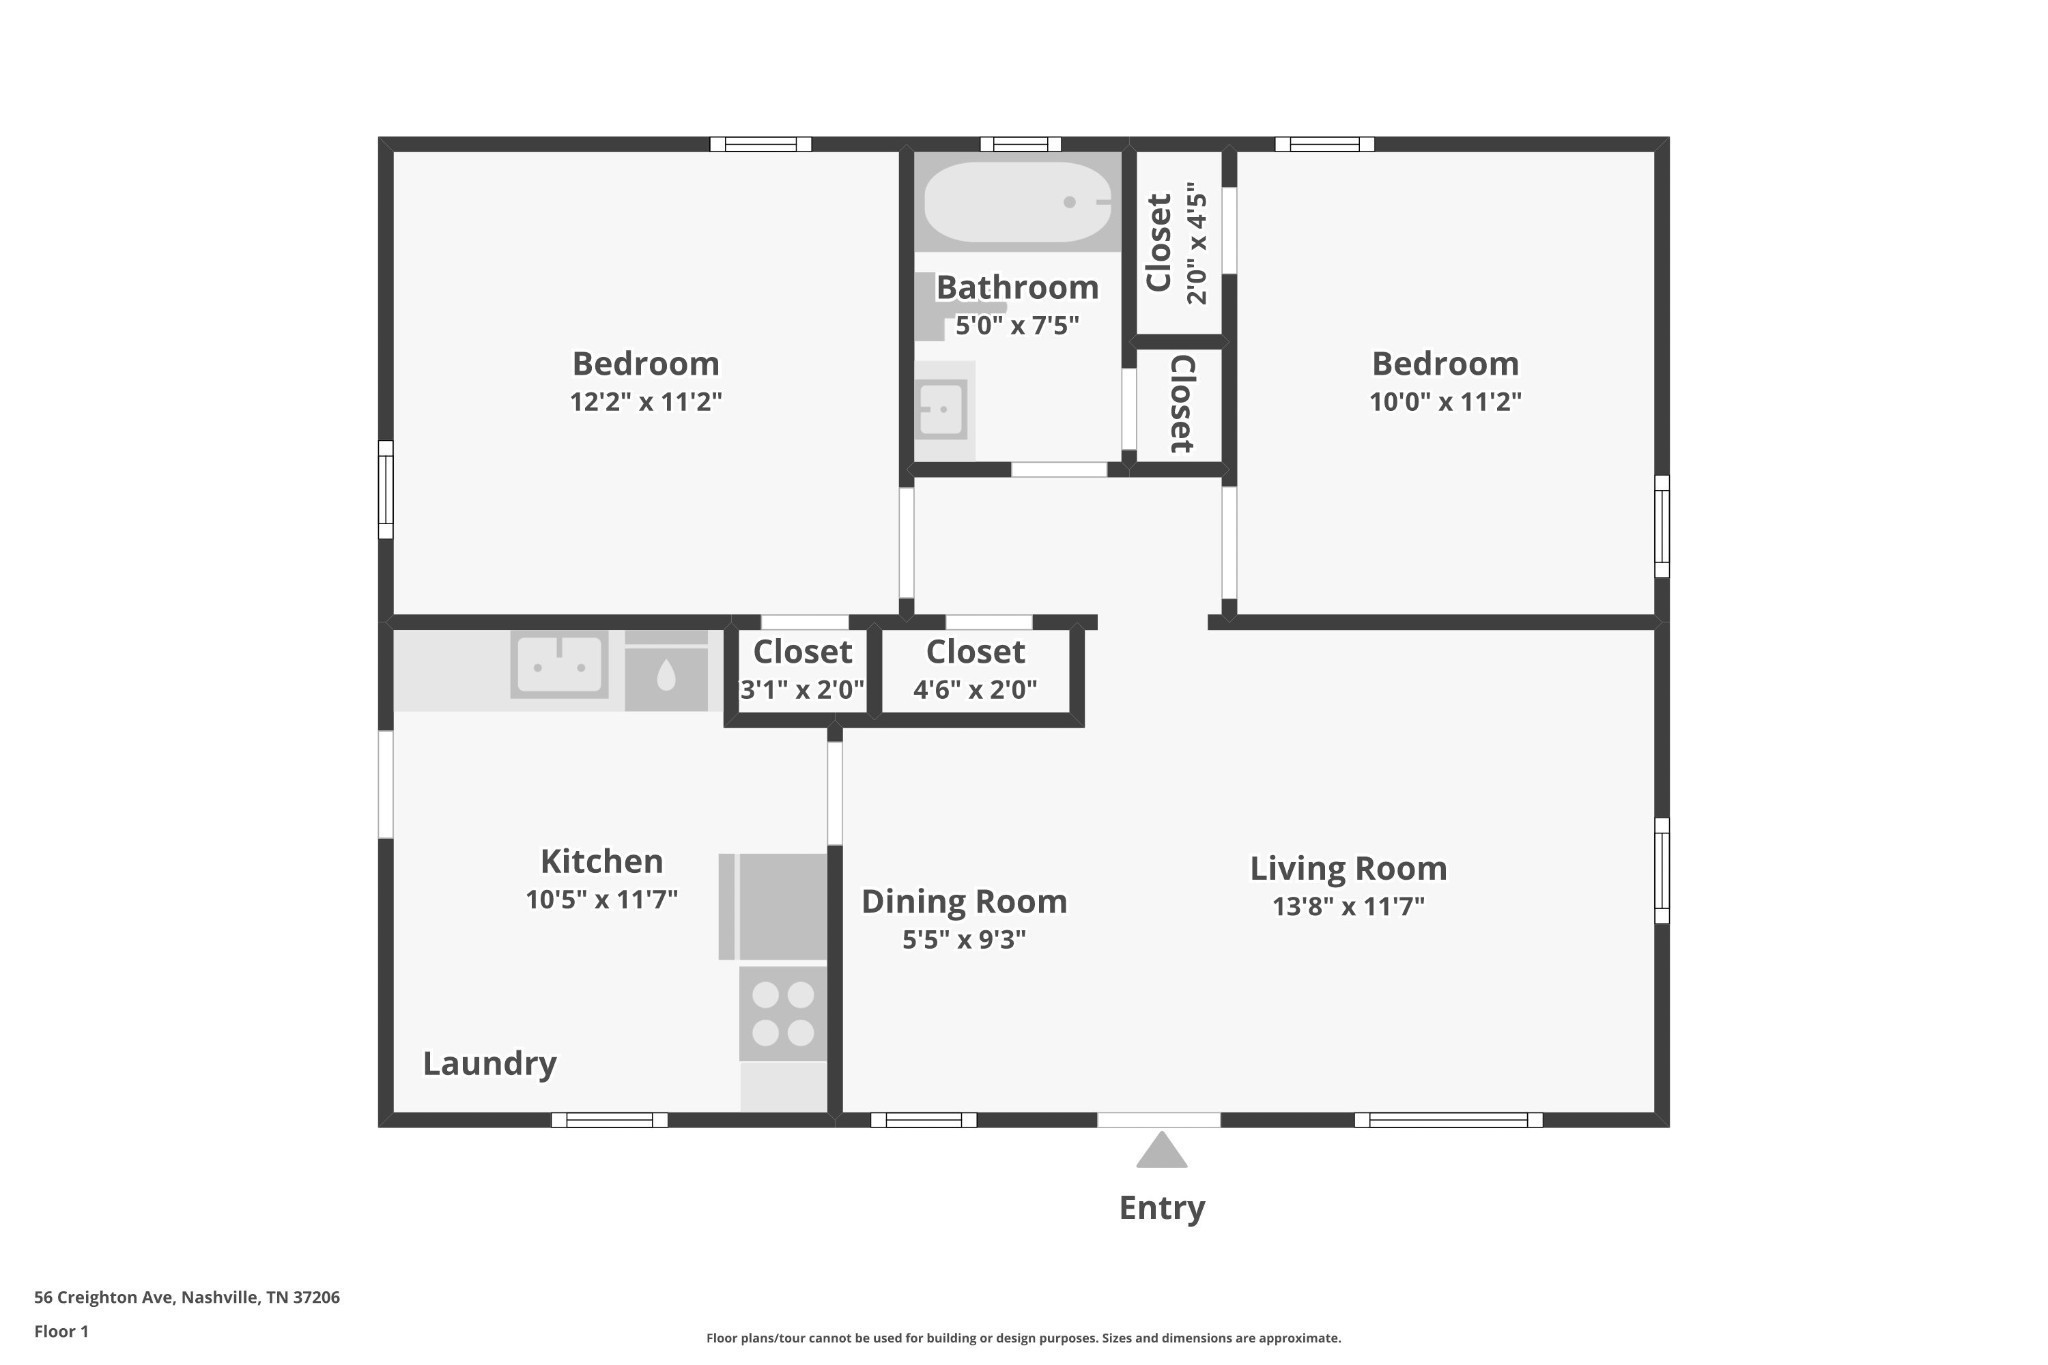
$385,000
2
bds
|
1
ba
|
801
sqft
|
built
1955
56 Creighton Ave, Nashville, TN 37206
$-590
Cash flow
-8.0%
Cash-on-Cash Return
4.4%
Cap rate
0.6%
Rent to Value Ratio

$500,000
3
bds
|
3
ba
|
2,362
sqft
|
built
1986
5524 Thalman Dr, Brentwood, TN 37027
$-955
Cash flow
-10.0%
Cash-on-Cash Return
4.0%
Cap rate
0.5%
Rent to Value Ratio

$399,900
3
bds
|
3
ba
|
1,724
sqft
|
built
2018
4325 Ashland City Hwy, Nashville, TN 37218
$-806
Cash flow
-10.5%
Cash-on-Cash Return
3.8%
Cap rate
0.6%
Rent to Value Ratio
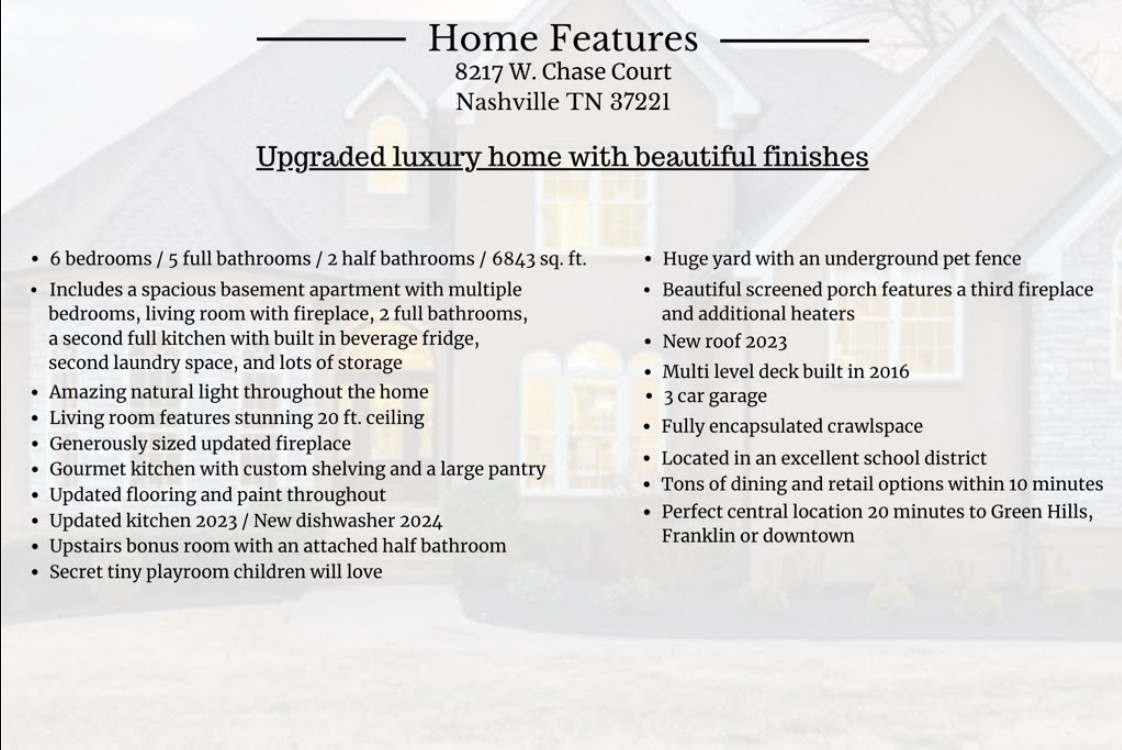
$1,499,000
6
bds
|
7
ba
|
6,843
sqft
|
built
2005
8217 W Chase Ct, Nashville, TN 37221
$-3,595
Cash flow
-12.5%
Cash-on-Cash Return
3.4%
Cap rate
0.5%
Rent to Value Ratio

$2,700,000
4
bds
|
5
ba
|
3,867
sqft
|
built
2023
6025 Opus St, Brentwood, TN 37027
$-9,068
Cash flow
-17.5%
Cash-on-Cash Return
2.2%
Cap rate
0.3%
Rent to Value Ratio

$449,900
2
bds
|
1
ba
|
1,148
sqft
|
built
1945
5110 Kentucky Ave, Nashville, TN 37209
$-1,030
Cash flow
-11.9%
Cash-on-Cash Return
3.5%
Cap rate
0.5%
Rent to Value Ratio
$4,450,000
4
bds
|
5
ba
|
5,664
sqft
|
built
1930
926 Bradford Ave, Nashville, TN 37204
$-20,633
Cash flow
-24.2%
Cash-on-Cash Return
0.7%
Cap rate
0.1%
Rent to Value Ratio

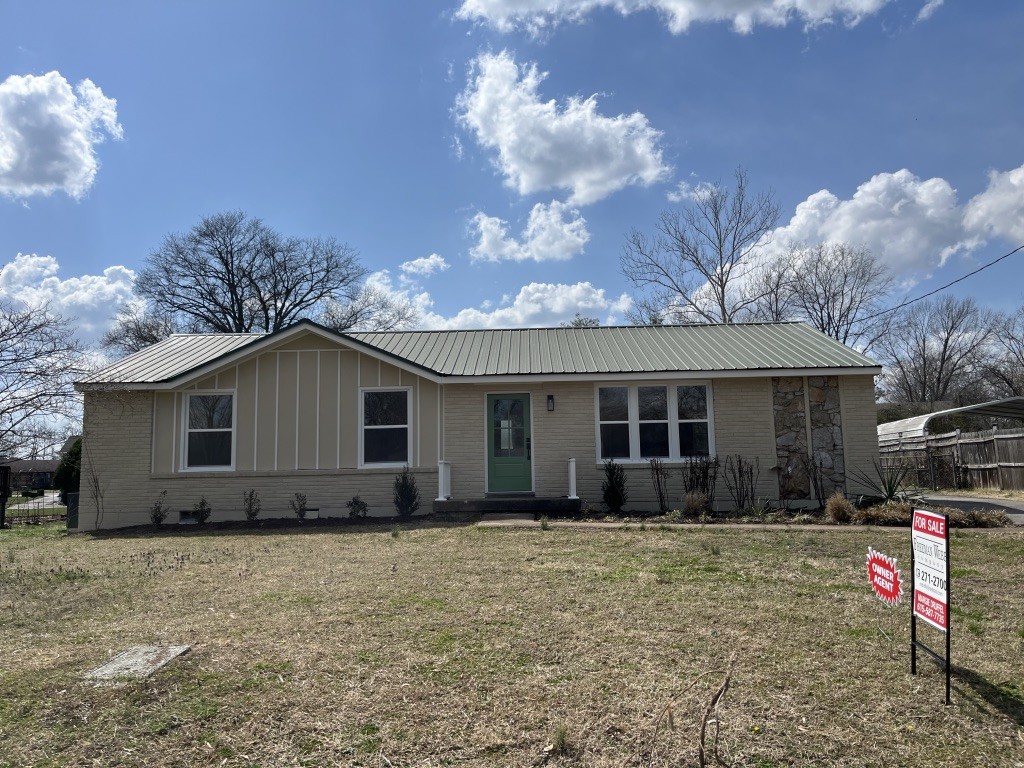
$299,900
3
bds
|
1
ba
|
975
sqft
|
built
1963
3255 Panorama Dr, Nashville, TN 37218
$-347
Cash flow
-6.0%
Cash-on-Cash Return
4.9%
Cap rate
0.6%
Rent to Value Ratio

$2,450,000
5
bds
|
7
ba
|
5,004
sqft
|
built
1973
5669 Cloverland Dr, Brentwood, TN 37027
$-10,747
Cash flow
-22.9%
Cash-on-Cash Return
1.0%
Cap rate
0.1%
Rent to Value Ratio
$1,245,000
4
bds
|
3
ba
|
2,667
sqft
|
built
1959
215 Rolling Fork Ct, Nashville, TN 37205
$-3,939
Cash flow
-16.5%
Cash-on-Cash Return
2.5%
Cap rate
0.4%
Rent to Value Ratio
$620,000
4
bds
|
3
ba
|
3,270
sqft
|
built
1997
8012 Poplarwood Rd, Nashville, TN 37221
$-1,145
Cash flow
-9.6%
Cash-on-Cash Return
4.0%
Cap rate
0.6%
Rent to Value Ratio
$469,500
1
bds
|
1
ba
|
808
sqft
|
built
2007
900 20th Ave S, Nashville, TN 37212
$-1,637
Cash flow
-18.2%
Cash-on-Cash Return
2.1%
Cap rate
0.5%
Rent to Value Ratio
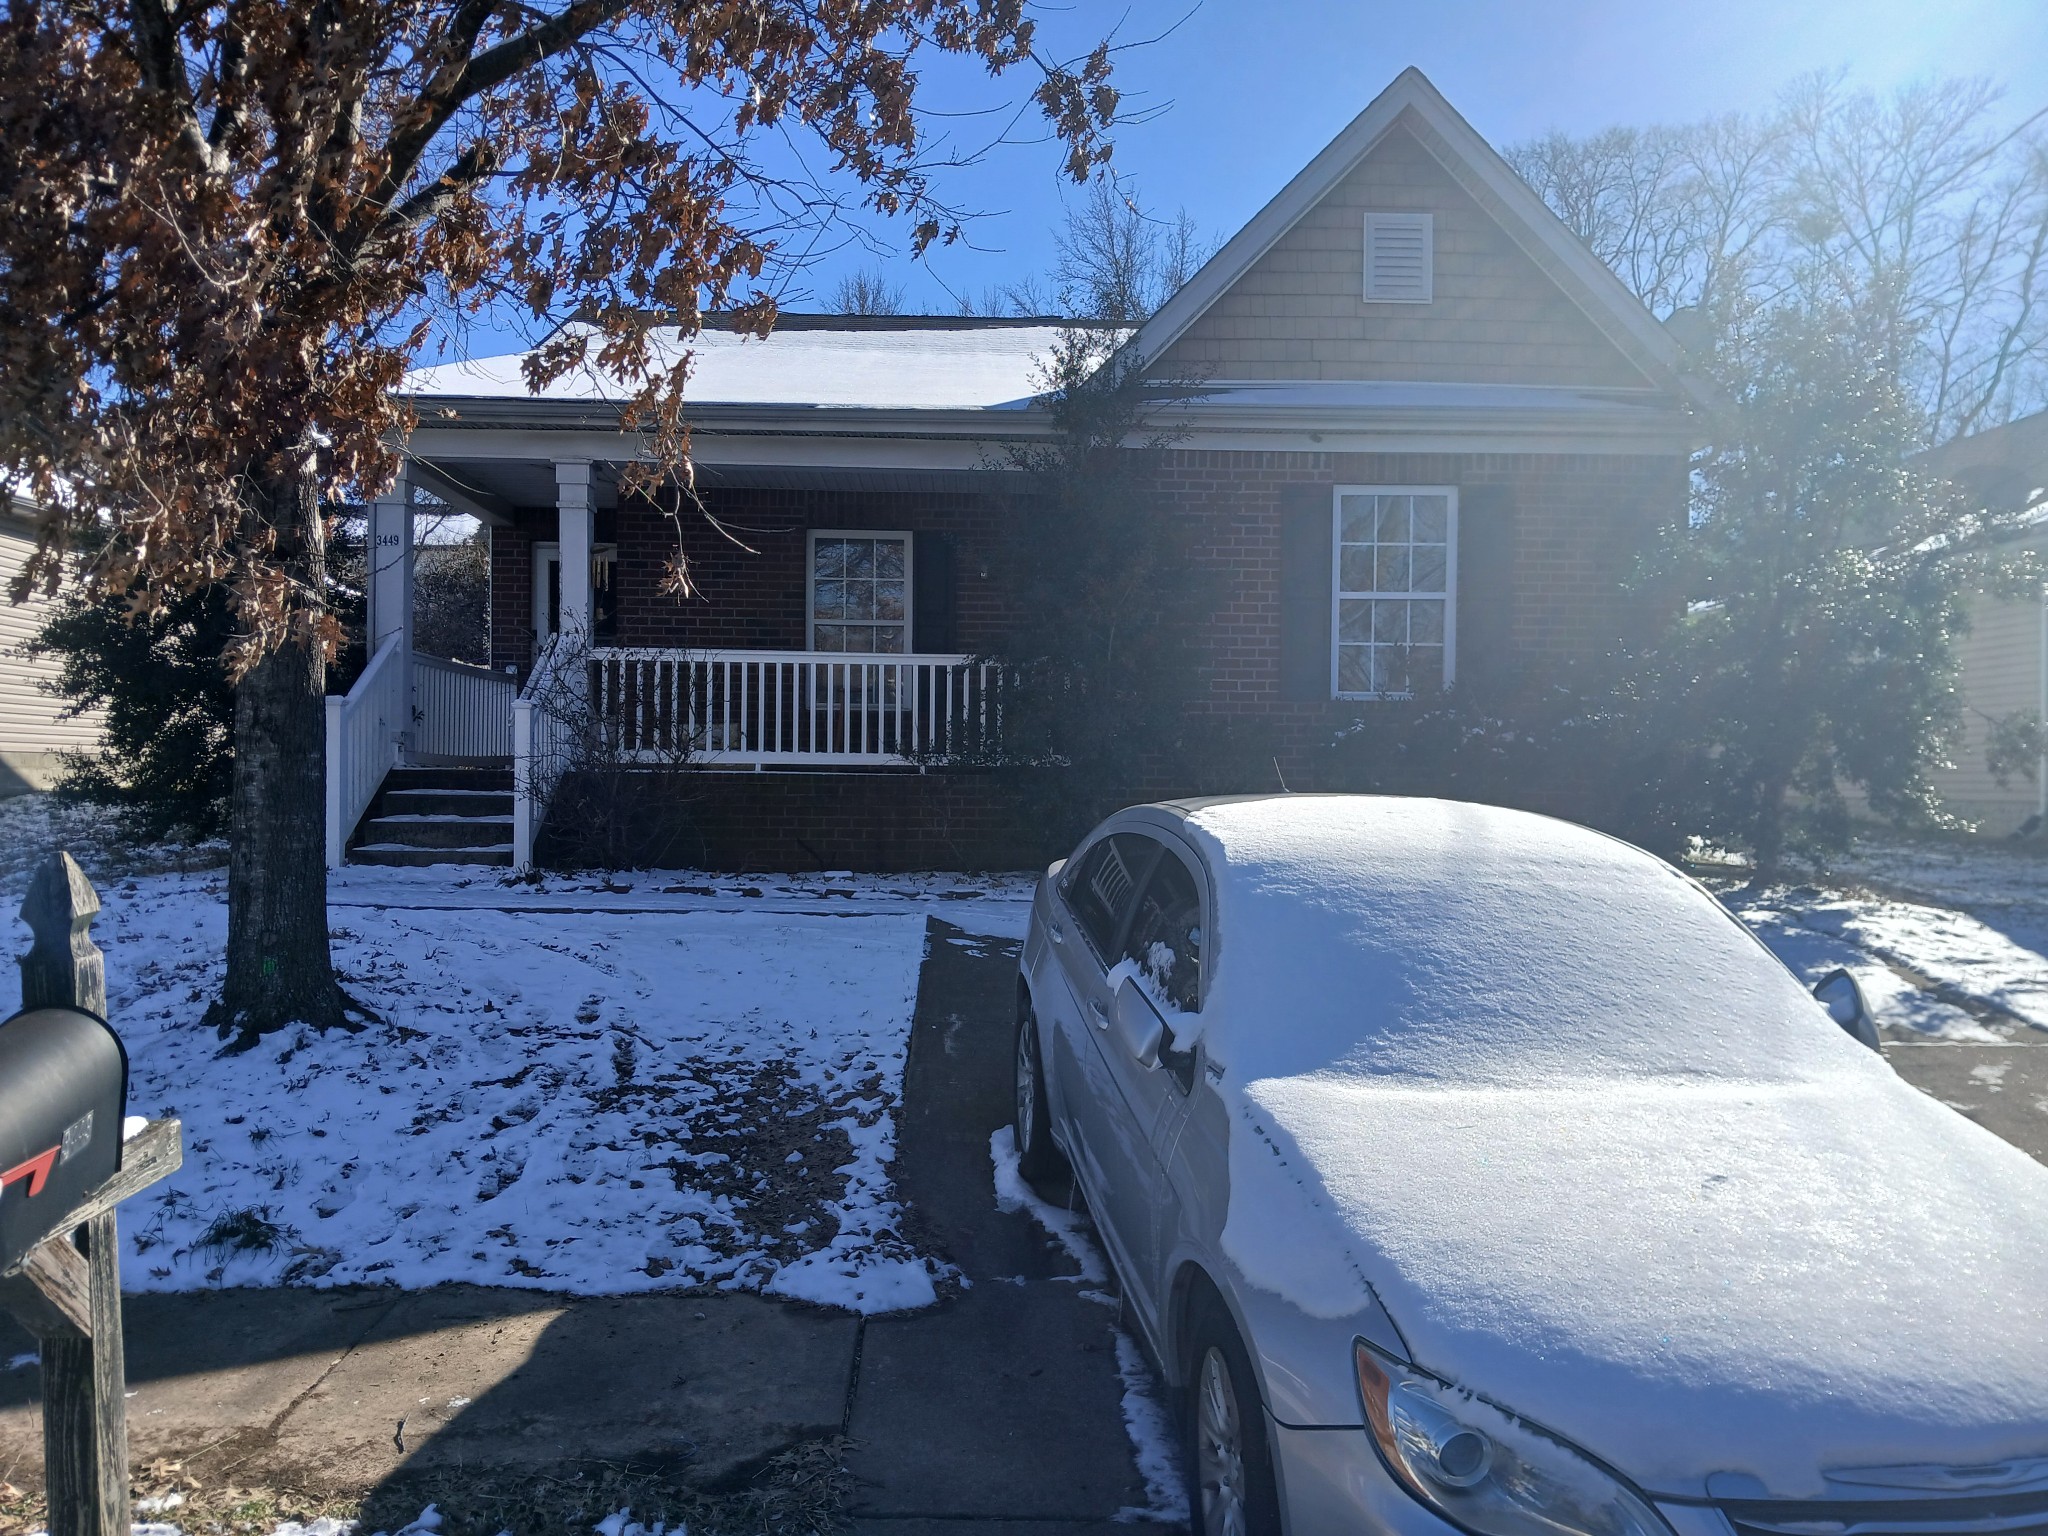
$325,000
3
bds
|
2
ba
|
1,500
sqft
|
built
2005
3449 Rainwood Dr, Nashville, TN 37207
$-304
Cash flow
-4.9%
Cash-on-Cash Return
5.1%
Cap rate
0.7%
Rent to Value Ratio
$635,000
3
bds
|
4
ba
|
1,554
sqft
|
built
2013
2003 Convent Pl, Nashville, TN 37212
$-1,785
Cash flow
-14.7%
Cash-on-Cash Return
2.9%
Cap rate
0.5%
Rent to Value Ratio
$585,000
5
bds
|
5
ba
|
3,800
sqft
|
built
1994
3809 Park Royal Ln, Antioch, TN 37013
$-1,416
Cash flow
-12.6%
Cash-on-Cash Return
3.4%
Cap rate
0.5%
Rent to Value Ratio
$309,500
3
bds
|
3
ba
|
2,255
sqft
|
built
2015
809 Cedarstone Way, Nashville, TN 37214
$162
Cash flow
2.7%
Cash-on-Cash Return
6.9%
Cap rate
0.9%
Rent to Value Ratio
$420,000
4
bds
|
1
ba
|
1,200
sqft
|
built
1960
4109 Edwards Ave, Nashville, TN 37216
$-837
Cash flow
-10.4%
Cash-on-Cash Return
3.9%
Cap rate
0.5%
Rent to Value Ratio

$995,000
2
bds
|
2
ba
|
1,210
sqft
|
built
2014
1212 Laurel St, Nashville, TN 37203
$-3,020
Cash flow
-15.8%
Cash-on-Cash Return
2.6%
Cap rate
0.5%
Rent to Value Ratio
$1,140,000
2
bds
|
2
ba
|
1,187
sqft
|
built
2018
515 Church St, Nashville, TN 37219
$-4,558
Cash flow
-20.9%
Cash-on-Cash Return
1.5%
Cap rate
0.4%
Rent to Value Ratio
$579,000
3
bds
|
2
ba
|
1,325
sqft
|
built
1963
623 Dunston Dr, Nashville, TN 37211
$-1,624
Cash flow
-14.6%
Cash-on-Cash Return
2.9%
Cap rate
0.4%
Rent to Value Ratio
$379,900
3
bds
|
3
ba
|
1,608
sqft
|
built
1987
3301 Calais Cir, Antioch, TN 37013
$-616
Cash flow
-8.5%
Cash-on-Cash Return
4.3%
Cap rate
0.6%
Rent to Value Ratio
$659,900
3
bds
|
3
ba
|
2,152
sqft
|
built
2015
505 Moore Ave, Nashville, TN 37203
$-1,294
Cash flow
-10.2%
Cash-on-Cash Return
3.9%
Cap rate
0.5%
Rent to Value Ratio

$580,000
3
bds
|
2
ba
|
1,650
sqft
|
built
1963
2376 Baker Rd, Goodlettsville, TN 37072
$-1,269
Cash flow
-11.4%
Cash-on-Cash Return
3.6%
Cap rate
0.5%
Rent to Value Ratio
$543,900
4
bds
|
3
ba
|
1,525
sqft
|
built
1968
437 Ezell Pike, Nashville, TN 37217
$-955
Cash flow
-9.2%
Cash-on-Cash Return
4.2%
Cap rate
0.5%
Rent to Value Ratio
$539,999
2
bds
|
2
ba
|
1,325
sqft
|
built
1967
4215 Harding Pike, Nashville, TN 37205
$-2,533
Cash flow
-24.5%
Cash-on-Cash Return
0.6%
Cap rate
0.5%
Rent to Value Ratio
$489,900
4
bds
|
2
ba
|
1,815
sqft
|
built
1966
486 Westcrest Dr, Nashville, TN 37211
$5
Cash flow
0.1%
Cash-on-Cash Return
6.3%
Cap rate
0.8%
Rent to Value Ratio
$499,000
2
bds
|
2
ba
|
1,146
sqft
|
built
2017
2407 8th Ave S, Nashville, TN 37204
n/a
Cash flow
n/a
Cash-on-Cash Return
n/a
Cap rate
n/a
Rent to Value Ratio

$535,000
3
bds
|
4
ba
|
1,753
sqft
|
built
2003
3632 Crossbrooke Dr, Nashville, TN 37221
$-884
Cash flow
-8.6%
Cash-on-Cash Return
4.3%
Cap rate
0.6%
Rent to Value Ratio
$490,000
5
bds
|
4
ba
|
2,306
sqft
|
built
1963
3962 Lawing Dr, Nashville, TN 37207
$317
Cash flow
3.4%
Cash-on-Cash Return
7.0%
Cap rate
0.9%
Rent to Value Ratio
$2,500,000
4
bds
|
3
ba
|
4,174
sqft
|
built
1955
1702 Old Hickory Blvd, Brentwood, TN 37027
$-8,894
Cash flow
-18.6%
Cash-on-Cash Return
2.0%
Cap rate
0.3%
Rent to Value Ratio

$179,900
1
bds
|
1
ba
|
685
sqft
|
built
1967
6680 Charlotte Pike, Nashville, TN 37209
$-149
Cash flow
-4.3%
Cash-on-Cash Return
5.3%
Cap rate
0.9%
Rent to Value Ratio
$230,000
2
bds
|
2
ba
|
1,143
sqft
|
built
1985
138 N Timber Dr, Nashville, TN 37214
$-408
Cash flow
-9.3%
Cash-on-Cash Return
4.1%
Cap rate
0.7%
Rent to Value Ratio
$349,900
3
bds
|
2
ba
|
1,300
sqft
|
built
1972
4913 Boyd Dr, Nashville, TN 37218
$-363
Cash flow
-5.4%
Cash-on-Cash Return
5.0%
Cap rate
0.7%
Rent to Value Ratio

$139,000
2
bds
|
1
ba
|
874
sqft
|
built
1965
550 Harding Pl, Nashville, TN 37211
$-213
Cash flow
-8.0%
Cash-on-Cash Return
4.4%
Cap rate
0.9%
Rent to Value Ratio