Quincy, MA Investment Properties for Sale
Browse homes for sale and investment properties in Quincy, MA. Refine your search by price, property type, or more.
Best cash flowing properties in Quincy, MA

$317,900
1
bds
|
1
ba
|
665
sqft
|
built
1974
308 Quarry St, Quincy, MA 02169
$-642
Cash flow
-10.5%
Cash-on-Cash Return
3.8%
Cap rate
0.7%
Rent to Value Ratio

$359,900
1
bds
|
1
ba
|
640
sqft
|
built
1972
111 Warren Ave, Quincy, MA 02170
$-1,079
Cash flow
-15.6%
Cash-on-Cash Return
2.7%
Cap rate
0.6%
Rent to Value Ratio
14 out of 57 properties for sale in Quincy, MA
Limited Results Shown
Create a free account, or log in to reveal all property listings and enjoy the complete experience.

$420,000
2
bds
|
1
ba
|
807
sqft
|
built
1965
766 Willard St, Quincy, MA 02169
$-1,376
Cash flow
-17.1%
Cash-on-Cash Return
2.3%
Cap rate
0.5%
Rent to Value Ratio

$849,900
3
bds
|
3
ba
|
2,092
sqft
|
built
2009
248 Presidents Ln, Quincy, MA 02169
$-3,062
Cash flow
-18.8%
Cash-on-Cash Return
1.9%
Cap rate
0.4%
Rent to Value Ratio

$339,000
2
bds
|
1
ba
|
767
sqft
|
built
1965
45 Oval Rd, Quincy, MA 02170
$-1,319
Cash flow
-20.3%
Cash-on-Cash Return
1.6%
Cap rate
0.6%
Rent to Value Ratio
$729,000
2
bds
|
2
ba
|
1,070
sqft
|
built
2017
999 Hancock St, Quincy, MA 02169
$-2,971
Cash flow
-21.3%
Cash-on-Cash Return
1.4%
Cap rate
0.4%
Rent to Value Ratio

$399,000
2
bds
|
2
ba
|
868
sqft
|
built
1987
90 Quincy Shore Dr, Quincy, MA 02171
$-1,330
Cash flow
-17.4%
Cash-on-Cash Return
2.3%
Cap rate
0.6%
Rent to Value Ratio

$290,000
0
bds
|
1
ba
|
510
sqft
|
built
1985
133 Commander Shea Blvd, Quincy, MA 02171
$-1,083
Cash flow
-19.5%
Cash-on-Cash Return
1.8%
Cap rate
0.6%
Rent to Value Ratio

$379,000
1
bds
|
1
ba
|
743
sqft
|
built
1906
94 Newbury Ave, Quincy, MA 02171
$-1,110
Cash flow
-15.3%
Cash-on-Cash Return
2.8%
Cap rate
0.6%
Rent to Value Ratio
$428,000
1
bds
|
1
ba
|
880
sqft
|
built
1975
77 Adams St, Quincy, MA 02169
$-1,398
Cash flow
-17.0%
Cash-on-Cash Return
2.3%
Cap rate
0.6%
Rent to Value Ratio
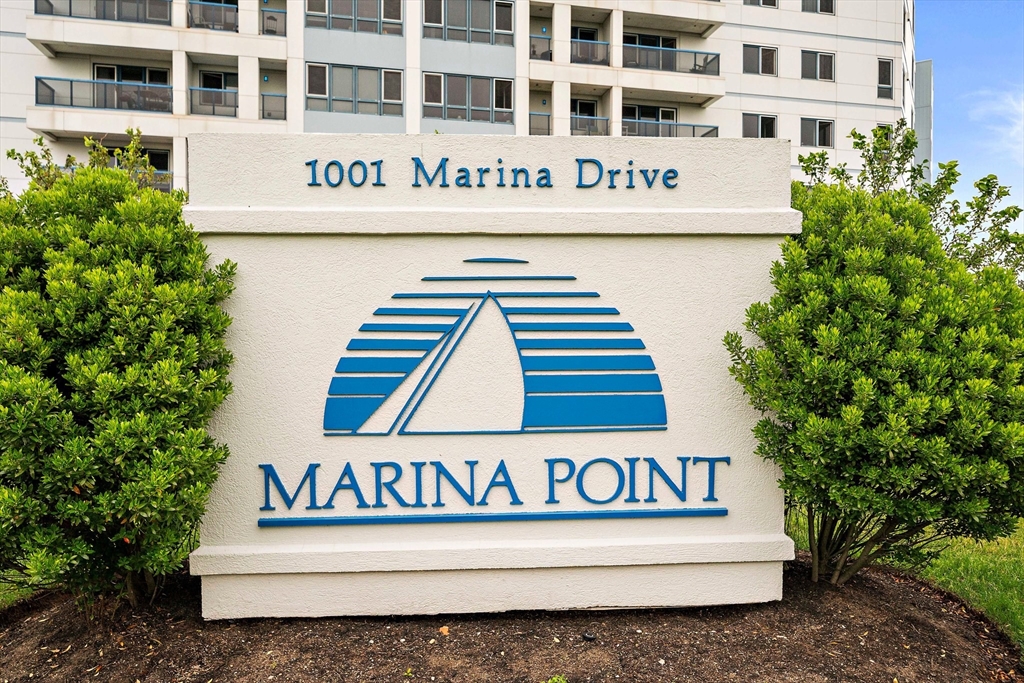
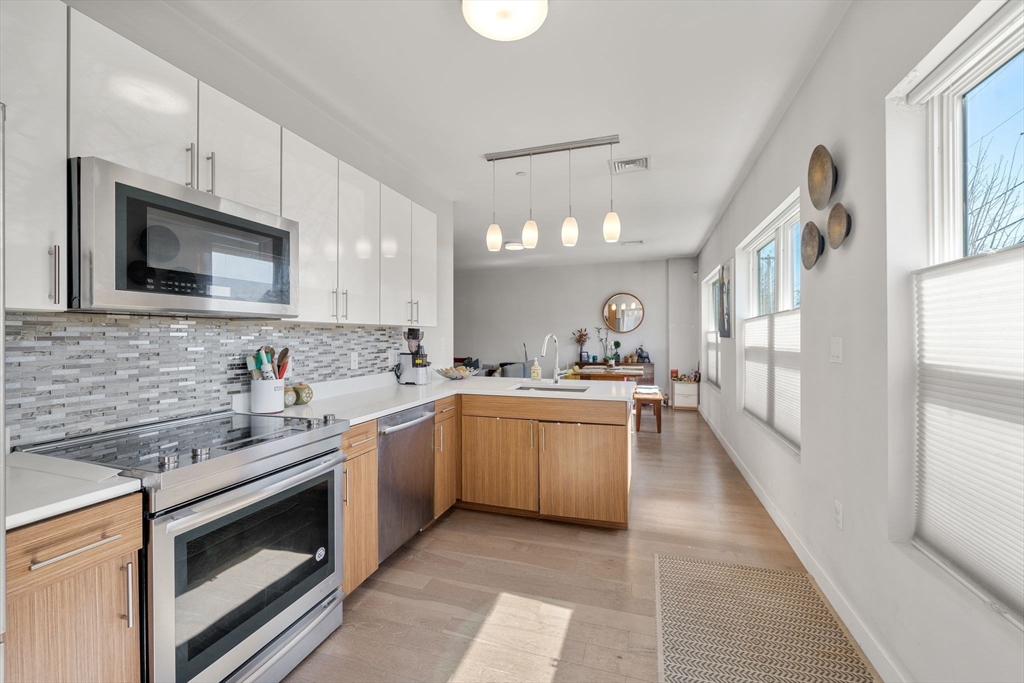
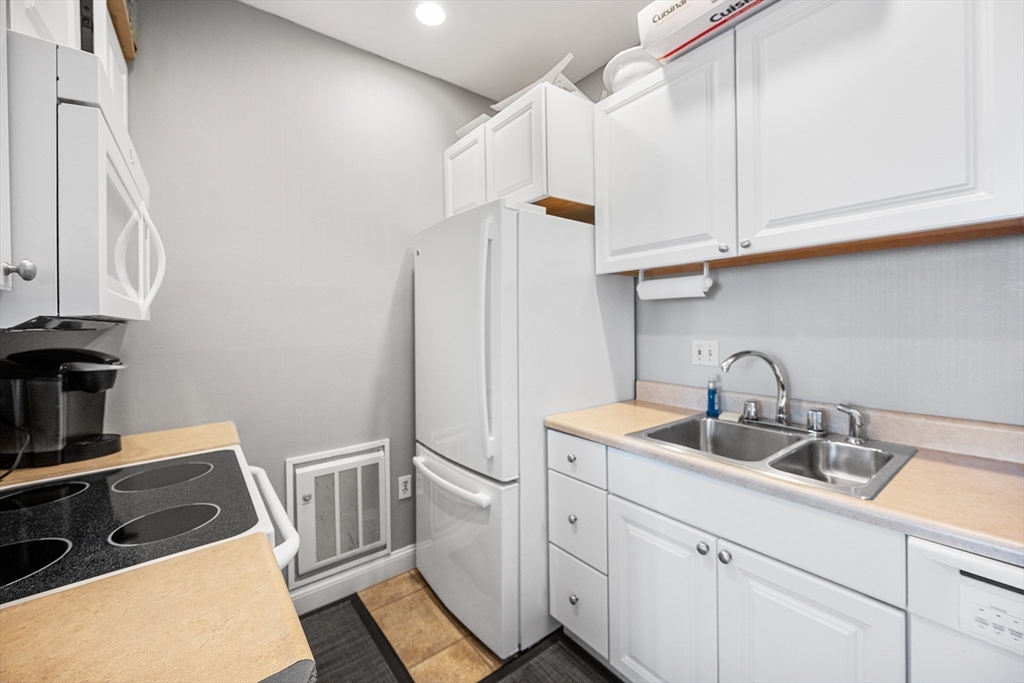
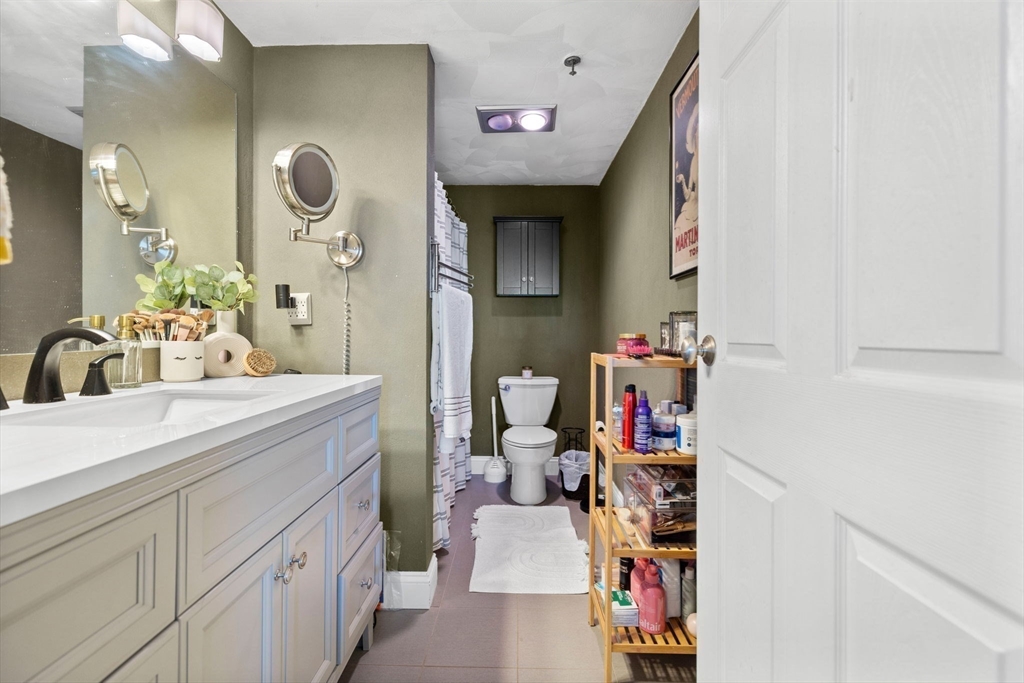
$799,900
2
bds
|
2
ba
|
1,235
sqft
|
built
1988
1001 Marina Dr, Quincy, MA 02171
$-2,876
Cash flow
-18.8%
Cash-on-Cash Return
2.0%
Cap rate
0.5%
Rent to Value Ratio

$539,000
2
bds
|
1
ba
|
899
sqft
|
built
1988
100 Marina Dr, Quincy, MA 02171
$-1,920
Cash flow
-18.6%
Cash-on-Cash Return
2.0%
Cap rate
0.5%
Rent to Value Ratio

$579,000
2
bds
|
2
ba
|
1,460
sqft
|
built
2005
87 Franklin St, Quincy, MA 02169
$-1,882
Cash flow
-17.0%
Cash-on-Cash Return
2.4%
Cap rate
0.6%
Rent to Value Ratio
$359,900
1
bds
|
1
ba
|
640
sqft
|
built
1972
111 Warren Ave, Quincy, MA 02170
$-1,079
Cash flow
-15.6%
Cash-on-Cash Return
2.7%
Cap rate
0.6%
Rent to Value Ratio
$399,000
2
bds
|
2
ba
|
1,059
sqft
|
built
1986
200 Cove Way, Quincy, MA 02169
$-1,447
Cash flow
-18.9%
Cash-on-Cash Return
1.9%
Cap rate
0.6%
Rent to Value Ratio
$317,900
1
bds
|
1
ba
|
665
sqft
|
built
1974
308 Quarry St, Quincy, MA 02169
$-642
Cash flow
-10.5%
Cash-on-Cash Return
3.8%
Cap rate
0.7%
Rent to Value Ratio