Orange City, FL Investment Properties for Sale
Browse homes for sale and investment properties in Orange City, FL. Refine your search by price, property type, or more.
Best cash flowing properties in Orange City, FL
$199,900
3
bds
|
2
ba
|
1,046
sqft
|
built
2007
870 Regatta Bay Dr, Orange City, FL 32763
$39
Cash flow
1.0%
Cash-on-Cash Return
6.5%
Cap rate
0.8%
Rent to Value Ratio
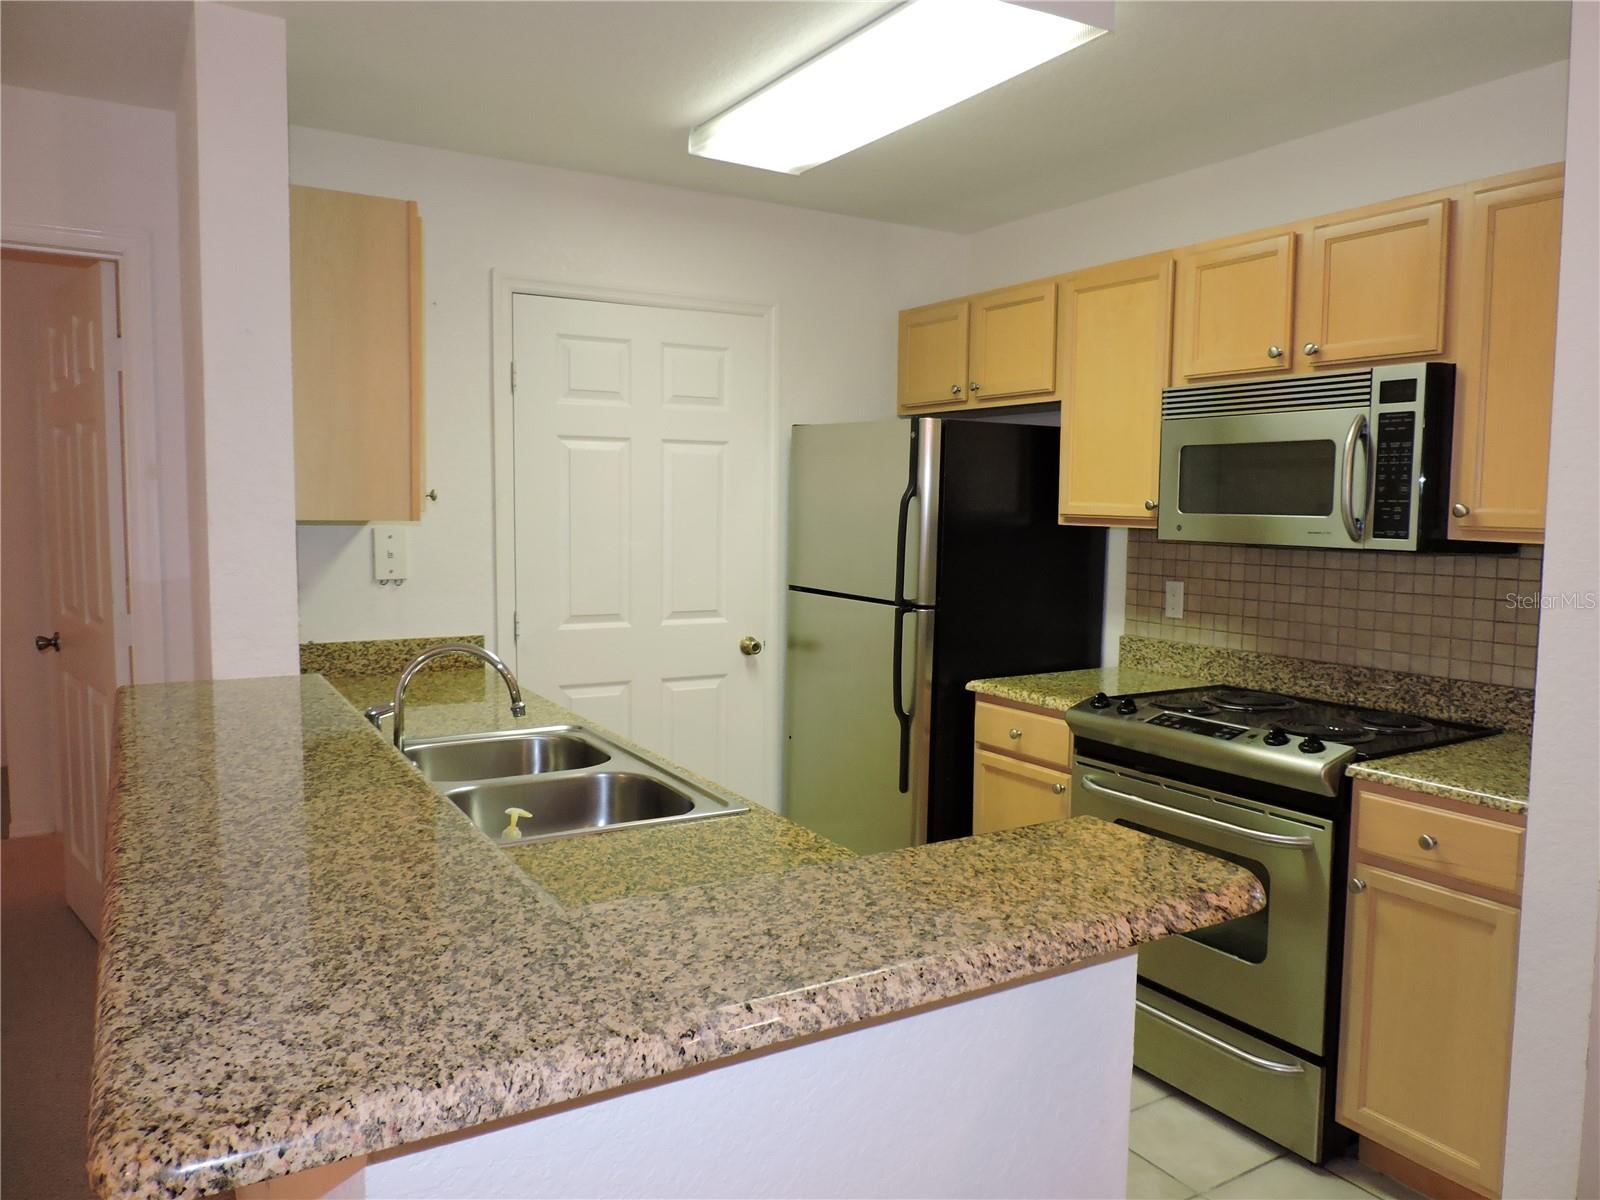
$215,000
2
bds
|
1
ba
|
969
sqft
|
built
1954
410 N Thorpe Ave, Orange City, FL 32763
$1
Cash flow
0.0%
Cash-on-Cash Return
6.3%
Cap rate
0.8%
Rent to Value Ratio
31 out of 58 properties for sale in Orange City, FL
Limited Results Shown
Create a free account, or log in to reveal all property listings and enjoy the complete experience.

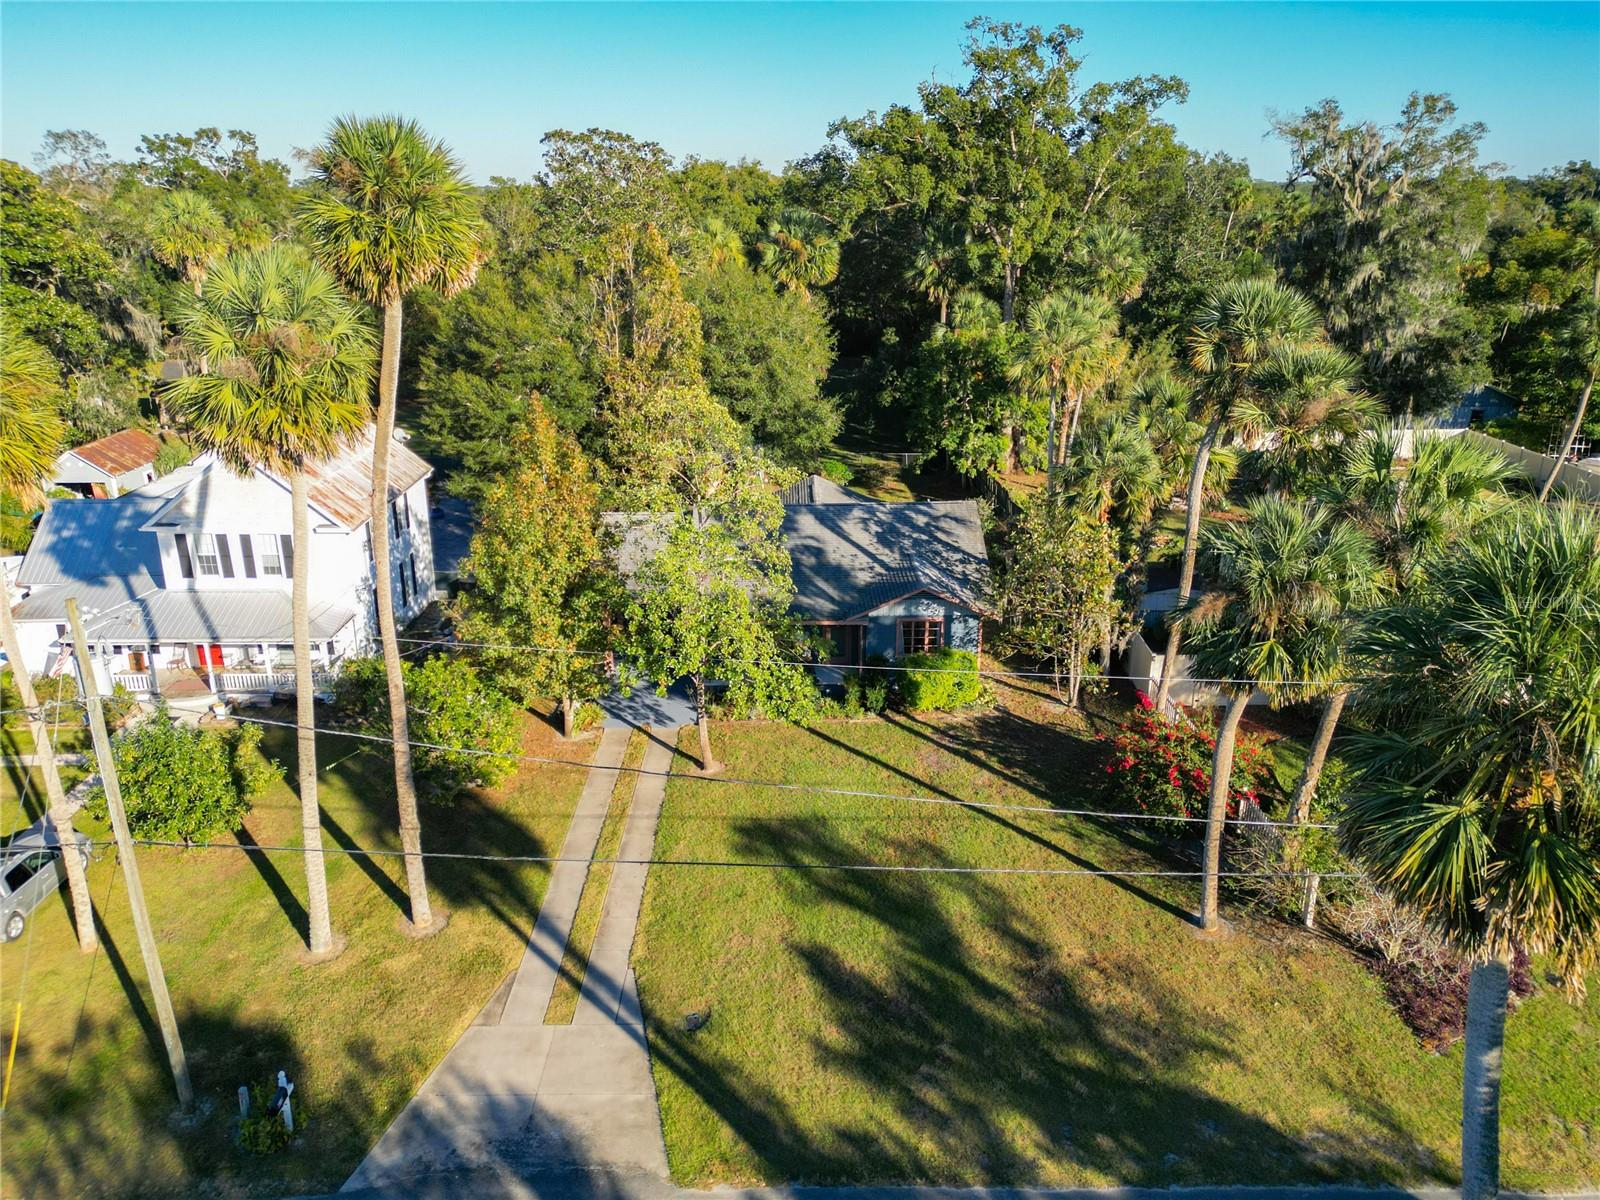
$464,900
4
bds
|
3
ba
|
1,974
sqft
|
built
1941
246 N Oak Ave, Orange City, FL 32763
$-1,579
Cash flow
-17.7%
Cash-on-Cash Return
2.2%
Cap rate
0.3%
Rent to Value Ratio

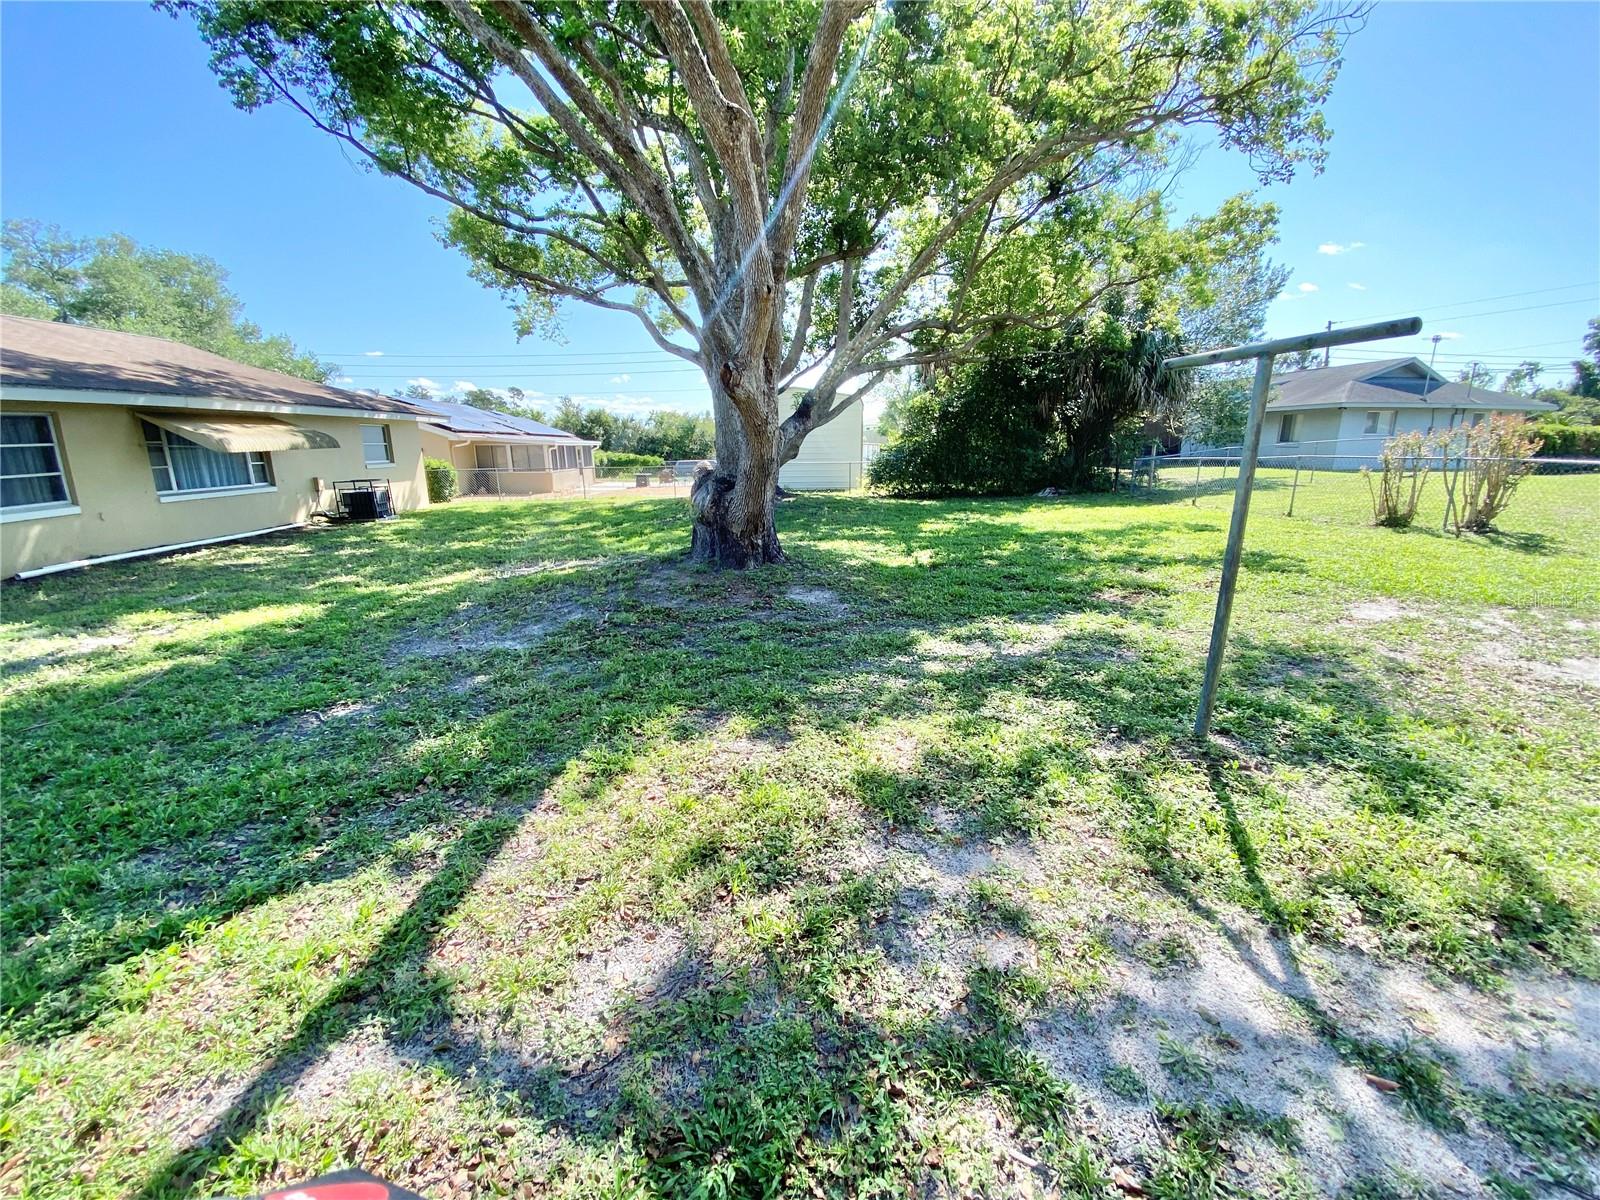
$350,000
4
bds
|
2
ba
|
1,744
sqft
|
built
2008
510 N Leavitt Ave, Orange City, FL 32763
$-739
Cash flow
-11.0%
Cash-on-Cash Return
3.7%
Cap rate
0.7%
Rent to Value Ratio

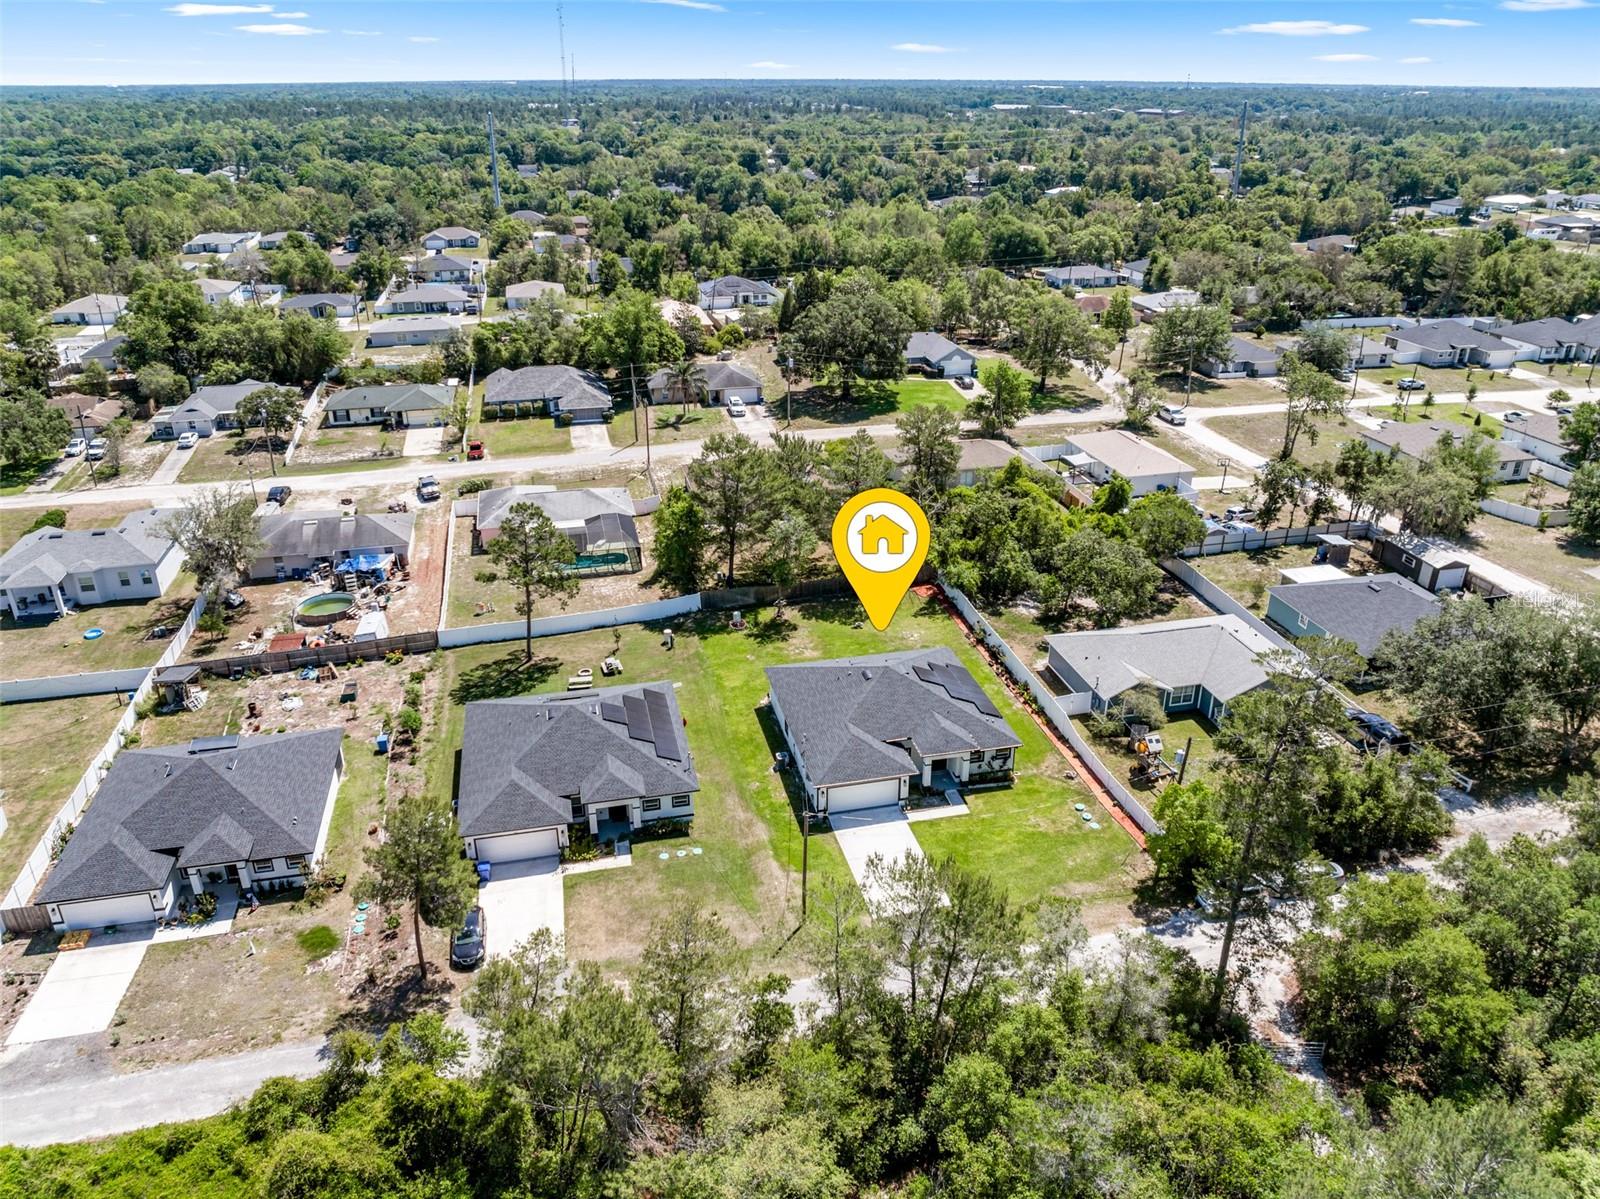
$359,900
4
bds
|
2
ba
|
1,793
sqft
|
built
1979
2470 Pine Tree Circle Dr, Orange City, FL 32763
$-882
Cash flow
-12.8%
Cash-on-Cash Return
3.3%
Cap rate
0.5%
Rent to Value Ratio
$280,000
2
bds
|
2
ba
|
1,407
sqft
|
built
1972
760 Eastridge Dr, Orange City, FL 32763
$-495
Cash flow
-9.2%
Cash-on-Cash Return
4.1%
Cap rate
0.6%
Rent to Value Ratio
$375,000
3
bds
|
2
ba
|
1,600
sqft
|
built
2022
675 S Cedar Ave, Orange City, FL 32763
$-575
Cash flow
-8.0%
Cash-on-Cash Return
4.4%
Cap rate
0.7%
Rent to Value Ratio
$445,000
3
bds
|
2
ba
|
1,782
sqft
|
built
1993
1095 Grand Ave, Orange City, FL 32763
$-1,104
Cash flow
-12.9%
Cash-on-Cash Return
3.3%
Cap rate
0.6%
Rent to Value Ratio
$499,900
4
bds
|
3
ba
|
2,552
sqft
|
built
2006
1933 Oak Estates Dr, Orange City, FL 32763
$-1,245
Cash flow
-13.0%
Cash-on-Cash Return
3.3%
Cap rate
0.6%
Rent to Value Ratio
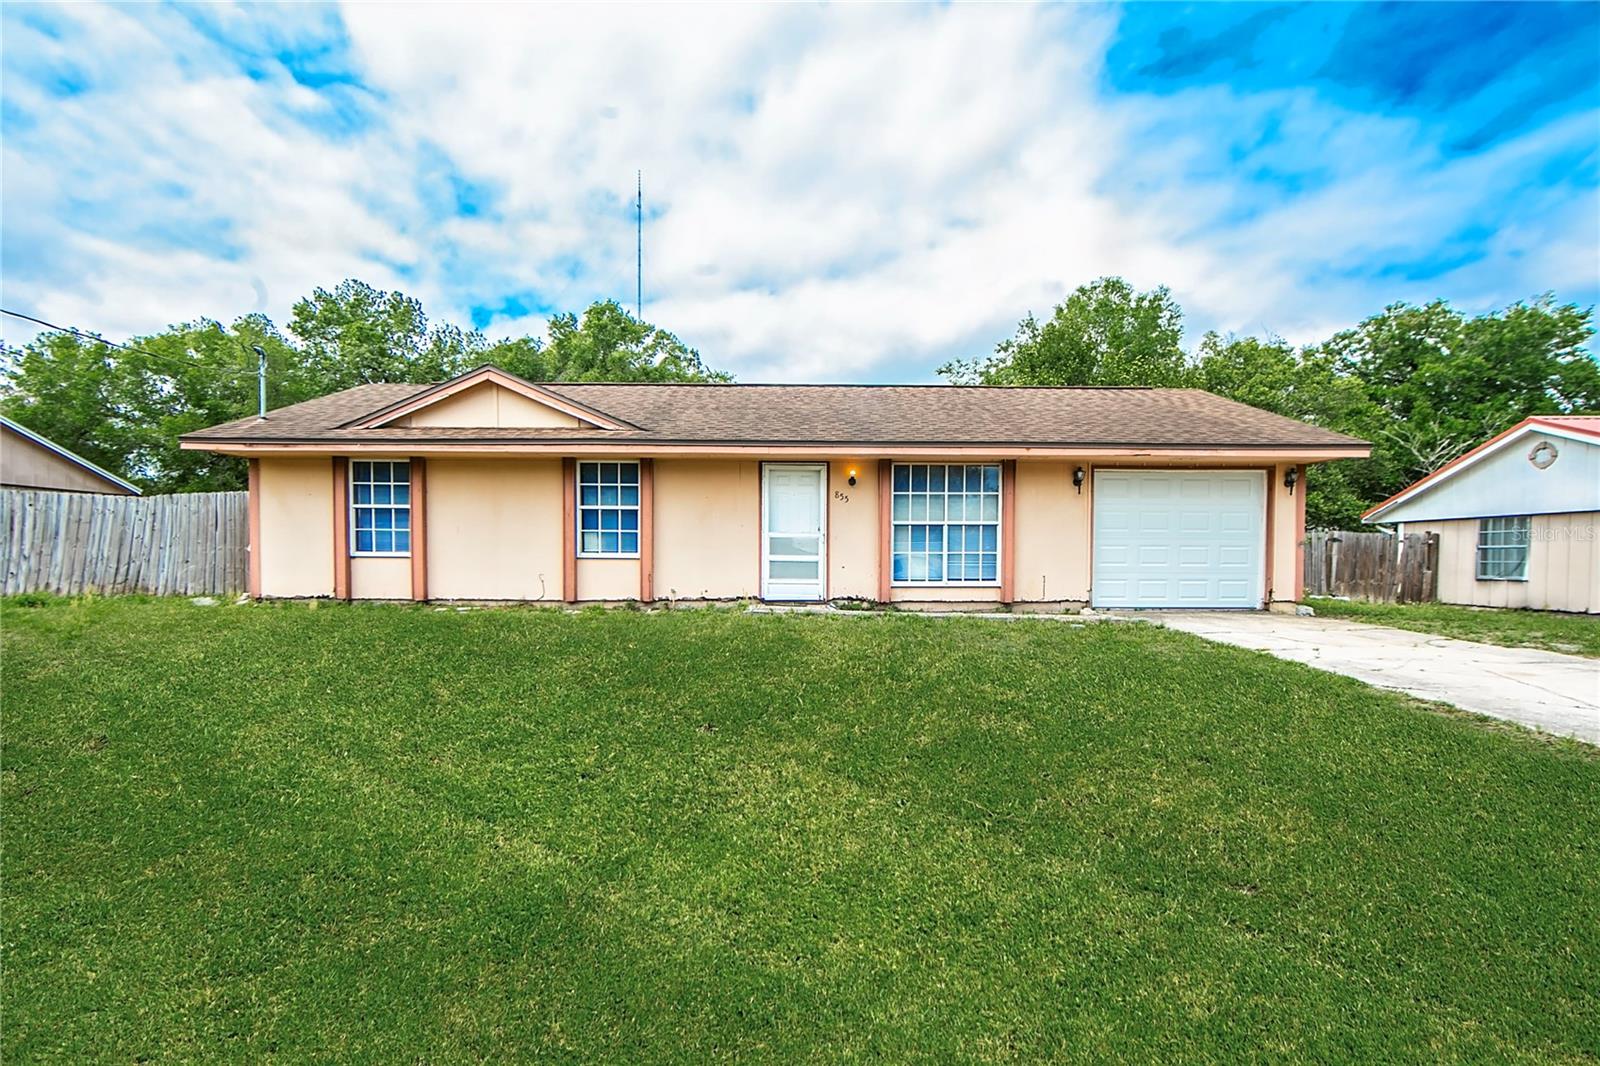
$240,000
3
bds
|
1
ba
|
960
sqft
|
built
1976
855 Third St, Orange City, FL 32763
$-266
Cash flow
-5.8%
Cash-on-Cash Return
4.9%
Cap rate
0.8%
Rent to Value Ratio

$329,000
3
bds
|
2
ba
|
1,535
sqft
|
built
1984
735 Oak Ter, Orange City, FL 32763
$-421
Cash flow
-6.7%
Cash-on-Cash Return
4.7%
Cap rate
0.6%
Rent to Value Ratio

$349,000
4
bds
|
2
ba
|
1,845
sqft
|
built
2023
1375 16th St, Orange City, FL 32763
$-922
Cash flow
-13.8%
Cash-on-Cash Return
3.1%
Cap rate
0.6%
Rent to Value Ratio

$390,000
3
bds
|
2
ba
|
1,871
sqft
|
built
1987
515 Columbus Ave, Orange City, FL 32763
$-796
Cash flow
-10.6%
Cash-on-Cash Return
3.8%
Cap rate
0.7%
Rent to Value Ratio
$525,000
5
bds
|
3
ba
|
2,701
sqft
|
built
2006
1008 Oak Landing Dr, Orange City, FL 32763
$-1,179
Cash flow
-11.7%
Cash-on-Cash Return
3.6%
Cap rate
0.6%
Rent to Value Ratio
$355,000
3
bds
|
2
ba
|
1,803
sqft
|
built
1994
484 Sherwood Oaks Rd, Orange City, FL 32763
$-573
Cash flow
-8.4%
Cash-on-Cash Return
4.3%
Cap rate
0.6%
Rent to Value Ratio
$299,000
3
bds
|
2
ba
|
1,224
sqft
|
built
1991
430 E Lansdowne Ave, Orange City, FL 32763
$-513
Cash flow
-9.0%
Cash-on-Cash Return
4.2%
Cap rate
0.6%
Rent to Value Ratio

$296,500
4
bds
|
2
ba
|
1,486
sqft
|
built
1971
1704 15th St, Orange City, FL 32763
$-582
Cash flow
-10.2%
Cash-on-Cash Return
3.9%
Cap rate
0.6%
Rent to Value Ratio

$354,000
3
bds
|
2
ba
|
1,517
sqft
|
built
2022
1290 9th St, Orange City, FL 32763
$-738
Cash flow
-10.9%
Cash-on-Cash Return
3.8%
Cap rate
0.6%
Rent to Value Ratio
$320,000
3
bds
|
2
ba
|
1,512
sqft
|
built
2002
2859 Doe Run Trl, Orange City, FL 32763
$-532
Cash flow
-8.7%
Cash-on-Cash Return
4.3%
Cap rate
0.6%
Rent to Value Ratio

$340,000
3
bds
|
2
ba
|
1,693
sqft
|
built
1993
2137 Sherwood Forest Dr, Orange City, FL 32763
$-479
Cash flow
-7.4%
Cash-on-Cash Return
4.6%
Cap rate
0.6%
Rent to Value Ratio

$299,900
3
bds
|
2
ba
|
1,200
sqft
|
built
1979
278 Silverstone Dr, Orange City, FL 32763
$-431
Cash flow
-7.5%
Cash-on-Cash Return
4.5%
Cap rate
0.7%
Rent to Value Ratio

$368,900
4
bds
|
3
ba
|
1,605
sqft
|
built
1990
520 Dixson St, Orange City, FL 32763
$-647
Cash flow
-9.2%
Cash-on-Cash Return
4.2%
Cap rate
0.7%
Rent to Value Ratio
$290,000
3
bds
|
2
ba
|
1,228
sqft
|
built
1990
1430 17th St, Orange City, FL 32763
$-606
Cash flow
-10.9%
Cash-on-Cash Return
3.8%
Cap rate
0.6%
Rent to Value Ratio
$269,999
3
bds
|
2
ba
|
1,000
sqft
|
built
2003
250 Hickory Ave, Orange City, FL 32763
$-421
Cash flow
-8.1%
Cash-on-Cash Return
4.4%
Cap rate
0.7%
Rent to Value Ratio

$499,995
5
bds
|
3
ba
|
2,611
sqft
|
built
2007
1062 Golf View Estates Dr, Orange City, FL 32763
$-1,104
Cash flow
-11.5%
Cash-on-Cash Return
3.6%
Cap rate
0.5%
Rent to Value Ratio

$253,000
3
bds
|
2
ba
|
1,206
sqft
|
built
1958
742 Valencia Ave, Orange City, FL 32763
$-229
Cash flow
-4.7%
Cash-on-Cash Return
5.2%
Cap rate
0.7%
Rent to Value Ratio
$309,900
2
bds
|
2
ba
|
1,137
sqft
|
built
1988
755 Fairlawn Dr, Orange City, FL 32763
$-428
Cash flow
-7.2%
Cash-on-Cash Return
4.6%
Cap rate
0.6%
Rent to Value Ratio
$280,000
2
bds
|
2
ba
|
1,147
sqft
|
built
1958
685 E French Ave, Orange City, FL 32763
$-609
Cash flow
-11.3%
Cash-on-Cash Return
3.7%
Cap rate
0.6%
Rent to Value Ratio
$199,900
3
bds
|
2
ba
|
1,046
sqft
|
built
2007
870 Regatta Bay Dr, Orange City, FL 32763
$39
Cash flow
1.0%
Cash-on-Cash Return
6.5%
Cap rate
0.8%
Rent to Value Ratio
$215,000
3
bds
|
1
ba
|
988
sqft
|
built
1981
990 Liskeard Ave, Orange City, FL 32763
$-186
Cash flow
-4.5%
Cash-on-Cash Return
5.2%
Cap rate
0.7%
Rent to Value Ratio
$349,900
3
bds
|
2
ba
|
1,449
sqft
|
built
1994
2122 King Richards Ct, Orange City, FL 32763
$-373
Cash flow
-5.6%
Cash-on-Cash Return
5.0%
Cap rate
0.7%
Rent to Value Ratio
$215,000
2
bds
|
1
ba
|
969
sqft
|
built
1954
410 N Thorpe Ave, Orange City, FL 32763
$1
Cash flow
0.0%
Cash-on-Cash Return
6.3%
Cap rate
0.8%
Rent to Value Ratio

$314,990
3
bds
|
2
ba
|
1,440
sqft
|
built
1995
288 Silverstone Dr, Orange City, FL 32763
$-344
Cash flow
-5.7%
Cash-on-Cash Return
5.0%
Cap rate
0.7%
Rent to Value Ratio