Mulberry, FL Investment Properties for Sale
Browse homes for sale and investment properties in Mulberry, FL. Refine your search by price, property type, or more.
Best cash flowing properties in Mulberry, FL

$100,000
2
bds
|
2
ba
|
2,538
sqft
|
built
1915
208 E Badcock Blvd, Mulberry, FL 33860
$556
Cash flow
29.0%
Cash-on-Cash Return
12.8%
Cap rate
1.8%
Rent to Value Ratio

$125,000
2
bds
|
1
ba
|
720
sqft
|
built
1953
6925 3rd St, Mulberry, FL 33860
$191
Cash flow
8.0%
Cash-on-Cash Return
8.0%
Cap rate
1.1%
Rent to Value Ratio
35 out of 74 properties for sale in Mulberry, FL
Limited Results Shown
Create a free account, or log in to reveal all property listings and enjoy the complete experience.
$125,000
2
bds
|
1
ba
|
720
sqft
|
built
1953
6925 3rd St, Mulberry, FL 33860
$191
Cash flow
8.0%
Cash-on-Cash Return
8.0%
Cap rate
1.1%
Rent to Value Ratio
$315,000
3
bds
|
2
ba
|
1,538
sqft
|
built
2006
2808 Oak Hammock Loop, Mulberry, FL 33860
$-484
Cash flow
-8.0%
Cash-on-Cash Return
4.3%
Cap rate
0.6%
Rent to Value Ratio
$349,000
3
bds
|
3
ba
|
2,535
sqft
|
built
2005
2415 Brownwood Dr, Mulberry, FL 33860
$-662
Cash flow
-9.9%
Cash-on-Cash Return
3.9%
Cap rate
0.6%
Rent to Value Ratio
$315,000
3
bds
|
2
ba
|
1,534
sqft
|
built
2006
2764 Oak Hammock Loop, Mulberry, FL 33860
$-440
Cash flow
-7.3%
Cash-on-Cash Return
4.5%
Cap rate
0.6%
Rent to Value Ratio

$2,750,000
5
bds
|
5
ba
|
6,385
sqft
|
built
2010
460 Canterwood Dr, Mulberry, FL 33860
$-12,958
Cash flow
-24.6%
Cash-on-Cash Return
0.5%
Cap rate
0.1%
Rent to Value Ratio

$280,000
4
bds
|
2
ba
|
1,877
sqft
|
built
1946
800 N Church Ave, Mulberry, FL 33860
$-42
Cash flow
-0.8%
Cash-on-Cash Return
6.0%
Cap rate
0.8%
Rent to Value Ratio
$375,000
3
bds
|
3
ba
|
2,669
sqft
|
built
2016
4280 Moon Shadow Loop, Mulberry, FL 33860
$-842
Cash flow
-11.7%
Cash-on-Cash Return
3.5%
Cap rate
0.6%
Rent to Value Ratio
$339,900
3
bds
|
2
ba
|
1,643
sqft
|
built
1974
3465 Peacock Ln, Mulberry, FL 33860
$-601
Cash flow
-9.2%
Cash-on-Cash Return
4.0%
Cap rate
0.6%
Rent to Value Ratio
$474,900
4
bds
|
3
ba
|
3,353
sqft
|
built
1979
34 Misty Meadow Ln, Mulberry, FL 33860
$-743
Cash flow
-8.2%
Cash-on-Cash Return
4.3%
Cap rate
0.6%
Rent to Value Ratio
$299,000
3
bds
|
2
ba
|
1,706
sqft
|
built
1976
4290 Old Colony Rd, Mulberry, FL 33860
$-353
Cash flow
-6.2%
Cash-on-Cash Return
4.7%
Cap rate
0.7%
Rent to Value Ratio

$400,000
3
bds
|
2
ba
|
1,762
sqft
|
built
1920
4145 Willis Rd, Mulberry, FL 33860
$-581
Cash flow
-7.6%
Cash-on-Cash Return
4.4%
Cap rate
0.6%
Rent to Value Ratio

$375,900
4
bds
|
3
ba
|
2,885
sqft
|
built
2005
2448 Brownwood Dr, Mulberry, FL 33860
$-558
Cash flow
-7.7%
Cash-on-Cash Return
4.4%
Cap rate
0.7%
Rent to Value Ratio
$325,000
4
bds
|
4
ba
|
2,088
sqft
|
built
1988
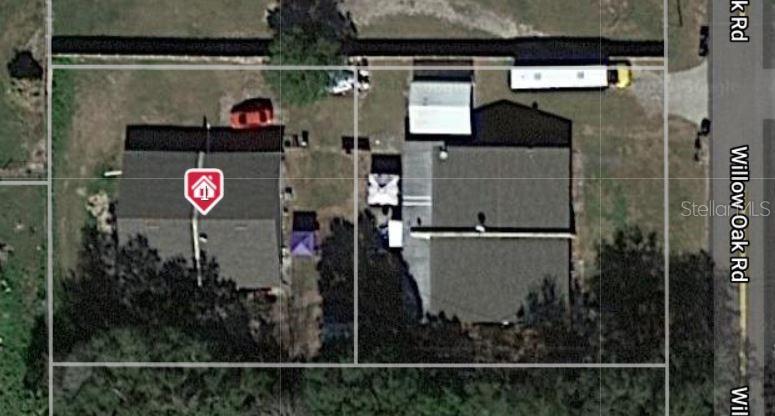
3620 Willow Oak Rd, Mulberry, FL 33860
$-1,045
Cash flow
-16.8%
Cash-on-Cash Return
2.3%
Cap rate
0.4%
Rent to Value Ratio
$319,000
4
bds
|
4
ba
|
2,256
sqft
|
built
1990
3626 Willow Oak Rd, Mulberry, FL 33860
$-776
Cash flow
-12.7%
Cash-on-Cash Return
3.2%
Cap rate
0.5%
Rent to Value Ratio

$490,000
5
bds
|
4
ba
|
3,428
sqft
|
built
2017
4248 Moon Shadow Loop, Mulberry, FL 33860
$-875
Cash flow
-9.3%
Cash-on-Cash Return
4.0%
Cap rate
0.6%
Rent to Value Ratio

$233,999
2
bds
|
1
ba
|
1,220
sqft
|
built
1953
308 NE 10th Ave, Mulberry, FL 33860
$36
Cash flow
0.8%
Cash-on-Cash Return
6.3%
Cap rate
0.9%
Rent to Value Ratio
$282,000
4
bds
|
1
ba
|
1,442
sqft
|
built
1965
311 NE 5th Ave, Mulberry, FL 33860
$-508
Cash flow
-9.4%
Cash-on-Cash Return
4.0%
Cap rate
0.6%
Rent to Value Ratio

$310,000
3
bds
|
2
ba
|
1,271
sqft
|
built
2005
4889 Myrtle View Dr N, Mulberry, FL 33860
$-363
Cash flow
-6.1%
Cash-on-Cash Return
4.7%
Cap rate
0.6%
Rent to Value Ratio
$175,000
2
bds
|
2
ba
|
1,038
sqft
|
built
1980
5225 Imperial Lakes Blvd, Mulberry, FL 33860
$-469
Cash flow
-14.0%
Cash-on-Cash Return
2.9%
Cap rate
0.9%
Rent to Value Ratio
$310,000
3
bds
|
2
ba
|
1,240
sqft
|
built
1999
2637 Sundance Cir, Mulberry, FL 33860
$-355
Cash flow
-6.0%
Cash-on-Cash Return
4.8%
Cap rate
0.6%
Rent to Value Ratio
$414,900
4
bds
|
3
ba
|
2,370
sqft
|
built
2022
113 St Thomas Dr, Mulberry, FL 33860
$-719
Cash flow
-9.0%
Cash-on-Cash Return
4.1%
Cap rate
0.7%
Rent to Value Ratio

$439,900
3
bds
|
2
ba
|
2,424
sqft
|
built
1993
4435 Fairway Oaks Dr, Mulberry, FL 33860
$-518
Cash flow
-6.1%
Cash-on-Cash Return
4.7%
Cap rate
0.7%
Rent to Value Ratio
$850,000
3
bds
|
1
ba
|
1,376
sqft
|
built
1960
2020 State Road 37 S, Mulberry, FL 33860
$-2,989
Cash flow
-18.3%
Cash-on-Cash Return
1.9%
Cap rate
0.3%
Rent to Value Ratio

$234,900
3
bds
|
2
ba
|
1,053
sqft
|
built
1925
906 SE 3rd St, Mulberry, FL 33860
$-36
Cash flow
-0.8%
Cash-on-Cash Return
6.0%
Cap rate
0.8%
Rent to Value Ratio

$539,900
5
bds
|
3
ba
|
2,827
sqft
|
built
2022
149 St Thomas Dr, Mulberry, FL 33860
$-1,121
Cash flow
-10.8%
Cash-on-Cash Return
3.7%
Cap rate
0.6%
Rent to Value Ratio
$365,000
3
bds
|
3
ba
|
2,311
sqft
|
built
2008
3189 Kearns Rd, Mulberry, FL 33860
$-530
Cash flow
-7.6%
Cash-on-Cash Return
4.4%
Cap rate
0.7%
Rent to Value Ratio

$394,000
4
bds
|
2
ba
|
2,140
sqft
|
built
1979
105 Country Club Ln, Mulberry, FL 33860
$-388
Cash flow
-5.1%
Cash-on-Cash Return
5.0%
Cap rate
0.7%
Rent to Value Ratio
$525,000
3
bds
|
2
ba
|
2,354
sqft
|
built
1967
2220 2nd St, Mulberry, FL 33860
$-1,820
Cash flow
-18.1%
Cash-on-Cash Return
2.0%
Cap rate
0.3%
Rent to Value Ratio
$159,000
3
bds
|
2
ba
|
1,125
sqft
|
built
1951
102 SE 6th Ave, Mulberry, FL 33860
$88
Cash flow
2.9%
Cash-on-Cash Return
6.8%
Cap rate
0.9%
Rent to Value Ratio

$250,000
3
bds
|
1
ba
|
1,104
sqft
|
built
1963
3995 Townley Dr, Mulberry, FL 33860
$-137
Cash flow
-2.9%
Cash-on-Cash Return
5.5%
Cap rate
0.8%
Rent to Value Ratio
$289,900
3
bds
|
2
ba
|
1,303
sqft
|
built
2001
2613 Sundance Cir, Mulberry, FL 33860
$-248
Cash flow
-4.5%
Cash-on-Cash Return
5.1%
Cap rate
0.7%
Rent to Value Ratio
$325,000
3
bds
|
2
ba
|
1,492
sqft
|
built
2023
1047 Aruba Ave, Mulberry, FL 33860
$-546
Cash flow
-8.8%
Cash-on-Cash Return
4.1%
Cap rate
0.7%
Rent to Value Ratio
$419,000
4
bds
|
2
ba
|
2,382
sqft
|
built
2020
153 Heritage Park Ln, Mulberry, FL 33860
$-661
Cash flow
-8.2%
Cash-on-Cash Return
4.3%
Cap rate
0.7%
Rent to Value Ratio
$274,000
3
bds
|
2
ba
|
1,334
sqft
|
built
1920
4925 Magnolia Ave, Mulberry, FL 33860
$100
Cash flow
1.9%
Cash-on-Cash Return
6.6%
Cap rate
0.9%
Rent to Value Ratio
$100,000
2
bds
|
2
ba
|
2,538
sqft
|
built
1915
208 E Badcock Blvd, Mulberry, FL 33860
$556
Cash flow
29.0%
Cash-on-Cash Return
12.8%
Cap rate
1.8%
Rent to Value Ratio