Orleans Parish County Investment Properties for Sale
Browse homes for sale and investment properties in Orleans Parish County. Refine your search by price, property type, or more.
Best cash flowing properties in Orleans Parish County
$99,000
2
bds
|
2
ba
|
2,642
sqft
|
built
1920
1313 S Dupre St, New Orleans, LA 70125
$1,277
Cash flow
67.3%
Cash-on-Cash Return
21.7%
Cap rate
2.6%
Rent to Value Ratio
$89,000
4
bds
|
2
ba
|
1,792
sqft
|
built
1970
4400 Alba Rd, New Orleans, LA 70129
$1,053
Cash flow
61.7%
Cash-on-Cash Return
20.5%
Cap rate
2.5%
Rent to Value Ratio
25 out of 1,872 properties for sale in Orleans Parish County
Limited Results Shown
Create a free account, or log in to reveal all property listings and enjoy the complete experience.

$695,000
1
bds
|
2
ba
|
1,051
sqft
|
built
1887
810 Orleans Ave, New Orleans, LA 70116
$-1,627
Cash flow
-12.2%
Cash-on-Cash Return
3.5%
Cap rate
0.4%
Rent to Value Ratio

$3,095,000
6
bds
|
8
ba
|
7,157
sqft
|
built
1920
44 Audubon Blvd, New Orleans, LA 70118
$-11,328
Cash flow
-19.1%
Cash-on-Cash Return
1.9%
Cap rate
0.2%
Rent to Value Ratio

$389,000
2
bds
|
1
ba
|
1,450
sqft
|
built
1930
1524 N Dorgenois St, New Orleans, LA 70119
$-306
Cash flow
-4.1%
Cash-on-Cash Return
5.3%
Cap rate
0.6%
Rent to Value Ratio
$560,000
3
bds
|
3
ba
|
2,168
sqft
|
built
1996
212 W Robert E Lee Blvd, New Orleans, LA 70124
$-440
Cash flow
-4.1%
Cash-on-Cash Return
5.3%
Cap rate
0.6%
Rent to Value Ratio

$494,000
3
bds
|
3
ba
|
1,673
sqft
|
built
1975
1904 Jena St, New Orleans, LA 70115
$-821
Cash flow
-8.7%
Cash-on-Cash Return
4.3%
Cap rate
0.6%
Rent to Value Ratio

$235,000
6
bds
|
0
ba
|
1,800
sqft
|
built
1940
5717 Saint Claude Ave, New Orleans, LA 70117
$-261
Cash flow
-5.8%
Cash-on-Cash Return
4.9%
Cap rate
0.6%
Rent to Value Ratio

$419,000
3
bds
|
2
ba
|
1,250
sqft
|
built
1995
7464 Pitt St, New Orleans, LA 70118
$-807
Cash flow
-10.0%
Cash-on-Cash Return
4.0%
Cap rate
0.5%
Rent to Value Ratio
$315,000
2
bds
|
1
ba
|
1,090
sqft
|
built
1940
801 Navarre Ave, New Orleans, LA 70124
$-58
Cash flow
-1.0%
Cash-on-Cash Return
6.0%
Cap rate
0.7%
Rent to Value Ratio

$499,000
3
bds
|
4
ba
|
1,660
sqft
|
built
2020
1217 N Tonti St, New Orleans, LA 70119
$-397
Cash flow
-4.2%
Cash-on-Cash Return
5.3%
Cap rate
0.6%
Rent to Value Ratio

$525,000
5
bds
|
4
ba
|
3,725
sqft
|
built
2007
5601 Charlotte Dr, New Orleans, LA 70122
$19
Cash flow
0.2%
Cash-on-Cash Return
6.3%
Cap rate
0.8%
Rent to Value Ratio

$595,000
4
bds
|
3
ba
|
2,774
sqft
|
built
1891
621 Opelousas Ave, New Orleans, LA 70114
$-415
Cash flow
-3.6%
Cash-on-Cash Return
5.4%
Cap rate
0.7%
Rent to Value Ratio

$390,000
2
bds
|
2
ba
|
1,159
sqft
|
built
2017
8616 Oak St, New Orleans, LA 70118
$-104
Cash flow
-1.4%
Cash-on-Cash Return
5.9%
Cap rate
0.7%
Rent to Value Ratio
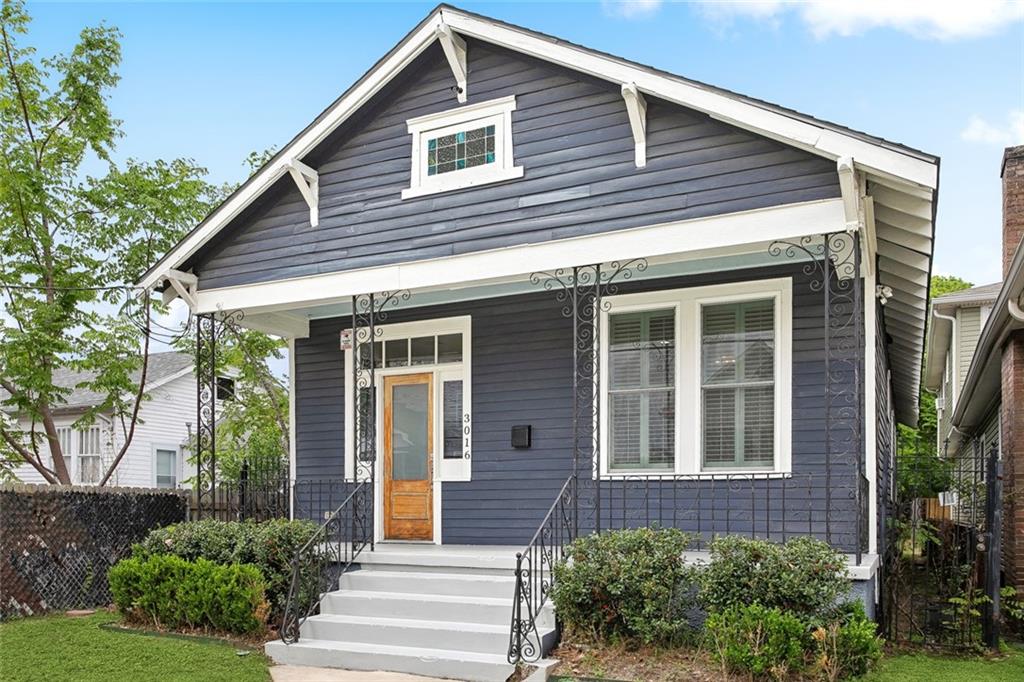
$324,900
3
bds
|
2
ba
|
1,538
sqft
|
built
2021
3016 Burdette St, New Orleans, LA 70125
$-178
Cash flow
-2.9%
Cash-on-Cash Return
5.6%
Cap rate
0.7%
Rent to Value Ratio

$350,000
3
bds
|
2
ba
|
1,854
sqft
|
built
1960
2165 Brutus St, New Orleans, LA 70122
$-309
Cash flow
-4.6%
Cash-on-Cash Return
5.2%
Cap rate
0.6%
Rent to Value Ratio

$650,000
4
bds
|
3
ba
|
2,849
sqft
|
built
2014
5719 Louis Xiv St, New Orleans, LA 70124
$-357
Cash flow
-2.9%
Cash-on-Cash Return
5.6%
Cap rate
0.7%
Rent to Value Ratio

$749,000
4
bds
|
4
ba
|
3,490
sqft
|
built
2017
68 Harbour Town Ct, New Orleans, LA 70131
$-252
Cash flow
-1.8%
Cash-on-Cash Return
5.9%
Cap rate
0.8%
Rent to Value Ratio

$299,000
3
bds
|
2
ba
|
1,964
sqft
|
built
1965
620 River Oaks Dr, New Orleans, LA 70131
$-457
Cash flow
-8.0%
Cash-on-Cash Return
4.4%
Cap rate
0.5%
Rent to Value Ratio
$688,000
3
bds
|
3
ba
|
3,315
sqft
|
built
2007
6021 W End Blvd, New Orleans, LA 70124
$-832
Cash flow
-6.3%
Cash-on-Cash Return
4.8%
Cap rate
0.6%
Rent to Value Ratio
$89,000
4
bds
|
2
ba
|
1,792
sqft
|
built
1970
4400 Alba Rd, New Orleans, LA 70129
$1,053
Cash flow
61.7%
Cash-on-Cash Return
20.5%
Cap rate
2.5%
Rent to Value Ratio
$99,000
2
bds
|
2
ba
|
2,642
sqft
|
built
1920
1313 S Dupre St, New Orleans, LA 70125
$1,277
Cash flow
67.3%
Cash-on-Cash Return
21.7%
Cap rate
2.6%
Rent to Value Ratio
$599,000
5
bds
|
7
ba
|
5,681
sqft
|
built
1978
4500 San Marco Rd, New Orleans, LA 70129
$737
Cash flow
6.4%
Cash-on-Cash Return
7.7%
Cap rate
0.9%
Rent to Value Ratio

$85,000
4
bds
|
2
ba
|
2,860
sqft
|
built
1998
7561 Mercier St, New Orleans, LA 70128
$936
Cash flow
57.5%
Cash-on-Cash Return
19.5%
Cap rate
2.4%
Rent to Value Ratio

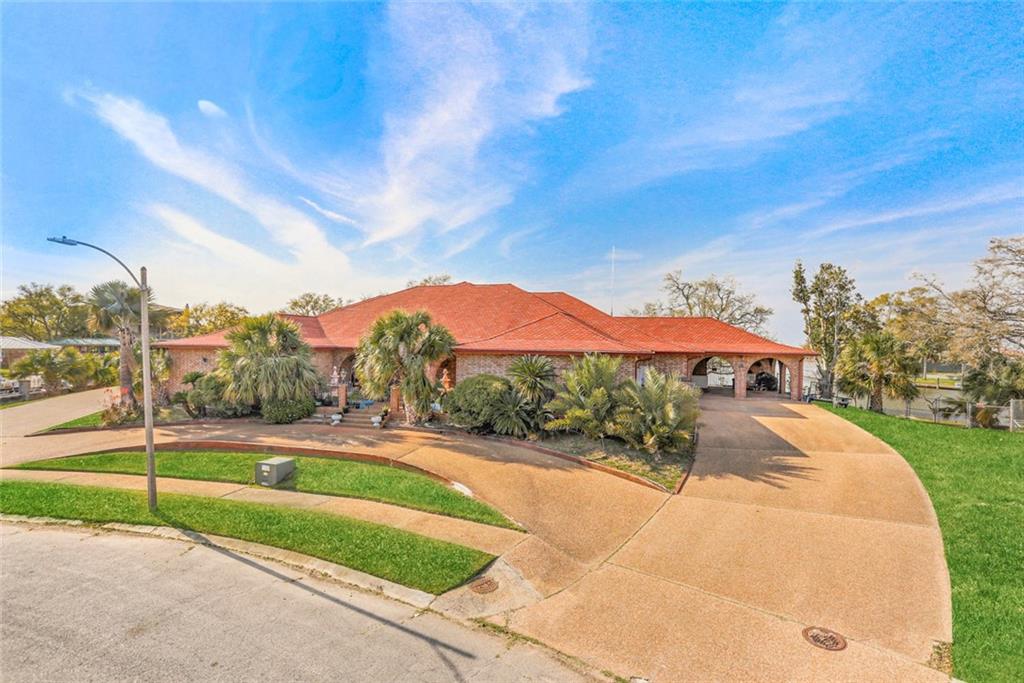
$299,900
5
bds
|
2
ba
|
3,588
sqft
|
built
2006
20159 Old Spanish Trl, New Orleans, LA 70129
$849
Cash flow
14.8%
Cash-on-Cash Return
9.7%
Cap rate
1.2%
Rent to Value Ratio
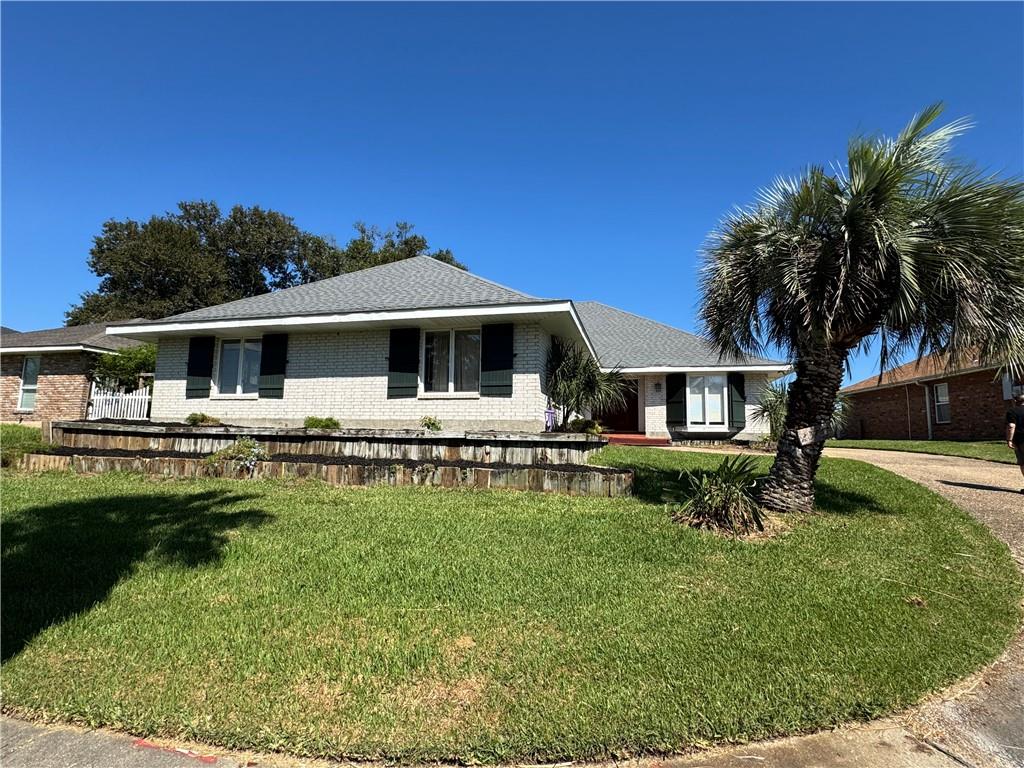
$299,900
4
bds
|
3
ba
|
3,781
sqft
|
built
1975
20737 Old Spanish Trl, New Orleans, LA 70129
$849
Cash flow
14.8%
Cash-on-Cash Return
9.7%
Cap rate
1.2%
Rent to Value Ratio

$125,000
1
bds
|
1
ba
|
841
sqft
|
built
1893
620 Decatur St, New Orleans, LA 70130
$934
Cash flow
39.0%
Cash-on-Cash Return
15.2%
Cap rate
1.8%
Rent to Value Ratio