


Updated over 1 year ago on . Most recent reply

- Real Estate Broker
- Greater Charlotte NC and Charleston, SC areas
- 59
- Votes |
- 107
- Posts
Nationwide Monthly Housing Market Trends for June 2024
DATA, HOUSING DEMAND, HOUSING SUPPLY, MARKET OUTLOOK Jun 04, 2024
- The number of homes actively for sale was notably higher compared with last year, growing by 35.2%, a seventh straight month of growth.
- The total number of unsold homes, including homes that are under contract, increased by 20.9% compared with last year.
- Home sellers were more active this May, with 6.2% more homes newly listed on the market compared with last year.
- The median price of homes for sale this May remained relatively stable compared with last year, growing by 0.3% to $442,500. However, the median price per square foot grew by 3.8%, indicating that the inventory of smaller and more affordable homes has grown in share.
- Homes spent 44 days on the market, which is one day more than last year but eight days shorter than before the COVID-19 pandemic.
According to the Realtor.com® May housing data, the market cooled a bit as mortgage rates went up in April and May due to stubborn inflation. While the median list price nationwide stayed the same as last year, homes did see a price increase per square foot.
The time a typical home spends on the market increased compared with last year, as the inventory of homes for sale continued to grow, but homes were still snapped up more quickly than pre-pandemic levels.
Meanwhile, sellers—who are often buyers themselves—responded to rising mortgage rates with some caution. The growth in newly listed homes dipped, although newly listed homes still remained higher than the previous year.
While the housing market is still in the seller’s territory, it is expected to shift in a buyer-friendly direction as mortgage rates resume their decline over the next year and the number of homes for sale increases. Already, the housing market has taken steps in this direction.
In the meantime, many sellers who bought before the COVID-19 pandemic stand to earn a tidy profit, as the median list price of homes for sale has increased by 37.5% compared with May 2019. Adjusted on a per-square-foot basis to account for more small homes being listed compared with 2019, the median price increased by 52.7% since May 2019.
The number of homes for sale improves but is still low compared with pre-pandemic levels
There were 35.2% more homes actively for sale on a typical day in May compared with the same time in 2023, marking the seventh consecutive month of annual inventory growth.
For the first five months of this year, the inventory of homes actively for sale was at its highest level since 2020. However, while inventory this May is much improved compared with the previous three years, it is still down 34.2% compared with typical 2017 to 2019 levels. This is a slight improvement from last month’s 35.9% gap, as inventory continues to slowly grow toward normalcy.
Looking ahead, active inventory is likely to surpass 2020 levels later this summer. While this will be a notable milestone, the market is likely to achieve this feat because the sharp drop in housing inventory stems back to summer 2020, when the pandemic-era housing market began to heat up as mortgage rates tumbled and buyers made up for a lost spring. We expect a still-sizable gap between 2024 housing inventory and the pre-pandemic housing market to persist as it closes only gradually.
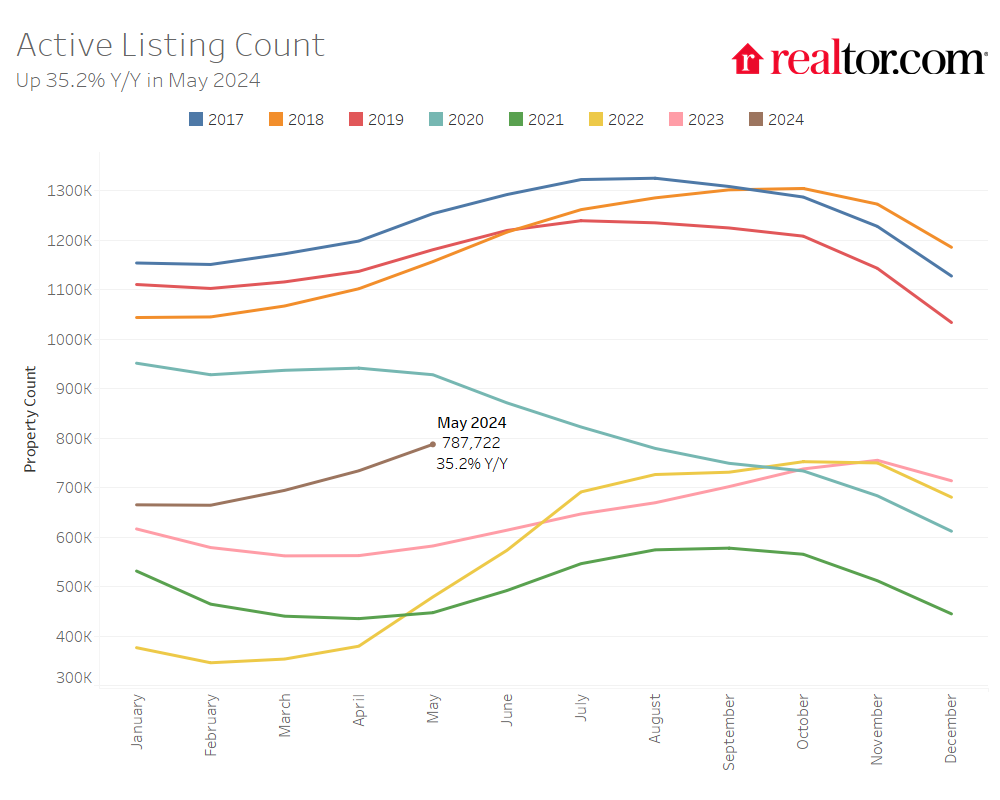
In May, as in the previous three months, the growth in homes particularly priced in the $200,000 to $350,000 range outpaced all other price categories, as home inventory in this range grew by 46.6% compared with last year, surpassing even last month’s high 41.0% growth rate. This increase is again primarily fueled by a greater availability of smaller and more affordable homes in the South.
The total number of homes for sale, including homes that were under contract but not yet sold, increased by 20.9% compared with last year, growing on an annual basis for the sixth month in a row.
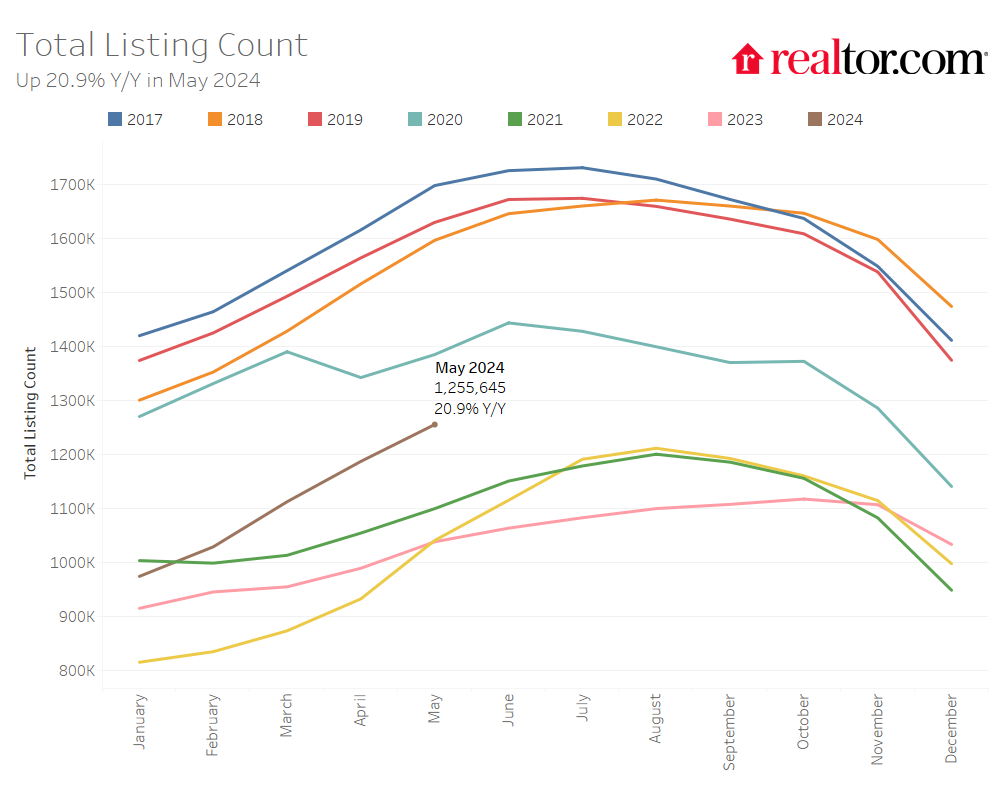
The number of homes under contract but not yet sold (pending listings) increased by 2.7%, which is lower than last month’s 6.3% growth rate.
After reports of unexpectedly persistent inflation, mortgage rates increased in April on expectations that the Federal Reserve will likely push back its first cut to the primary policy rate, which was originally expected in June of this year.
Last month, we predicted that the growth in pending listings would slow, and this materialized in May. As pending home sales are an early indicator of the direction of existing-home sales, it is possible that sales may decelerate further in May and June, after they indeed declined 1.9% in April.
However, sellers continued to list their homes in higher numbers this May as newly listed homes were 6.2% above last year’s levels. While a notable deceleration from last month’s 12.2% growth rate, it marks the seventh month of increasing listing activity after a 17-month streak of decline.
Many sellers are themselves homebuyers, which has made listing activity more sensitive to changes in mortgage rates. The increase in mortgage rates in April led to a slowing of the pace of growth in listing activity. However, we expect selling activity to normalize as rates inch their way down over the next year.
Regional and metro area inventory trends
The South and West are closest to bridging the inventory gap
In May, all four regions saw active inventory grow over the previous year. Compared with last year, listings grew by 47.2% in the South, 34.5% in the West, 20.5% in the Midwest, and only 9.4% in the Northeast.
Compared with the typical May from 2017 to 2019, before the COVID-19 pandemic, the West saw the smallest gap in inventory, down 21.2% compared with pre-pandemic levels. The gap was 22.1% in the South, and much larger in the Midwest and Northeast, at 52.0% and 60.0%, respectively.
With inventory more scarce in the Midwest and Northeast, sellers there have less competition for their listed homes. Further down in the report, we also note that price growth compared with last year has been higher in the Midwest and Northeast compared with the South and West, where growing inventory has reined in price growth.
The inventory of homes for sale also increased in all of the 50 largest metros compared with last year. Metros that saw the most inventory growth included Tampa (+87.4%), Phoenix (+80.3%), and Orlando (+78.0%).
Despite higher inventory growth compared with last year, most metros still had a lower level of inventory when compared with pre-pandemic years. Among the 50 largest metro areas, only 12 saw higher levels of inventory in May compared with typical 2017 to 2019 levels. However, this is up from only seven last month.
The top metros that saw inventory surpass pre-pandemic levels were predominantly in the South and West and included Austin (+33.6%), San Antonio (+31.8%), and Denver (+22.0%).
The South had the smallest gap in newly listed homes compared with before the pandemic
Compared with May 2023, newly listed home inventory increased the most in the West, by 9.3%, followed closely by the South (+8.1%). However, newly listed homes declined in the Midwest and Northeast, by 0.1% and 4.1%, respectively.
The gap in newly listed homes compared with pre-pandemic 2017 to 2019 levels was also the lowest in the South, where newly listed homes were 15.0% below pre-pandemic levels. In comparison, they were down 29.3% in the West, 31.6% in the Midwest, and 39.4% in the Northeast.
In May, 43 of the 50 largest metros saw new listings increase over the previous year, down from 48 last month. However, no large metros saw more newly listed homes this May compared with the typical pace of new listings from May 2017 to 2019 before the pandemic, as many would-be sellers continue to wait and see what will happen to mortgage rates this year.
The metros that saw the largest growth in newly listed homes compared with last year included Seattle (+37.3%), San Jose (+26.5%), and Tampa (+22.3%).
Homes are spending more time on the market compared with last year, but less than pre-pandemic levels
The typical home spent 44 days on the market this May, which is 1 day more than the same time last year. May marks the second month in a row where homes spent more time on the market compared with the previous year as inventory continues to grow and home sales remain sluggish. However, the time a typical home spends on the market is more than a week (8 days) less than the average May from 2017 to 2019.
Regional and metro area time on the market trends
In the South, where the growth in home inventory has been the largest in the past several months, the typical home spent four more days on the market in May compared with last year. However, in the Midwest (-3 days), Northeast (-5 days), and West (-2 days), homes are still spending less time on the market than last year.
While all regions were still seeing time on the market below pre-pandemic levels, in the West, homes are spending only three days less on the market compared with the typical May from 2017 to 2019. Time on the market was nine days less than pre-pandemic levels in the South, 14 days less in the Midwest, and 16 days less in the Northeast.
Meanwhile, time on the market decreased compared with last year in 33 of the 50 largest metro areas this May, up from 26 last month. It decreased the most in Providence (-13 days), Raleigh (-12 days), and Philadelphia (-10 days).
Time on the market increased compared with last year in 17 of the 50 largest metros, including Tampa (+6 days) and Denver (+5 days). Four predominantly Western markets saw homes spend more time on the market than typical 2017 to 2019 pre-pandemic timing: Portland (+6 days), Denver (+5 days), Kansas City (+2 days), and Seattle (+2 days).
The median list price remained stable compared with last May, but the price per square foot continues to rise
The national median list price continued to increase seasonally, to $442,500 in May compared with $430,000 in April, and the median list price remained relatively stable compared with the same time last year, when it was $441,000. However, when a change in the mix of inventory toward smaller homes is accounted for, the typical home listed this year has increased in asking price compared with last year.
The median list price per square foot increased by 3.8% in May compared with the same time last year. Moreover, the typical listed home price has grown by 37.5% compared with May 2019, but the price per square foot grew by 52.7%.
While the typical home for sale is listed at a similar price to last year, higher mortgage rates compared with last May still increased the monthly cost of financing 80% of the median home by roughly $158 (7.1%) compared with a year ago. This increased the required household income to purchase the median-priced home by $6,400, to $119,700, after also accounting for the cost of tax and insurance.
While the percentage of homes with price reductions increased from 12.7% in May of last year to 16.6% this year, the overall share of inventory is lower than in 2018 (17.4%).
Regional and metro area price trends
In May, listing prices remained stable on a year-over-year basis in the South (+0.0%), where competitive home inventory has grown the most in recent months, but prices continued to increase in the Northeast (+6.1%), Midwest (4.4%), and West (+0.8%) compared with the same time last year.
On an adjusted per-square-foot basis, prices in all regions showed greater growth rates, by 3.3% to 6.6%, as soft median list price growth in the South was driven by a larger inventory of affordable, smaller homes. The median list price in Buffalo (+18.6%), Cleveland (+15.9%), and St. Louis (+10.9%) saw the biggest increases among the large metros.
Meanwhile, all of the 50 largest metropolitan areas have seen sizable price growth compared with homes listed before the pandemic. Compared with May 2019, the price-per-square-foot growth rate in the 50 largest metros ranged from 23.2% to 84.7%. In all 50 metro areas, home price growth kept up with the 22.7% increase in consumer price index inflation in the most recent five years, and in many markets, home price growth far outpaced inflation.
Across the country, sellers who bought before the pandemic stand to earn a decent profit if they were to list their home for sale today.
Sellers who do not plan to purchase another home or do not need to assume a new mortgage to buy another home, such as investors, second-home owners, or those with enough equity, are in an even better place to capitalize on the growth seen over the past several years without regard to today’s higher financing costs stemming from higher interest rates.
The markets where sellers would see the greatest increase in price per square foot as measured by listing prices included the New York City metro area (+84.7% vs. May 2019), Boston (+72.9%), and Nashville (+68.6%). Markets that saw the lowest return included Detroit (+23.2%), Baltimore (+24.8%), and San Jose (+26.3%).
The share of price reductions was up compared with last year in the South (+4.9 percentage points), West (+3.3 percentage points), Midwest (+2.2 percentage points), and Northeast (+1.2 percentage points). Forty-six of the 50 largest metros saw the share of price reductions increase compared with last May, up from 44 in April. Tampa saw the greatest increase (+10.9 percentage points), followed by Jacksonville (+10.2 percentage points) and Charlotte (+8.3 percentage points).
May 2024 Regional Statistics
| Region | Active Listing Count YoY | New Listing Count YoY | Median Listing Price YoY | Median Listing Price per SF YoY | Median Days on Market Y-Y (Days) | Price-Reduced Share Y-Y (Percentage Points) |
| Midwest | 20.5% | -0.1% | 4.4% | 4.4% | -3 | 2.2 pp |
| Northeast | 9.4% | -4.1% | 6.1% | 6.6% | -5 | 1.2 pp |
| South | 47.2% | 8.1% | 0.0% | 3.3% | 4 | 4.9 pp |
| West | 34.5% | 9.3% | 0.8% | 4.8% | -2 | 3.3 pp |
May 2024 Regional Statistics vs. Pre-Pandemic 2017–19
| Region | Active Listing Count vs Pre-Pandemic | New Listing Count vs Pre-Pandemic | Median Listing Price vs Pre-Pandemic (May 2019 Only) | Median Listing Price per SF vs Pre-Pandemic (May 2019 Only) | Median Days on Market vs Pre-Pandemic (Days) | Price-Reduced Share vs Pre-Pandemic (Percentage Points) |
| Midwest | -52.0% | -31.6% | 41.5% | 46.9% | -14 | -43.9 pp |
| Northeast | -60.0% | -39.4% | 54.1% | 65.1% | -16 | -5.2 pp |
| South | -22.1% | -15.0% | 35.5% | 53.6% | -9 | 2.4 pp |
| West | -21.2% | -29.3% | 39.2% | 48.3% | -3 | 1.0 pp |
May 2024 Housing Overview of the 50 Largest Metros
* Note: Some metrics for the Las Vegas, Phoenix, and Rochester metro areas are under review and unavailable.
Methodology
Realtor.com housing data as of May 2024. Listings include the active inventory of existing single-family homes and condos/townhomes/row homes/co-ops for the given level of geography on Realtor.com; new construction is excluded unless listed with an MLS that provides listing data to Realtor.com. Realtor.com data history goes back to July 2016. The 50 largest U.S. metropolitan areas as defined by the Office of Management and Budget (OMB-202003).
- Kristen Haynes

Most Popular Reply

- Rental Property Investor
- New Orleans, LA
- 551
- Votes |
- 710
- Posts
