Market Trends & Data
Market News & Data
General Info
Real Estate Strategies

Landlording & Rental Properties
Real Estate Professionals
Financial, Tax, & Legal


Real Estate Classifieds
Reviews & Feedback
Updated over 1 year ago on .

Comparing Q3 2022 vs. Q3 2023
Hey all,
Decided to address the Southern NH market as is. As always, leave me any comments or some review of the data. If you want to see any location be it zip code, county, cities or timelines, then let me know.
Summary:
As I said, I am back in action after being away! I wanted to take this morning to send some updates on what I think is going on in the market for all types of buyers be it seasoned investors or FHA buyers. Currently, there are 46 multi-family properties that are on the market in Hillsborough county and we are seeing higher DOM with many properties sitting. This can be a result of higher interest rates and higher sales prices. We know that rates were paused previously, but the Feds announced they will raise the rates by the end of the year. This will be the last push of inventory until the slow winter season. All this said, I have some data to share with you.
Data comparing 2022 Q3 and 2023 Q3 (year by comparison)

In terms of DOM, we are seeing properties sitting longer by the coast in Rockingham and Strafford, as well as Merrimack county. Hillsborough continues to be competitive. Belknap county has much lower DOM (this is a skew because there is much less inventory).
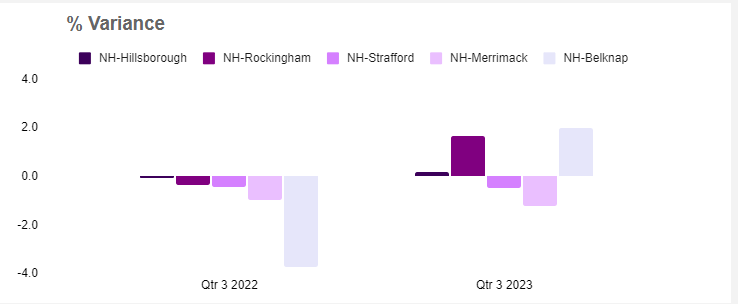
This is one of my favorite charts because it tells us the sales price vs. closed price competitveness. Rockingham continues to be competitive, as well as Belknap. That said, Q4 will be interesting to see these values as many multi-families have been priced higher with rising interest rates, so it will be interesting to see what closes at certain values.


Another set of interesting data. Comparing Q3 of both 2022 vs. 2023 - we are seeing slight increases in pricing per unit, which is to be expected to an extent. The difference across the board for Hillsborough county (most number of multis in the state) has increased roughly 30K per unit across 2-4 units. 2 families now cost an average of 500K, 3 families cost 550K, and 4 families cost roughly 630K. Now, this may be skewed a bit since I know numerous off market deals where 3 families (big ones) were selling for 600K and 4 families were selling around 700-800K. This data is not supported by the MLS since they were off markets, but it's important to know that is happening.
Additionally, Rockingham continues to show an increase and the other counties show a very small increase of 5-10K per unit.

Here we are seeing a general increase (for the most part) of cost per square foot of buildings. Rockingham saw a dip, but again, an inventory problem.


I keep mentioning inventory, well, here it is. Strafford county actually did quite well this year in terms of cash flowing through in September, but the number of units was down by quite a bit. You can see the inventory of 2022 vs. 2023 is down quite a bit. We’ve seen this same trend year after year. It will continue to happen with new owners holding on to their sub 4% interest rates, or so I think!

Some of you may have noticed these recent sales. This is one sale of each property as one sale. The entire portfolio sold for 5.7 million at a listing price of 6.12 million. Just wanted to bring attention to this sale.
- Andrew Bosco
- [email protected]
- (603) 833-0951
