Market Trends & Data
Market News & Data
General Info
Real Estate Strategies

Landlording & Rental Properties
Real Estate Professionals
Financial, Tax, & Legal


Real Estate Classifieds
Reviews & Feedback
Updated almost 2 years ago on . Most recent reply
New Hampshire Multi-Family Data at a glance. 2022 vs. 2023 (so-far)
The day has come - my data is ready to be shared! I've been working on this data for the better of three weeks by pulling NH Prime MLS to create these visuals. I'll share some snippets of data that I find useful. Here's a quick blurb:

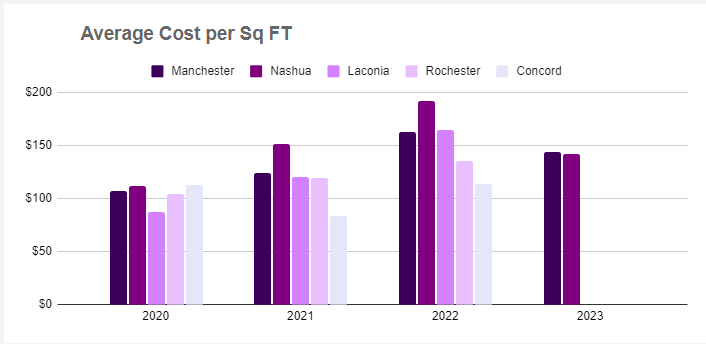
Figure 1: This is showing the Avg cost per square foot of each sale. You can see in 2023 there is no data for Laconia/Rochester/Concord because 0 Multis have sold. You can see that Manchester, Nashua and Rochester and Laconia continue to show a strong increase in cost per square foot. For reference, new build costs between $225-$250 per square foot.


Figures 2-4: These are unique. These charts show the difference in cost per unit by 3, 4 and 5+ units on the right and inventory on the left. I like this because it tells us what the average cost per unit is being sold for by each unit. 3 units are notoriously high. You'll notice the dip in 2023 - that's because of the lack of inventory. I expect this to increase as the year goes on. Manchester and Nashua continue to be strong markets. Rochester and Laconia are showing promise as well with the lower buy entry for many investors compared to other markets.

Figure 5: This is the last of data for the day. I find this to be insightful. On the left are AVG days on market and on the right is the % variance (Cost price vs. list price). A positive variance tells me that overbidding occurred and the area is desirable. Same with vice versa and/or overpriced corrections. This is showing us that Laconia is desirable and Manchester continues to be desirable. Laconia only had 5 multis sell so the variance could be high comparatively to other markets.
IF you like this data, then PLEASE tell me. I will continue these posts. This is a powerful template/tool with tons of insight. I am playing with metrics still and may share publicly for all my clients. If you'd like to see any specific metrics, then let me know. Let me know what works.
best,
Andrew
- Andrew Bosco
- [email protected]
- (603) 833-0951
