


Full STR analysis in Okaloosa Island, Florida, WITHOUT using AirDNA.
Hi guys,
I wanted to share with you a complete STR analysis of Okaloosa Island, Florida. Curious to hear your honest feedback.
This is a snippet from an article written by Onera Group.
Short-Term Rental Analysis in Okaloosa Island, FloridaThe base of our short-term rental analysis is outlined below:
- First, we will identify areas in Okaloosa Island that consistently experience high demand for short-term rentals year-round.
- Next, we will narrow our analysis down to a specific subarea, considering factors like occupancy rates, average stay, daily rates, and annual bookings, among others.
- Then, we will identify the precise characteristics of top-performing listings in this subarea, including property type, number of bedrooms, bathrooms, key amenities that drive demand, among others.
- Next, we will reveal how top-performing hosts in this area adjust their daily rates throughout the year, capitalizing on the seasonal trends in the short-term rental market.
- Finally, we will conduct a financial case study to determine the expected net annual return of a listing available in the for-sale market within that specific area in Okaloosa Island.
Analyzing High-Demand Locations for Short-Term Rentals in Okaloosa Island, Florida
The first stage of our analysis involves finding areas with high demand for vacation rentals on Okaloosa island.
This community is situated on Santa Rosa island, a 40-mile barrier island that accommodates two other communities: Navarre Beach and Pensacola Beach.
We will focus our analysis on Okaloosa island, although we will provide in this section some brief insights for the other two communities on this island.
To identify demand hotspots for vacation rentals, we will use a two-step process:
- First, we will plot on a map all of the Airbnb listings on the island.
- Then, we will remove listings from this map that have received fewer than 30 reviews in the previous 12 months.
Thirty reviews—why?
This number is a parameter in the model. The higher this number, the fewer hotspots will appear on the map.
As an example, if you were to increase it up to 60 reviews in the past 12 months, then you would be left on the map with a small number of listings, all of them with a high number of bookings throughout the year.
This number is a parameter in the model that users can adjust at any time. By increasing it, you can narrow your search down to just a few areas that have the highest demand for vacation rentals.
Going back to our short-term rental market analysis, you can see below three heatmaps for the three communities on Santa Rosa Island, each reflecting the density of Airbnbs with more than 30 reviews in the past 12 months.
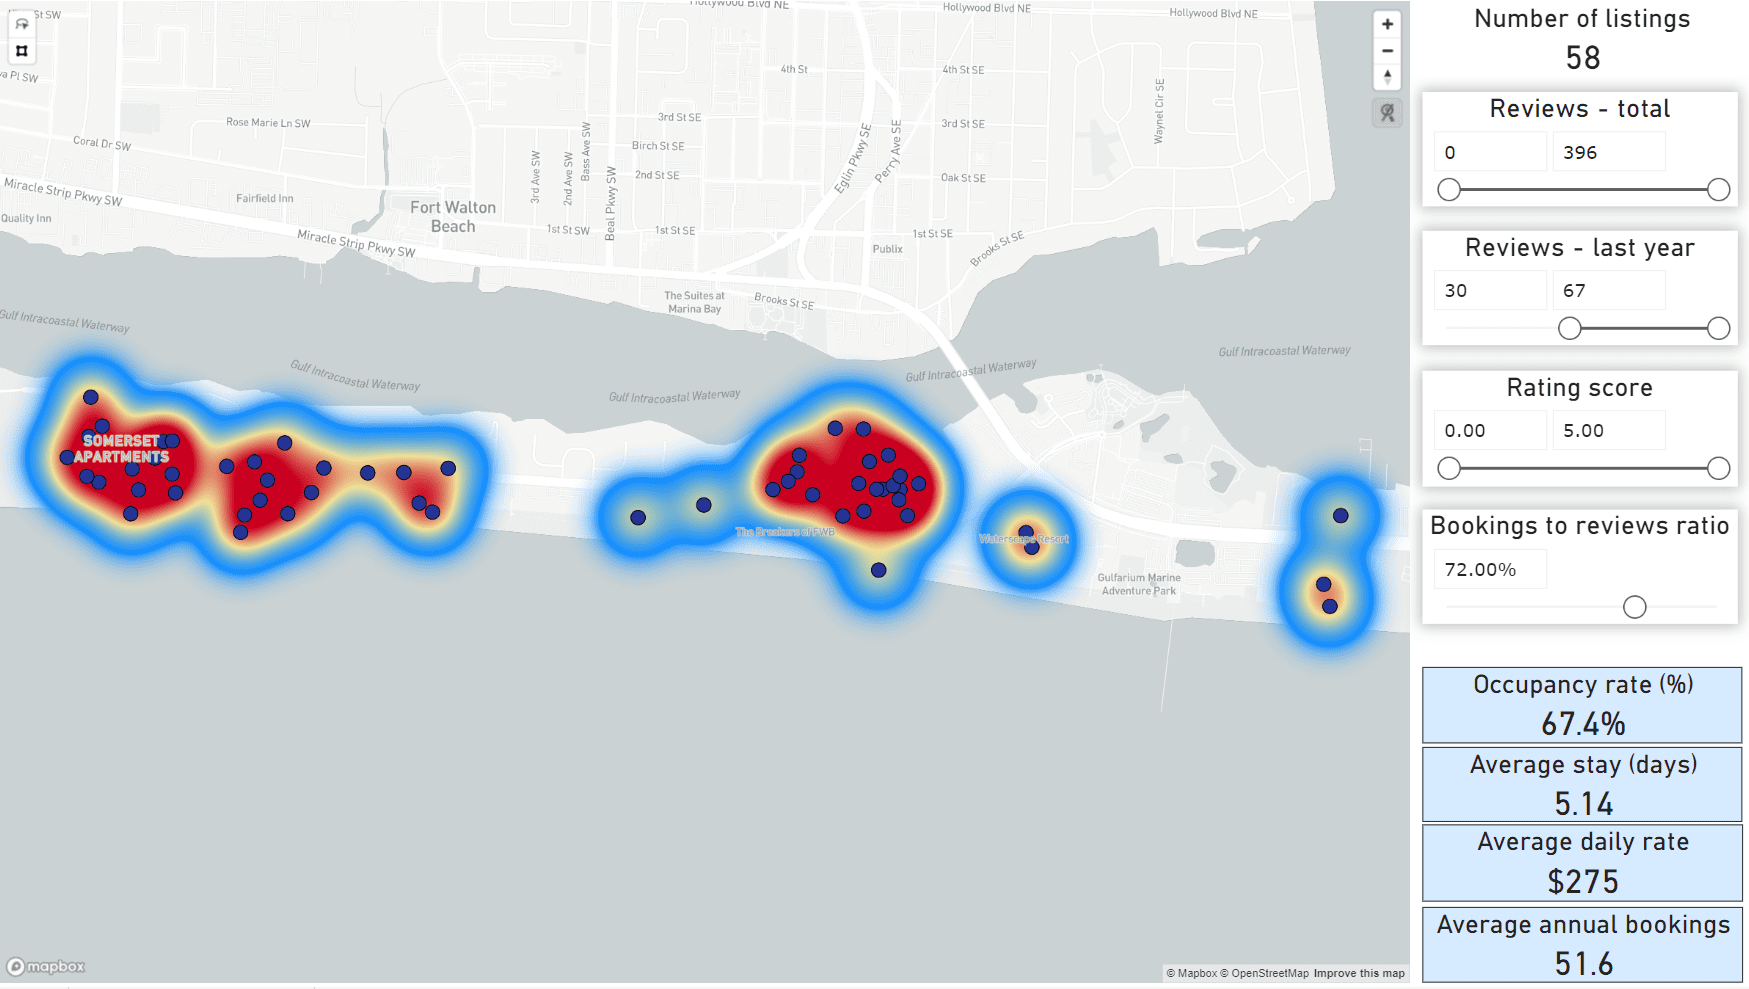
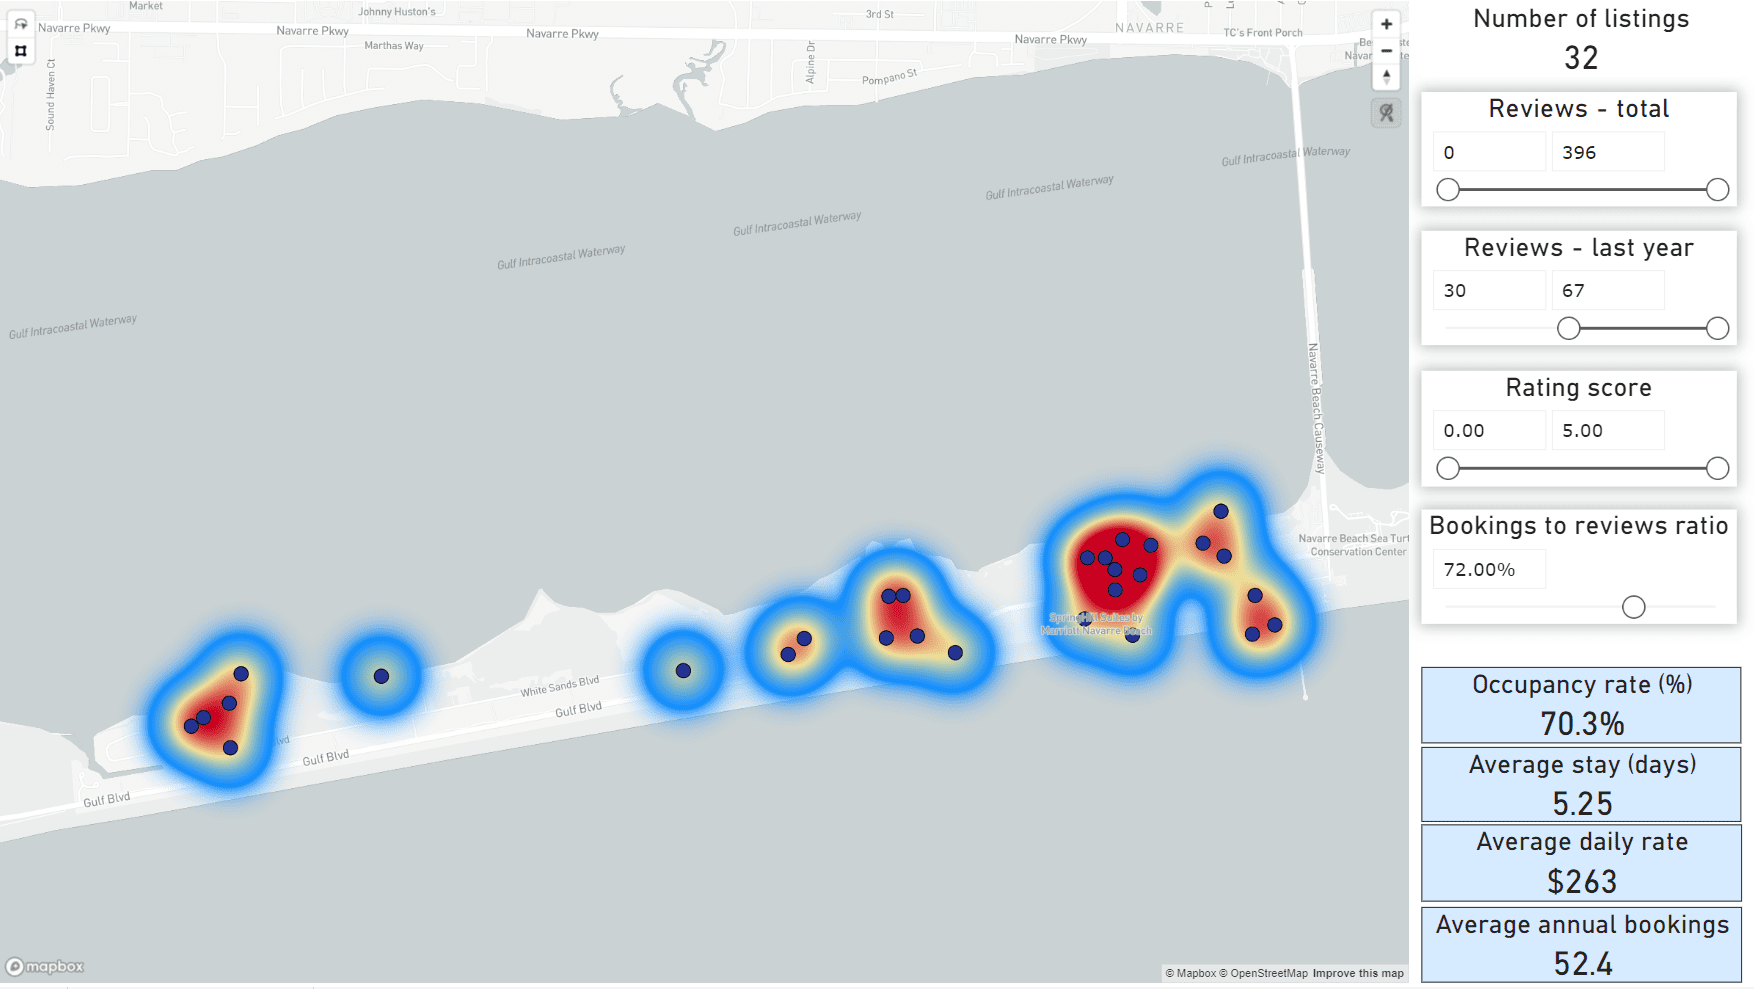
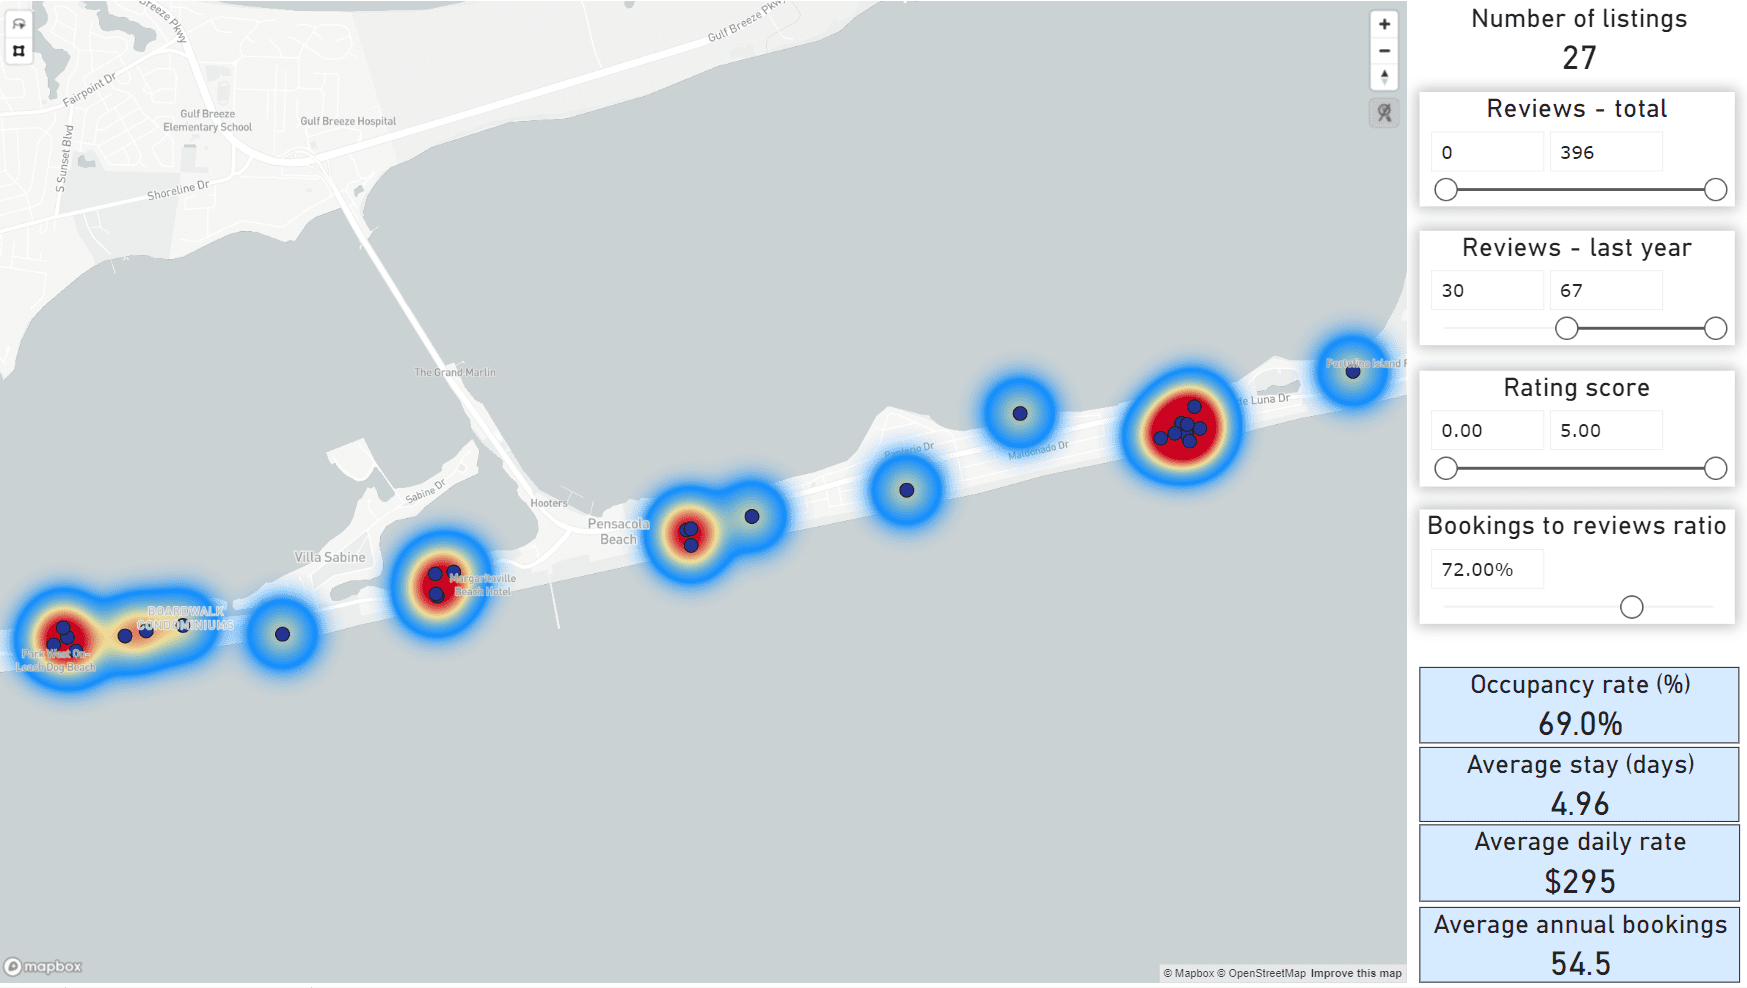
Some important obsverations:
- Navarre Beach has the highest occupancy rate, 70.3%.
- Okaloosa Island has the highest number of listings with +30 reviews in the past 12 months.
- Pensacola Beach has the highest average daily rate, $295 on average throughout the year.
- The average stay is about 5 days per booking in all three communities.
As mentioned in the introduction, we are going to narrow our analysis to Okaloosa Island.
By looking at the demand hotspots in Okaloosa Island, one can identify two demand hotspots, west of Highway 98, represented below:
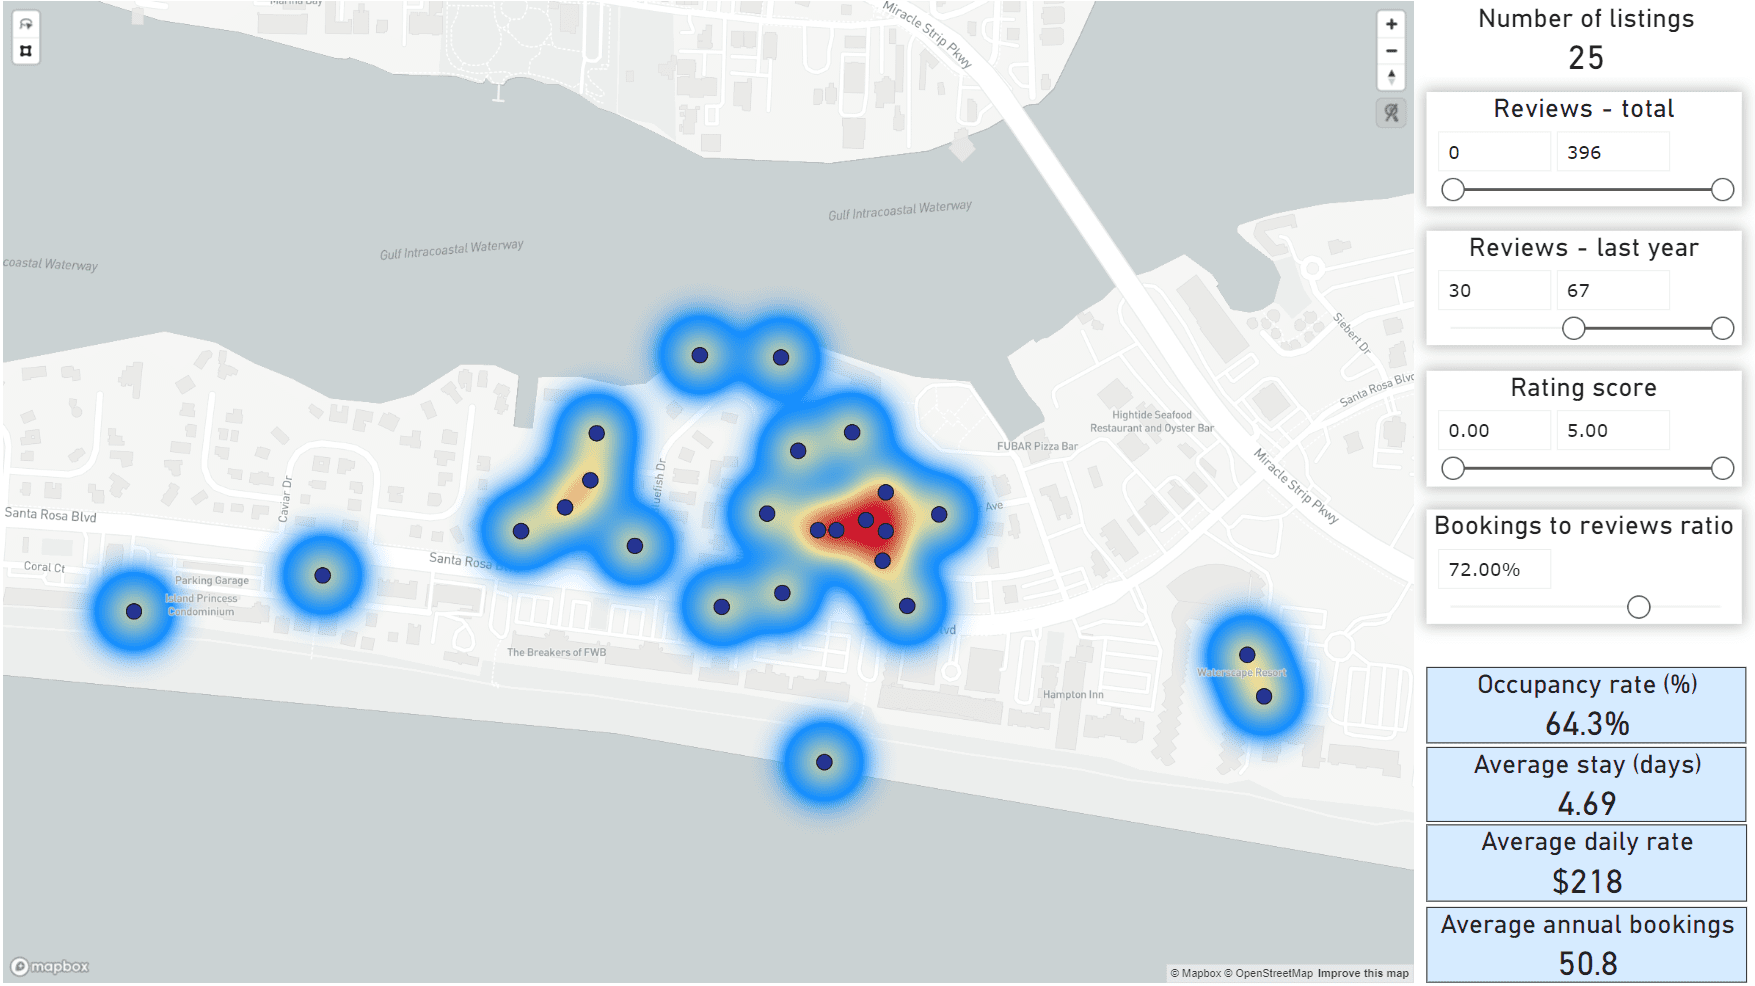
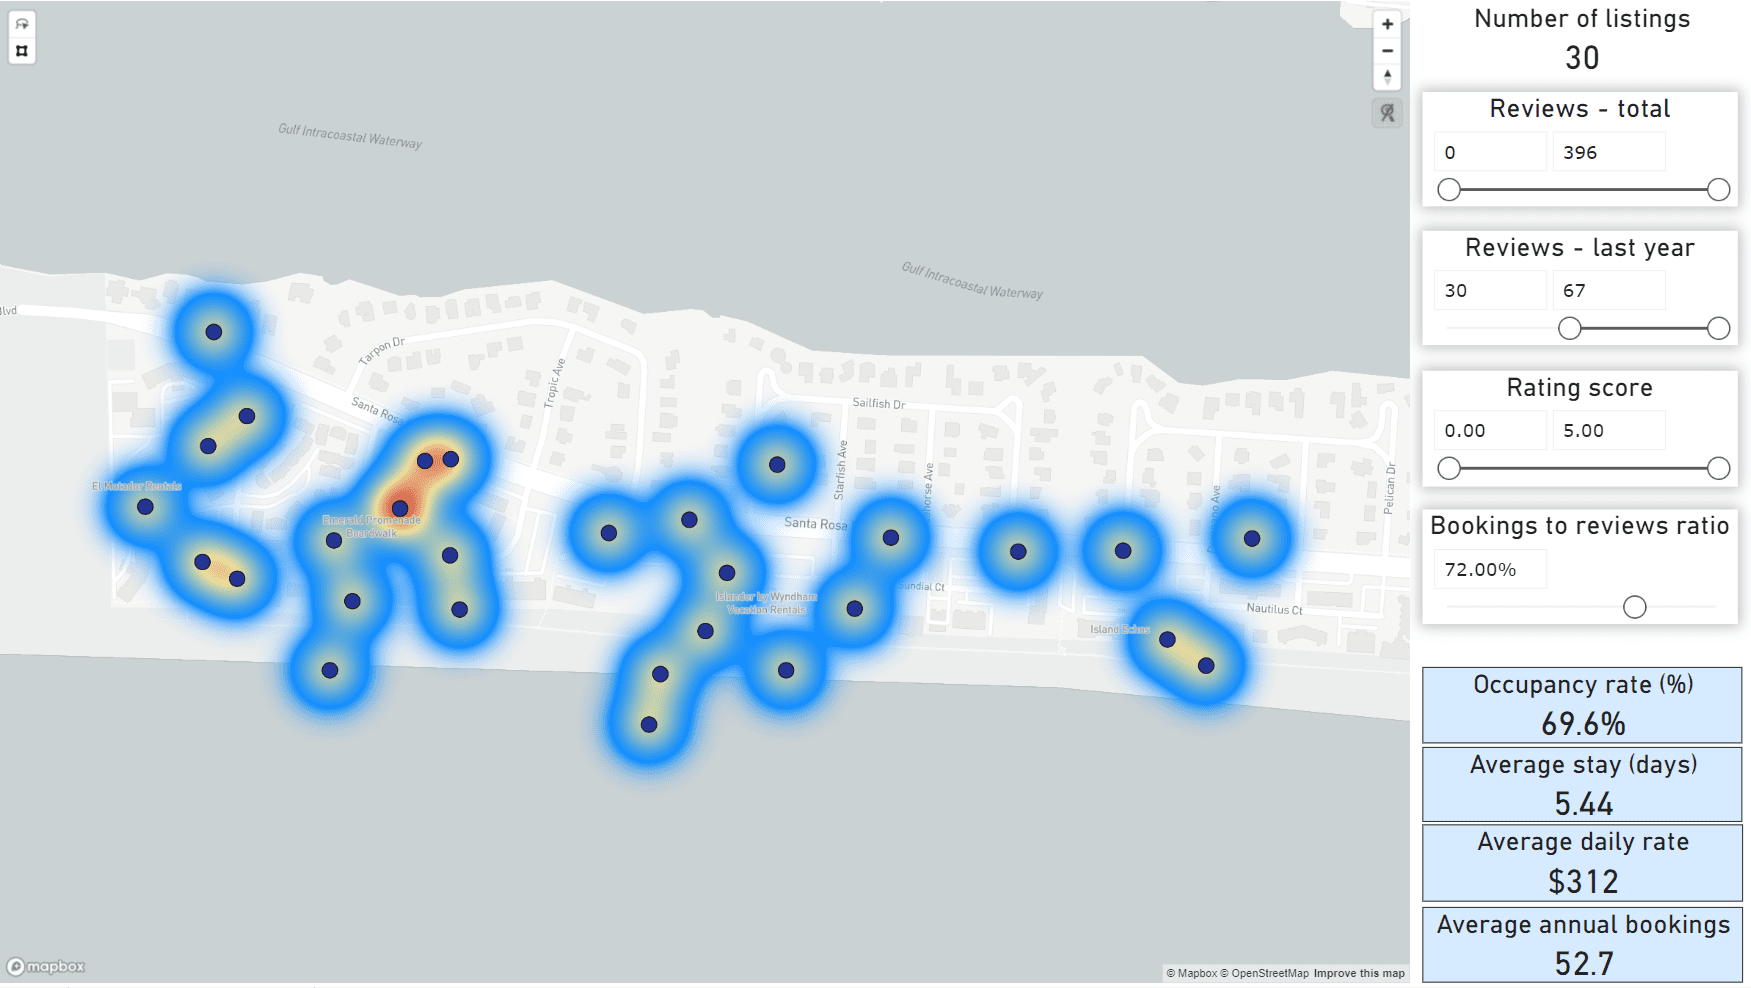
Some observations:
- The area around Breaker West Condominiums exhibits the lowest occupancy rate, average daily rate, and average stay.
- The area southwest of Santa Rosa Blvd. features a higher number of Airbnb listings (with +30 reviews in the past 12 months), spread across a larger area.
As a result, we will narrow down our analysis in the following sections to the area southwest of Santa Rosa Blvd.,
given its higher occupancy rate, average stay, daily rates, and annual bookings.
Identifying the Characteristics of Top-Performing Short-Term Rental Listings in Okaloosa Island, Florida
In this section, we will examine the types of properties situated in the southwestern area of Santa Rosa Blvd. that received over 30 reviews in the last year.
To do so we will utilize the market overview page of the report displayed below:
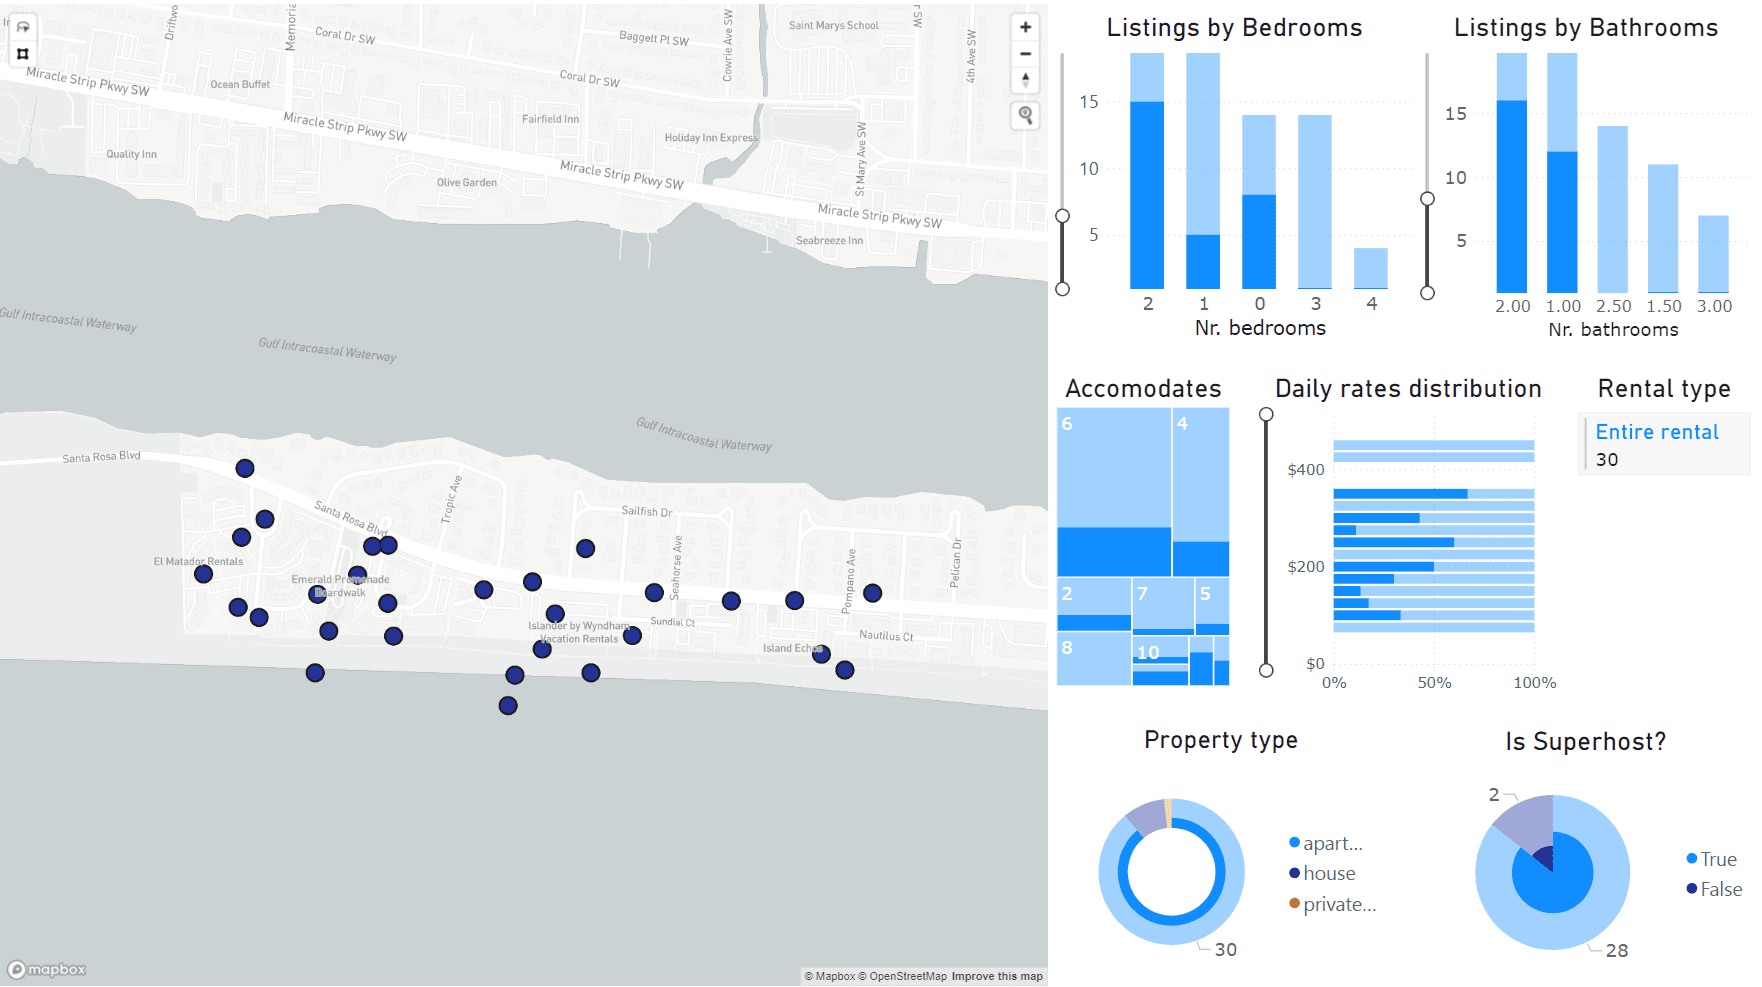
By reviewing the top two charts, it is evident that the most frequent listings with over 30 reviews in the previous year are units with 2 bedrooms and 2 bathrooms.
Below, you will find some insights:
- 15 out of 30 properties have 2 bedrooms.
- 13 out of the 30 listings are 1 bedroom units or studios.
- 14 out of 30 listings can accomodate 6 guests.
- All 30 listings are apartments / condominiums.
- All 30 listings are rented out entirely (no private rooms).
- 28 out of 30 listings are managed by a host with the super host badge.
Now, let’s uncover additional details about the top-performing Airbnb listings in this particular subarea of Okaloosa Island.
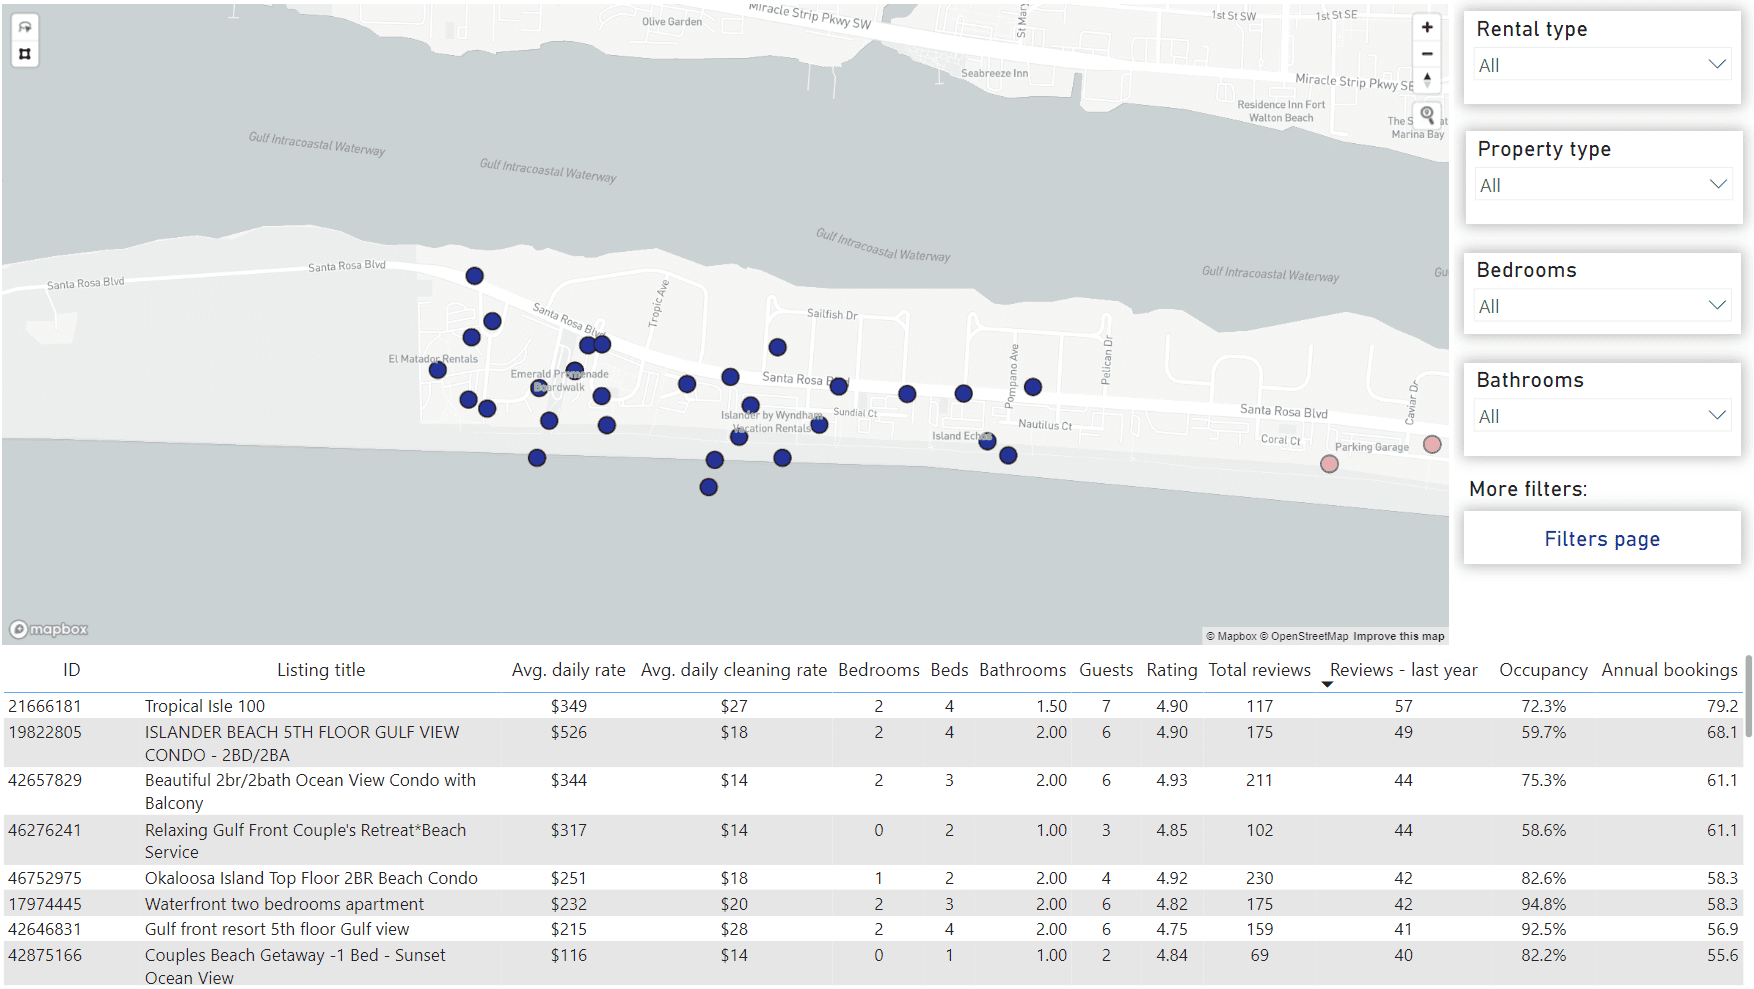
The chart above shows a table containing the top performing listings in Okaloosa Island in the past 12 months.
The table has been sorted by the number of reviews in the past 12 months, in descending order.
Here are some observations:
- The leading 8 listings have accumulated between 40 and 57 reviews in the past year.
- 5 out of 8 listings feature 2 bedrooms and 2 bathrooms.
- 2 out of 8 listings are studios, with the top-performing studio amassing 44 reviews in the past 12 months.
- The average daily rate spans from $116 up to $526.
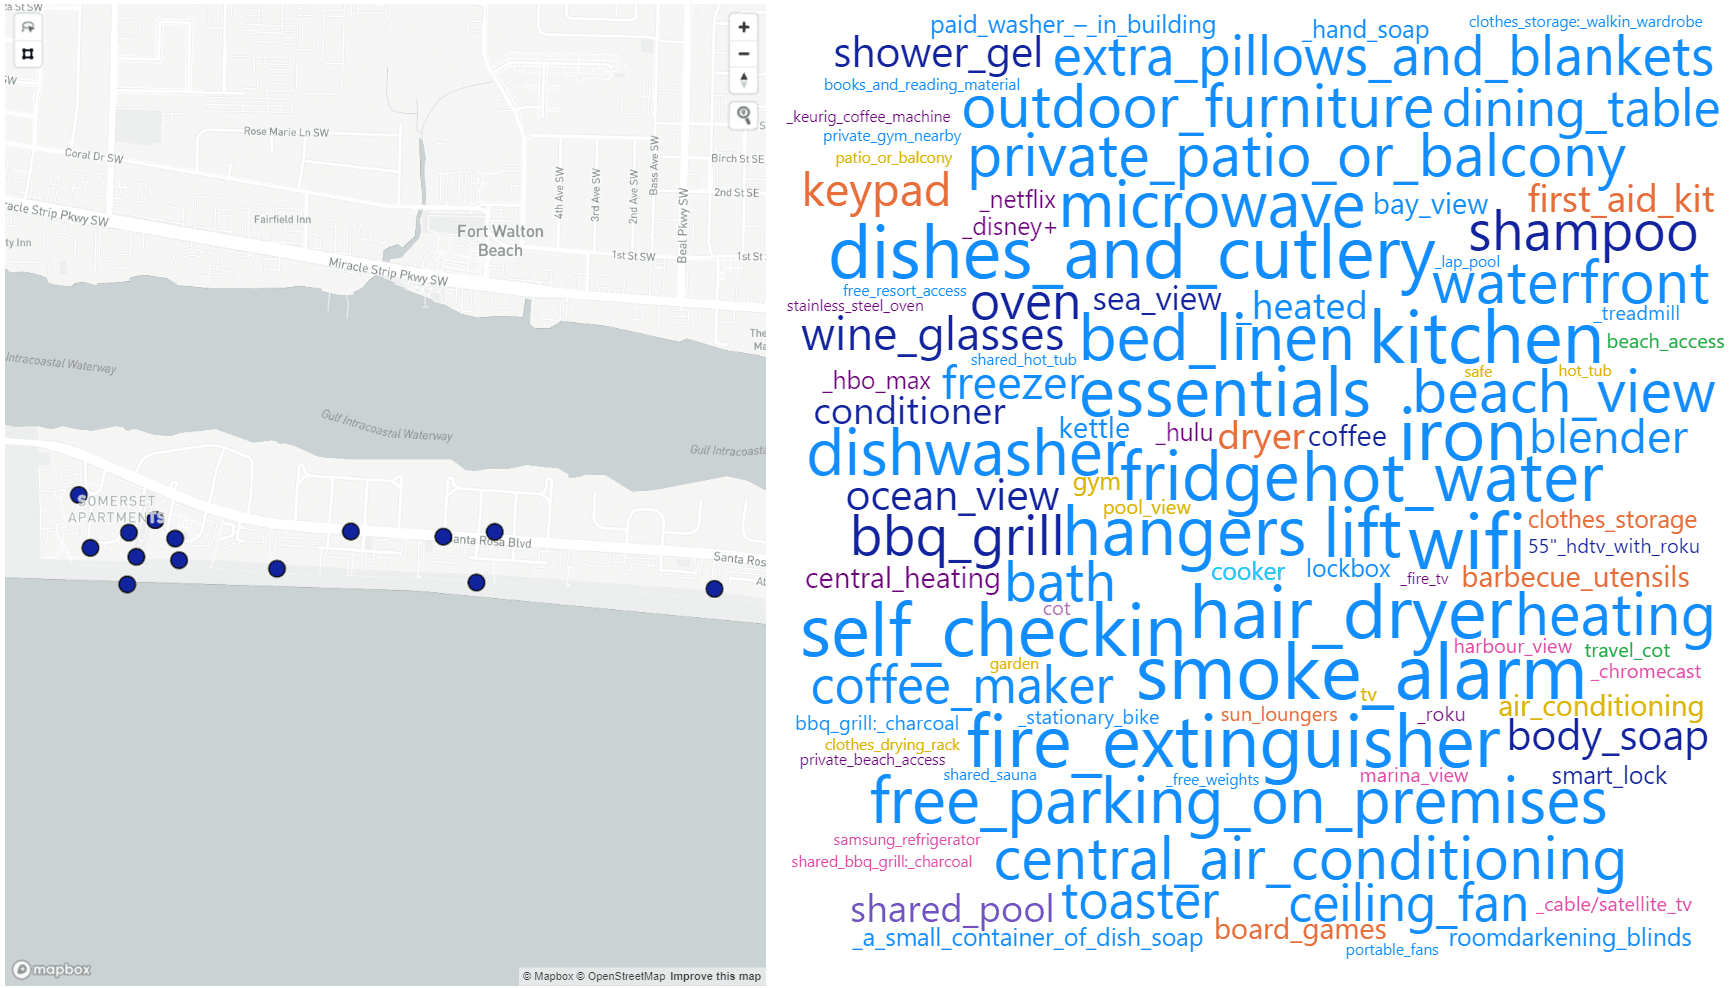
Next, let’s examine the most prevalent amenities among the 30 listings in this vicinity.
The chart below illustrates the top 100 most common amenities in this neighborhood. Larger font sizes indicate higher prevalence of an amenity.
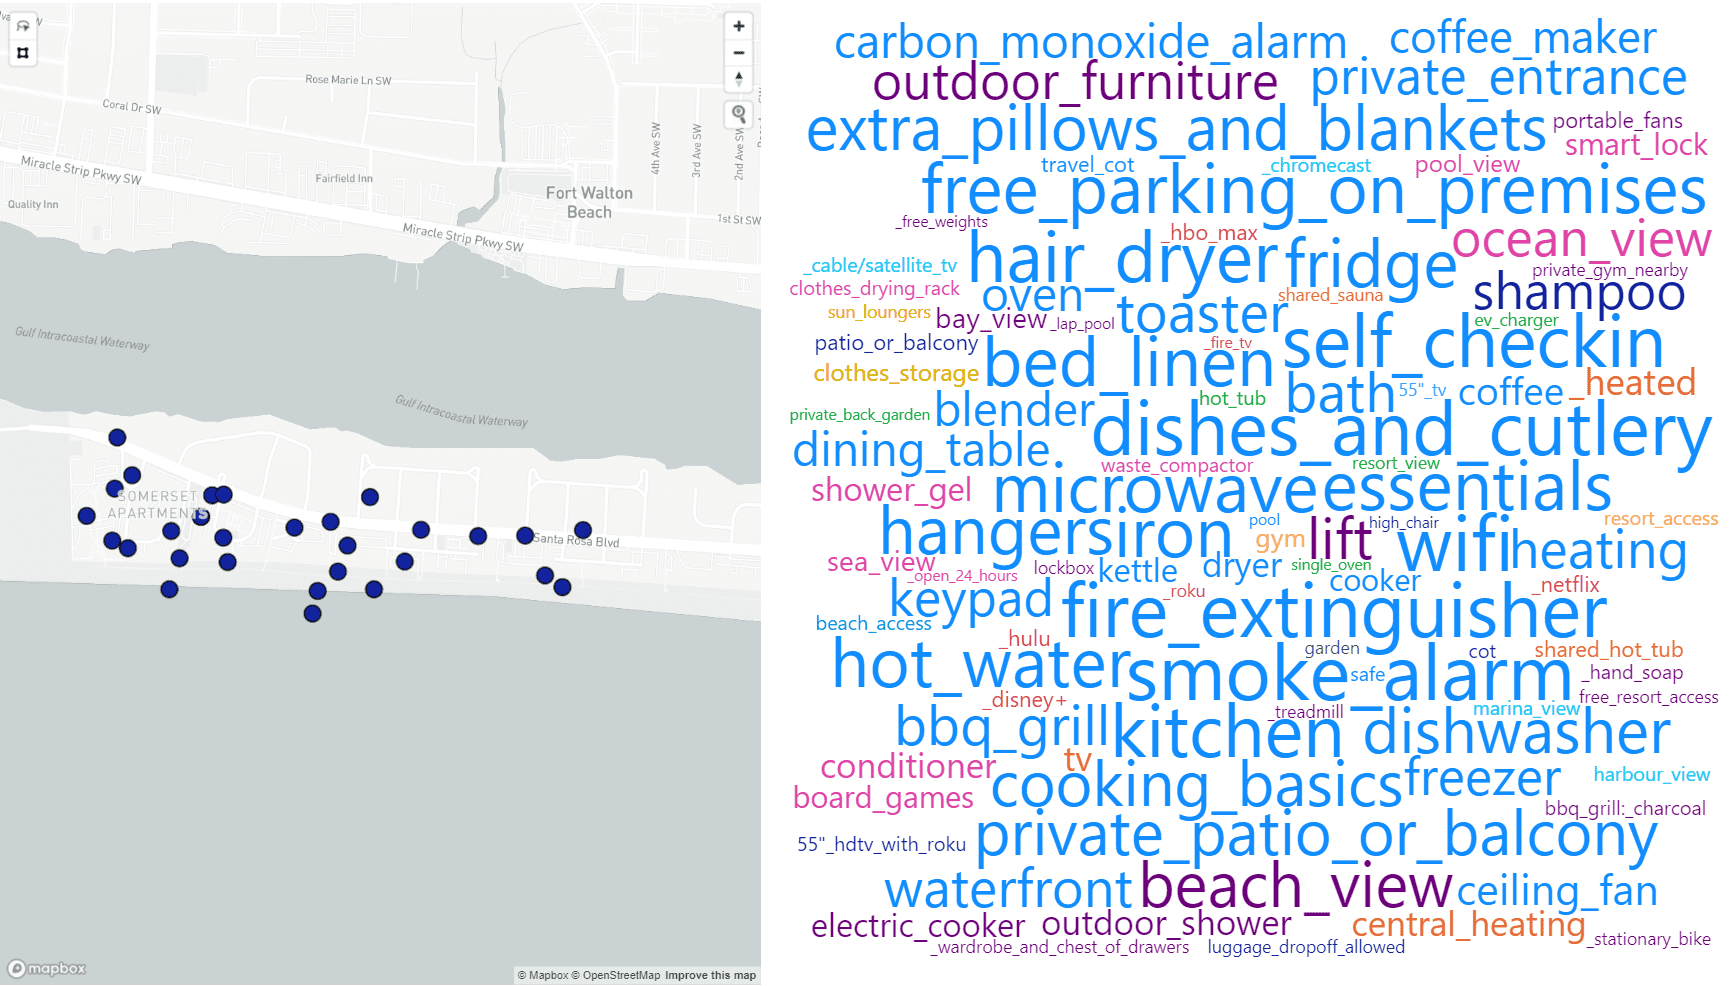
Below, we have filtered the map to display only listings with 2 bedrooms and 2 bathrooms.
As a result, the chart presents the top 100 most common amenities for this specific type of property.
Seasonality of Short-Term Rentals in Okaloosa Island, Florida
Now that we have narrowed down the property search to 2 bedrooms / 2 bathrooms units with a specific set of amenities, it is time to explore the seasonality of vacation rentals.
The chart below illustrates the total number of reviews across all listings in Santa Rosa Island, grouped by the month when the review was made.
Each bar in the chart represents the cumulative number of reviews across all Airbnb listings in Santa Rosa Island for that particular month.

Here are some observations:
- The high season typically starts in March and extends through October.
- While July is generally considered the peak season, in 2022, May emerged as the peak month.
- The low season spans from the end of October to the end of February of the following year.
- January and February experience the lowest demand, with bookings dropping by approximately 80% compared to peak months.
Determining the Optimum Rates for Short-Term Rentals in Okaloosa Island, Florida
The next phase of our analysis involves examining the pricing strategy throughout the year for the top-performing listings in this area. To achieve this, we have applied the following filter criteria:
- Only properties with 2 bedrooms and 2 bathrooms have been considered for this analysis.
- We are only considering listings with over 30 reviews in the past 12 months.
The findings are presented in the chart below:

Here are some observations:
- The average daily rate for a 2-bedroom / 2-bathroom unit throughout the year stands at $308.
- Rates tend to be higher during the months of May, June, and July.
- Conversely, the lowest average daily rates occur in December, January, and February.
- It is important to note that the increase in the average daily rate during January is not attributable to increased demand, as indicated in the seasonality section. Instead, this rise is influenced by certain listings being unavailable during this period, along with higher prices set by some high-end listings to offset lower demand.
Now, let’s examine the variation in cleaning fees per day of booking across the year, applying the same filters as in the previous case.
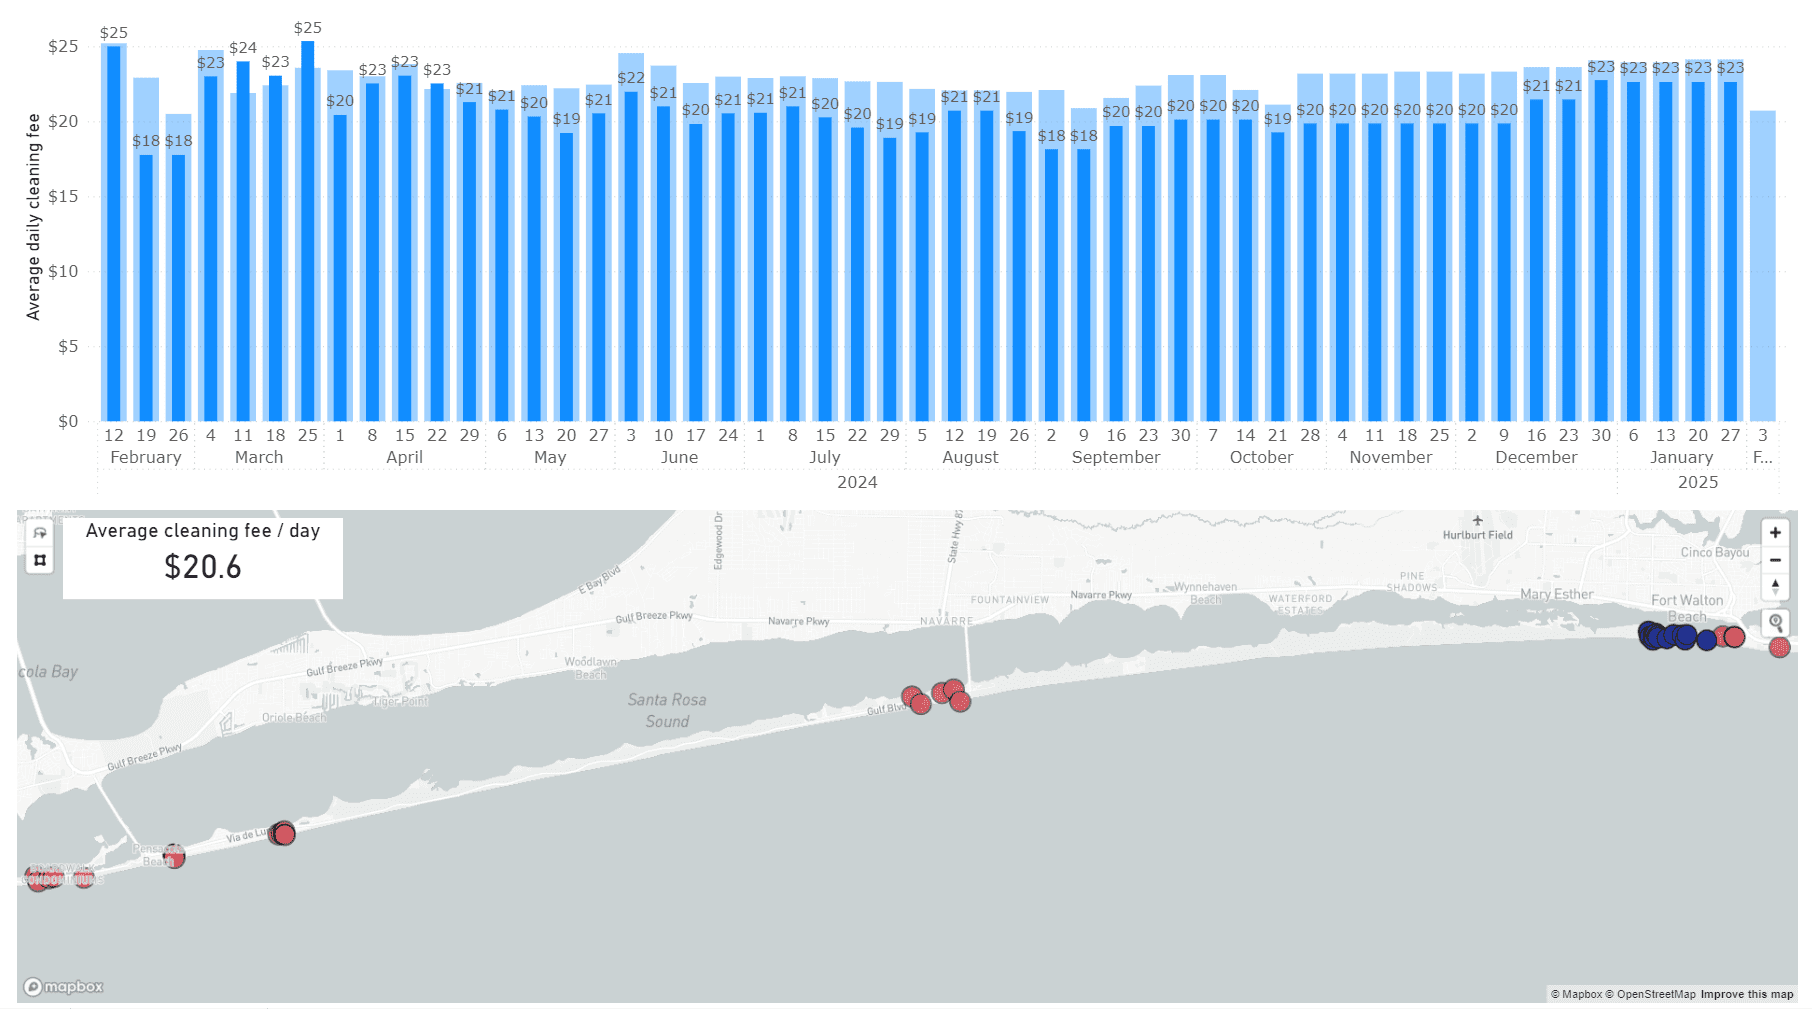
Here are some observations:
- In contrast to the average daily rate, the cleaning fee per day of booking remains consistent throughout the year.
- The average value for our subarea in Okaloosa Island (represented by blue dots on the map) stands at $20.6 per day of booking.
Financial Case Study: Analyzing the Performance of a Short-Term Rental in Okaloosa Island, Florida
In this section of our analysis, we are going to conduct a financial case study to understand the expected performance of a 2-bedroom / 2-bathroom unit in the southwestern area of Santa Rosa Blvd., in Okaloosa Island.
Here is a summary of our findings from the previous sections:
- There are two demand hotspots for short-term rentals in Okaloosa Island, with the one located at the southwest of Santa Rosa Blvd exhibiting a higher occupancy rate (69.6%) and a higher average daily rate ($306).
- The top-performing listings in this area typically feature 2 bedrooms and 2 bathrooms, with 5 out of 8 listings having these exact characteristics.
- We have analyzed a chart containing the top 100 most common amenities for top-performing listings with 2 bedrooms and 2 bathrooms.
- The high season extends from March to the end of November, with May and July being the peak months.
- The average daily rate for a 2-bedroom / 2-bathroom unit in this area throughout the year is $306, with an average daily cleaning fee of $20.
Now, assuming we have located in the for-sale market a 2-bedroom / 2-bathroom unit meeting all our criteria, our objective is to run a financial case study to estimate cash-on-cash returns and other relevant parameters.
The chart below presents all the inputs for our financial case study:
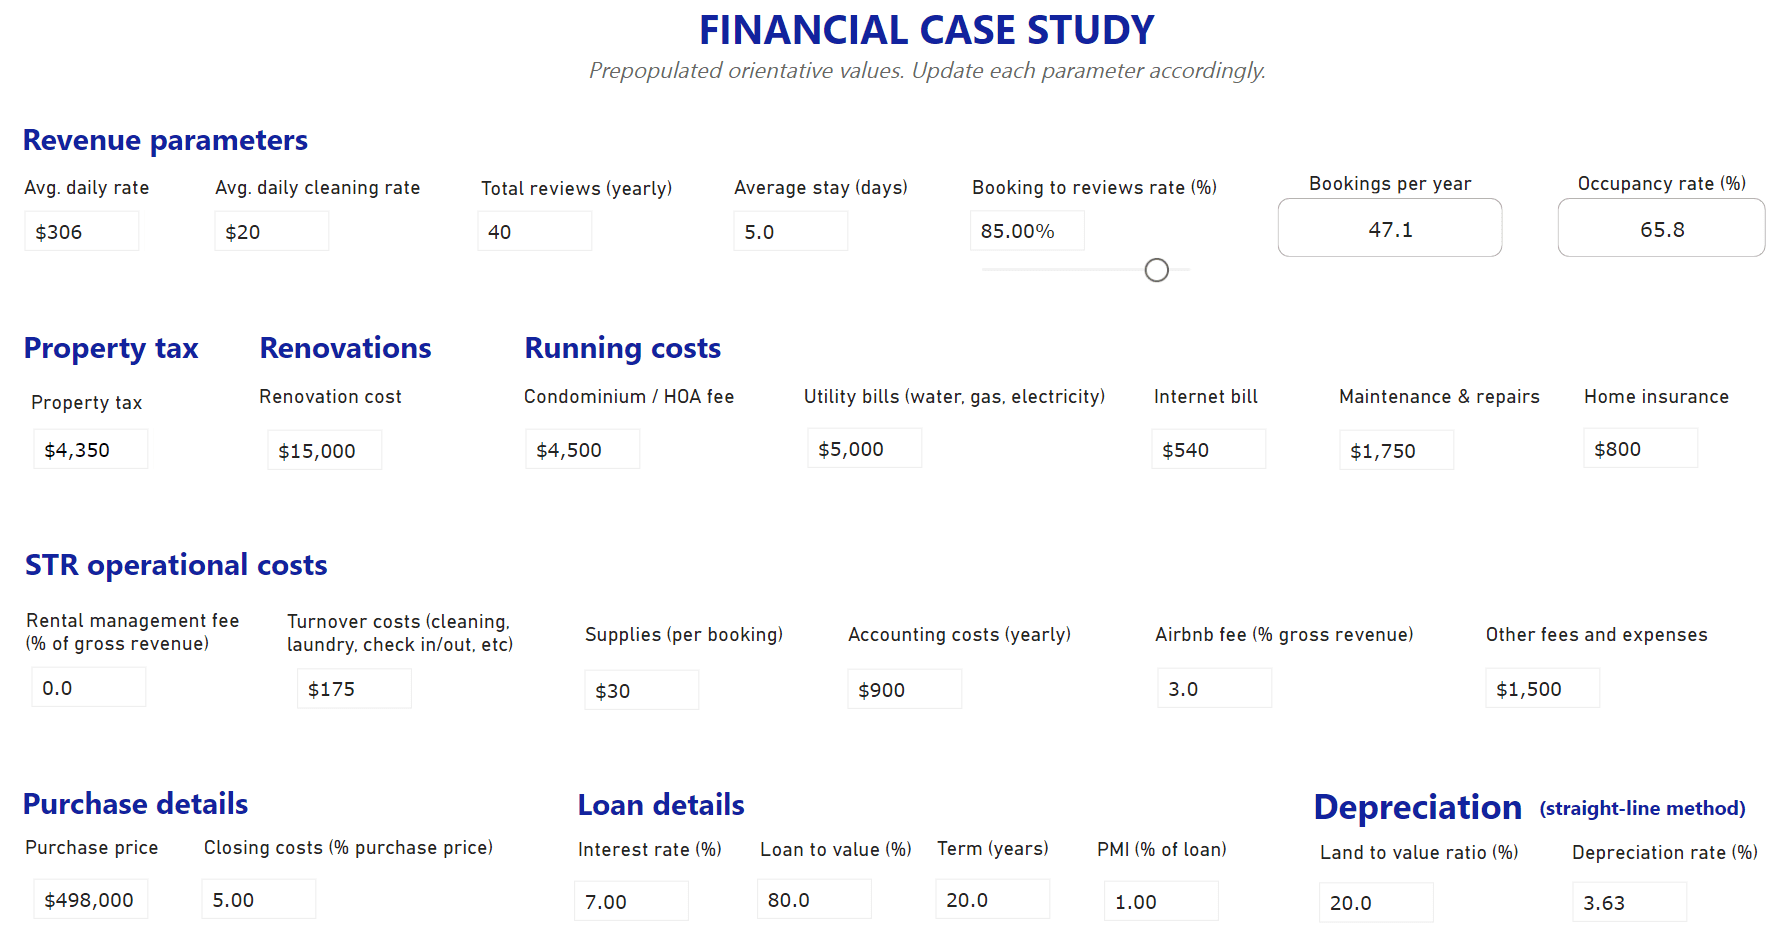
Some observations:
- We anticipate receiving 40 reviews within a 12-month period, which is a conservative estimate based on our previous analysis.
- The bookings to review rate has been established at 85%. For further details on this parameter, please consult our user guide.
- We have allocated a budget of $15,000 for renovations / refurbishments.
- The purchase price of a 2-bedroom / 2-bathroom unit in this area is $498,000, with 5% of this price allocated for closing costs.
- A turnover cost of $175 per booking has been factored in, with no rental management fee assumed, indicating that you will manage bookings and cleaning services independently.
- The mortgage rate is set at a fixed 7% per year, with an 80% loan-to-value ratio (LTV) and a 20-year term.
- For the remaining parameters in our financial model, please refer to the image above.
Taking these values into account, below are the results of the financial case study.
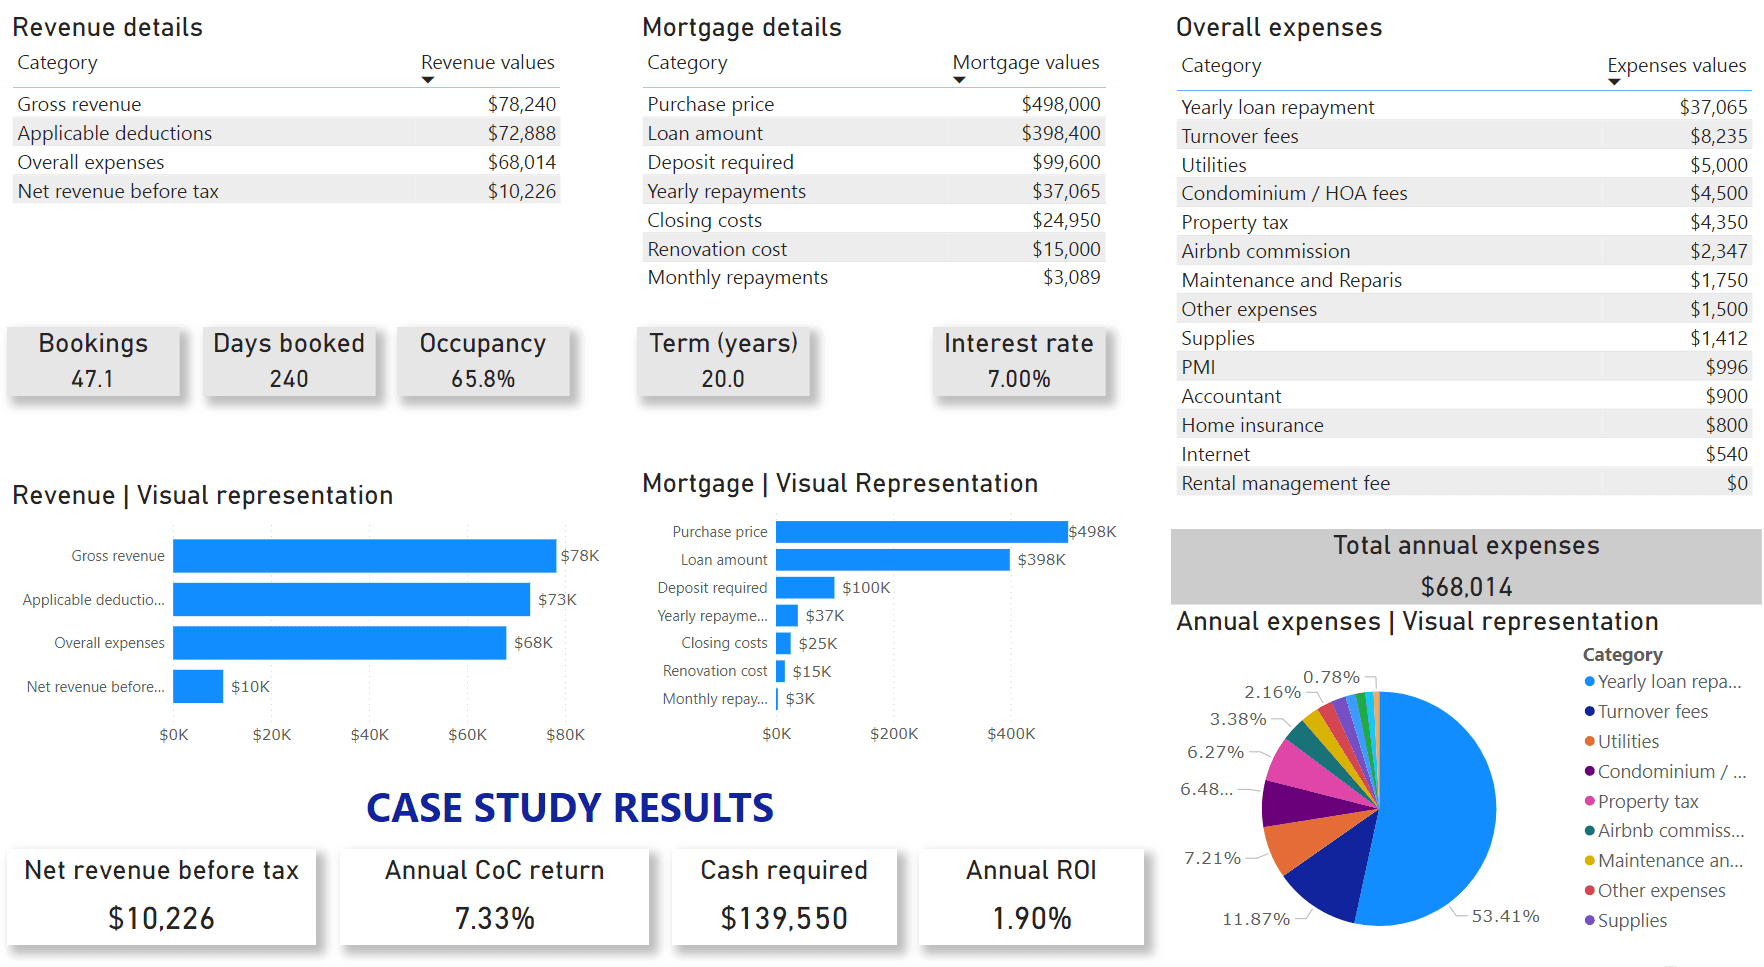
Some insights:
- The results show the anticipated performance of a 2-bedroom / 2-bathroom unit in the southwestern area of Okaloosa Island, Florida.
- Expected gross revenue amounts to $78,240, derived from 47 bookings with an average stay of 5 days at an average daily rate of $325 (inclusive of cleaning fees).
- Total yearly expenses add up to $68,014, encompassing various costs from private mortgage insurance (PMI) to property taxes and annual loan repayments.
- The cash required for this deal totals $139,550, incorporating the 20% down payment for the mortgage, 5% closing costs, and the $15,000 renovations budget.
- Pre-tax net revenue stands at $10,226, representing a 7.33% cash-on-cash (CoC) return.
- The annual return on investment (ROI) is 1.9%, excluding value appreciation. This ROI is calculated as the net return from short-term rentals divided by the sum of purchase price, closing costs, and renovation costs.
- The largest yearly expense is attributed to mortgage repayments (53.4%), followed by turnover fees (11.8%) and utilities (7.21%).
Below, you will find a chart showing how the seasonality of vacation rentals impacts gross revenue throughout the year:

This chart provides insights into the relative strength of each season. For example, the revenue expected during the low season is five times less than during the peak season.
In summary, this methodology offers a comprehensive approach to analyzing the short-term rental market within specific subareas of interest.
By localizing demand hotspots, identifying outstanding property types, uncovering key amenities, pricing strategies, and conducting a financial case study, we gain valuable insights into expected returns for properties available in the for-sale market.
Ideally, investors would conduct a similar analysis for every demand hotspot within their city of interest, evaluating both the short-term rental and for-sale markets before assessing expected returns.
Legal disclaimer:
The information provided in this article is for informational purposes only and should not be construed as financial, investment, or legal advice; individuals should consult with a qualified professional before making any investment decisions.
Did you find any value in this article?
Most Popular Reply

- Olympia, WA
- 7,498
- Votes |
- 8,598
- Posts
- Olympia, WA
Look like a lot of info. A lot of it is AI generated. That is not necessarily a bad thing but it reads like a ChapGPT analysis.
Some things I don't care for is removing listings with less than 30 reviews. That could cut out some new up and coming properties that should be considered when it comes to amenities. Only properties with 2/2 considered? I assume that all this can be adjusted.
Is it only pulling from AirBNB?