Updated about 3 years ago on . Most recent reply
Article: A thought experiment - Real Estate vs S&P500
AND imagine the real estate is NOT cash flow positive. Consider the ‘negative cash flow’ as simply additional reinvestment…just like the S&P.
I am all about building cash flow over time through real estate. However, I’m early early early on in my journey.
I am wrapping up construction on my ‘house-hack’ 3 bed / 3 bath single family home in Minnesota. Once it’s done, I’ll bring on two roommates, and effectively cut my living expenses by $1,500–2,000.
I’m just beginning in the journey and contemplating the two main paths I see before me (on this and the next deal).
I can go after a ‘pure’ tried-and-true-investment-20%down-property. One that cash flows right out of the box with minimal capital expenditure or reinvestment. Or, I can go for another rehab, to capitalize on forced appreciation and net worth impact.
As I consider the options before me, I create thought experiments. I’d like to include you in one today.
The problem with Forced Appreciation (Net Worth Impact) Properties:
Debt costs become too high for excellent cash flow.
Unless you find a gem that really doesn’t need much but looks like it does. If you undertake a total renovation, or “flip”, you’ll have pretty significant reconstruction costs. If you can get a cosmetic fixer-upper, the options open up on the cash flow side.
Construction costs on my current (and first) property have run over $130k. I bought it at $250k in a neighborhood that can support $600k+ property values. Houses that are just blocks from me go for 3/4 of a million dollars. My equity impact will be fine. But the cashflow return may not be.
Cashflow Assumptions
If I tried to rent the house as an entire unit, I could probably get $2,500–2,750. Let’s assume all utilities/trash/etc. are paid by the tenant. This means I don’t have additional cash expense outside of fixed debt payments. We’ll use $2,500 as a conservative estimate for the purposes of this thought experiment.
All-in (mortgage + construction loan payment), my fixed debt costs per month will be ~$2,400. That leaves only $100 of cash flow, BEFORE non-cash and deferred-cash expenses.
Non-cash expense includes an implied 5% vacancy, for example. This is not something that will actually hit the bank account but will impact cashflow at some point. Deferred-cash expenses are depreciation, reinvestment, capital expenditures, and maintenance. When estimating ~15% of rents for expenses like these, monthly noncash and deferred-cash expenses add $375/mo. They represent expenses that will be realized at some point (you just don’t know when).
Therefore, my net cashflow on the high-equity-impact house is negative ($275) per month. That means I’ll have to contribute/invest an extra $275 of my own personal cash per month to maintain the property.
Opportunity Costs
I’ll highlight why this isn’t such a huge deal to me, by using an economics concept called Opportunity Cost.
For those unfamiliar, Opportunity Cost is the implied cost of doing something because it also means you’re NOT doing something else. Essentially what you do is valued against what else you could have done instead.
By having to ‘invest’ an extra $275/month in the ‘non-cashflowing-equity-impact’ house, I can’t allocate that ‘investment’ elsewhere…like the S&P500.
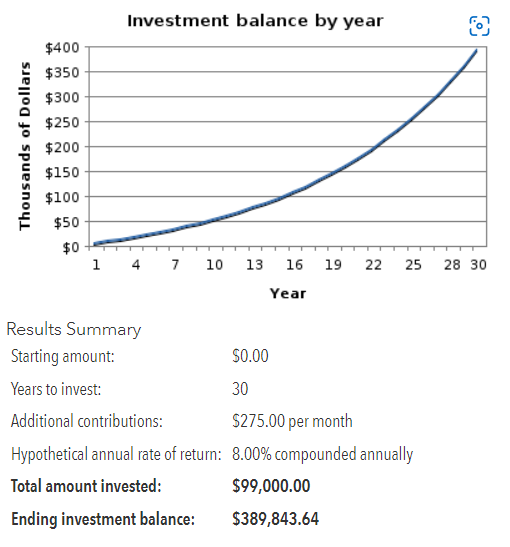
This is what my $275/month investment would look like in the S&P500 over 30 years (the length of my mortgage) at a long-term annual Rate of Return of 8%.
 Calculator & visualization courtesy of KJE Computer Solutions via American Funds
My $99k investment over 30 years turns into $389,843. Not bad! 394% total return over that timeframe.
Now, let’s discount that number back to today’s dollars to get a Present Value (PV). PV represents a lump sum today of what future cash flows are worth. Because the $275 is invested over 30 years, the $389k cumulative asset is actually worth $38,741 if I had it as a lump sum today. I do this, because the cash flows of real estate and S&P500 transactions aren’t the same. By bringing it back down to an PV level, I can compare apples to apples today, so to speak.
PV of S&P500 investment over 30 years = $38,741.
Real Estate Additional $275 ‘Investment’
Similar to the S&P500 investment, over 30 years, I’ll accumulate $99k of additional investment dollars in the house project. However, this doesn’t have the same future value as the S&P500 because the house underpins the future value.
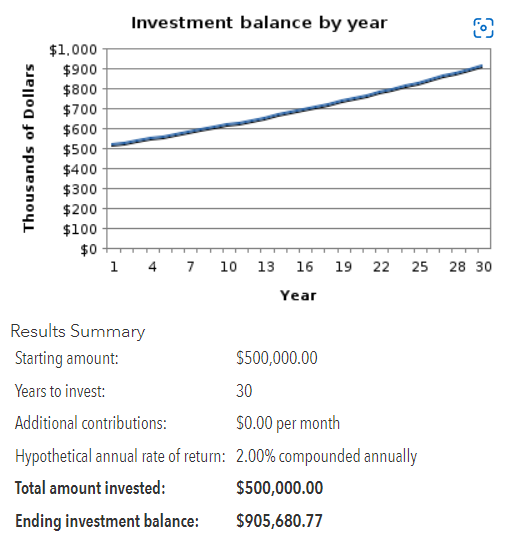
Here is what the property value will look like over 30 years.
 Calculator & visualization courtesy of KJE Computer Solutions via American Funds
The property appreciates to $906k, assuming 2% annual return, starting from current value of $500k. Zero additional contribution is appropriate for the house calculation, since there are no positive realized cash flows from the property.
The key, though, is that over the 30-year period, the mortage and construction costs have been paid down by the monthly rents. Even though the monthly rents didn’t cover ALL of the expenses, the debts still got paid down over time, and I have a free-and-clear asset worth $906k in 30 years.
To find the PV of the real estate transaction, I need to maintain the 8% Rate of Return (since that’s my opportunity cost to invest in the S&P500).
The Present Value (value today) of the $906k house in 30 years = $90,089. That’s 2.3x the return of the S&P500 when measured in dollars today.
The Comparison
Would you rather have $38k today or $90k today?
Seems like an obvious answer, right?
I’ll take the $90k.
The house only appreciates at 2%. The S&P is at 8%. The house still wins.
What’s the difference? For one, the house is starting with a value higher than the S&P500 investment. However, if you remove the starting value of the house from the future value, the house still yields $406k ($906k-500k). That’s still higher than the $389k S&P500 future value, although not by as much.
How is it possible to have such a large difference!? It’s mainly in how the investments change in value.
The S&P investment derives most of its value through appreciation alone. Yes, there will be dividends…but over the long-term, the lion’s share of value comes from appreciation of equities.
The house, on the other hand gains value through BOTH appreciation AND debt paydown (aka equity improvement). By leveraging debt, I wrangled myself into an asset worth $500k as a starting point, versus starting at $0, as is the case in the S&P investment. The value improves so much more because while the house is appreciating, I am simultaneously gaining equity in the asset as it gets paid down.
To highlight the importance of this even further, we can segment the value of the house into two camps: appreciation and debt paydown (equity improvement). After 2 years, the house only appreciates to ~$520k. However, over that same time, I’ll accrue ~$10k in equity from debt paydowns (using other peoples’ money, IE: rents). Combined, that’s $30k of value, compared to the S&P investment of only $7,100(24 monthly payments of $275 = $6,600 + $510 interest). The equity paydown alone eclipses the value of the alternative investment within 2 years.
This is the power of leveraged appreciation and equity improvement through real estate.
Summary / Consolidation / Conclusion
I am definitely over-simplifying what it means to hold a real estate investment property for 30 years. There’s a lot that goes into it, that just doesn’t matter if you throw the same $275/month into an S&P index. There is management, deferred maintenance, updates, and tenants to deal with.
Perhaps that’s exactly why the returns are so different.
There is an implied opportunity cost of time, that I haven’t mentioned to this point. The simplicity and plug-and-play value in the S&P really works if you’re not into managing rental property. However, the difference in value could indicate the implied worth of property management work over time.
The other thing I didn’t mention in the calculation is that after the 30-year mortgage is up, the house cash flows the full rent, less non-cash and deferred-cash expenses. After all the debt is paid off, that’s effectively $2,225 per month of straight cash flow. Let that hit your bottom line & see what happens.
Stay frosty, friends.
Technical Finance Note: Some of you might have noticed that I used PV of the future cashflow, instead of NPV, which would have included discounts on each of the $275/mo (or $3,300/yr) investment installments. Some others might notice that I didn’t include the cost to purchase and rehab the property in either calculation. I essentially used ‘finished house, renters in place’ as Time-0 in both calcs. This was all done intentionally to keep the calculations relatively simple. If I were to add those to a true NPV calculation, it would yield a similar result, albeit with lower NPV values than PV values. The PV is still an effective method to compare apples to apples of the relative asset values after 30 years. The $99k ‘investment’ over time is the same, regardless of the NPV/PV calculation convention.
Most Popular Reply
- Rock Star Extraordinaire
- Northeast, TN
- 16,432
- Votes |
- 10,186
- Posts
- JD Martin
- Podcast Guest on Show #243


