 Kumar Tummalapalli
Bathroom upgrade which is great condition but just outdated
Kumar Tummalapalli
Bathroom upgrade which is great condition but just outdated
27 January 2019 | 28 replies
Get something more visually stimulating, like a one-piece with a double flush European button on top or a sleek Japanese design like a Toto Aquia.3.
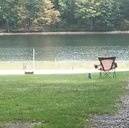
 Mike Kroupa
Curb Appeal Suggestions – Lake House
Mike Kroupa
Curb Appeal Suggestions – Lake House
1 October 2017 | 25 replies
You might also consider a stone wainscot slightly higher than the window sill line... it would give it some visual weight.Some landscaping is definitely in order, but again, I'd have to see the completed version to make good recommendations.
 Jay Hinrichs
Recession, Market Crash, Bubble ??
Jay Hinrichs
Recession, Market Crash, Bubble ??
26 February 2019 | 34 replies
Low supply and high demand means higher prices.For a recession to impact the housing market, it would need to fundamentally alter this dynamic between supply and demand.
 Steven Maduro
Apartment Size Appliances. On the cheap
Steven Maduro
Apartment Size Appliances. On the cheap
13 July 2015 | 13 replies
I failed to mention that the cabinets are already purchased.I have planned this kitchen for 3 years.and I went with the smaller appliances despite the fact that they are more expensivebecause they look better in the spaceI chose operational effectiveness over operational Efficiency you would have to see the space to understand. but trust me saving 1,500 dollars on appliances by going with larger ones was certainly vetted and I ultimately decided to go with the more expensive option of the smaller appliances because it leaves a smaller visual foot print. because it just fits the space much better.
 David W.
Best Cities to invest in under $100k
David W.
Best Cities to invest in under $100k
14 April 2019 | 352 replies
Here are the affluent zip code gross yield, for the nation's most demographically dynamic MSA: Indianapolis IN pop cum growth 30% , gross rental yield 10.6%Houston TX pop cum growth 41% , gross rental yield 8.6%Dallas Fort Worth pop cum growth 38%, gross rental yield 8.4%Atlanta GA pop cum growth 34% , gross rental yield 7.8%Orlando FL pop cum growth 45% , gross rental yield 7.7%Des Moines IA pop cum growth 29% , gross rental yield 7.6%Charlotte NC pop cum growth 40% , gross rental yield 7.4%Jacksonville FL pop cum growth 29%, gross rental yield 7.4%Phoenix AZ pop cum growth 41% , gross rental yield 7.0%Raleigh Cary NC pop cum growth 60%, gross rental yield 6.7%San Antonio TX pop cum growth 39%, gross rental yieldNashville TN 40% 6.7%Colorado Springs CO 30% 6.5%Denver CO 29% 6.4%Charleston SC 36%, 6.4%Greenville SC 56% 6.4%Provo Orem UT 55% 6.2%Austin TX, 60% 5.6%You should note that local tax and insurance is much higher in Florida than other states so that 3% to 5% more needs to be deducted from gross yield to compare to other states such as Georgia or North Carolina.Be careful that properties that have no appreciation potential should have proper capex baked into the numbers.
 Myka M.
Totally new at this commercial thing, but knows a good deal when she sees one!
Myka M.
Totally new at this commercial thing, but knows a good deal when she sees one!
8 March 2010 | 28 replies
Good visualization at breakfast :-).Mike and Rich and everyone who posted here...
 James Bynum
Multi Unit Plumbing Problems
James Bynum
Multi Unit Plumbing Problems
28 May 2016 | 3 replies
I used different bright colored masking tape to temporarily mark each pipe, to help me visualize where everything went.
 Brian Coleman
Internet/Smart phone based intercom system
Brian Coleman
Internet/Smart phone based intercom system
8 June 2021 | 6 replies
Yes, basically I'd like a relatively cheap system (say $1000 or less) where the FedEx guy (or anyone) can call the tenant, it rings on their phone, they can visually see who it is, and click a buzzer to let them in.
 Jeremy Ashford
6-unit former storefront: looking for design ideas for exterior
Jeremy Ashford
6-unit former storefront: looking for design ideas for exterior
21 June 2017 | 10 replies
I found the Sherwin Williams ColorSnap Visualizer pretty useful as well.
 Mark Forest
Fixing up method
Mark Forest
Fixing up method
30 December 2008 | 14 replies
I find that breaking a project into components helps to visualize what i need and what I might need if something unexpected pops up.