
Can the Las Vegas Housing Boom Continue?

Photo by rovenimages.com from Pexels
The short answer is, "Yes!" at least for the foreseeable future. Now let's dig into why we make such a statement.
It's All About Demand
The two properties below are similar in size, age, bedrooms, and baths. One has an asking price of $2.5M and the other $137,000. Demand is why one is worth so much more than the other.

So, what is driving demand in Las Vegas?
I believe the following to be the major drivers; they are not listed in any specific order.
- Jobs - There's currently over $24 billion under construction, and approximately another $7 billion has been announced. All these new projects will create thousands of new well-paying jobs. All these new jobs will bring thousands to Las Vegas and increase demand, driving up prices and rents.
- Population Growth - The population continues to grow at a very sustainable rate of about 2.5% to 3%, fueled by new jobs created and migrations from out of state for lower cost of living and higher quality of life.
- Low cost of living and low cost of operating a business - Las Vegas' cost of living and operations is lower than most similar metro areas. Specifically:
- Pro-business government
- Low property taxes - The average property tax rate is 0.55%. According to MortgageCalculator.org, Nevada has the 9th lowest property tax rate in the nation.
- Low cost insurance - The cost of property insurance is a good indicator of the risk of a major natural disaster. Nevada has the 10th lowest average insurance cost in the nation.
- Properties are affordable - The current sweet spot for single-family investment properties is between $280,000 and $400,000.
- Positive cash flow - Return with 25% down is usually between 3% to 6% after all recurring expenses, including management, taxes, insurance, and debt service.
- High rate of appreciation - Average annual appreciation over last nine years: 9%. YoY rent growth was 14.3% (May 2021). YoY appreciation was 18%! (May 2021)
- High demand for rental properties - The median time to rent for properties that conform to our property profile is < 10 days.
- Low maintenance cost - Las Vegas properties have low maintenance costs due to the construction materials required by the Mojave Desert climate.
- Low commercial energy cost - California: $0.18/KwH, Nevada: $0.046/KwH. Also, Las Vegas is one of the few cities in the US with dual sources of electric power, critical for servers and electricity-dependent industries like data centers and Internet switching.
- Internet backbone - The fiber optic bundle connecting Southern California to the East Coast runs under Las Vegas Boulevard. This is part of the reason Google is building a $1.2B data center here. Also, Google just announced that they will launch a “first-of-its-kind, next-generation” geothermal project in Las Vegas.
- Landlord friendly - Time and cost to evict a nonperforming tenant: <30 days and $500. Also, the laws allow lease agreements to place much of the cost for damages on the tenant, plus the ability to deduct any damage beyond reasonable wear and tear from the tenant's security deposit. The lease agreement terms are the major reason why our target properties' average tenant turn cost is under $500.
- Proximity to California - California seems to be doing all it can to drive people and companies out of the state. The proximity to California, especially LA, ensures that Las Vegas will continue to gain population and businesses.
- Land shortage - Las Vegas is an island surrounded by federal land. At the end of 2019, the amount of vacant buildable land in the Las Vegas Valley was less than 28,000 acres, of which 5,000 to 7,000 acres is not viable for residential development. (87.5% of Clark County is federally owned. 85% of the entire state is federally owned.) Consumption rate is about 5,000 acres/year. See the animated GIF below. The areas in brown are federal land. The time-lapse only goes through 2018, and there was a large amount of development in 2019 and 2020. The shortage of land combined with the increasing population almost guarantees property prices and rent will continue to increase.
- No urban sprawl - In locations like Phoenix and most other cities, property prices and rents increase slowly because there is no limitation to expansion. Buyers consider whether to buy an older property and renovating it, or drive 10 more minutes and buy a new home. The lack of land for expansion in Las Vegas and the increasing population ensures that rents and prices will continue to rise.
What About Current Inventory?
Spoiler alert! There is less than one half month of supply for both sales and rentals!
The charts below are based on data from the Greater Las Vegas Association of REALTORS (GLVAR) MLS, which only applies to properties that conform to our investment property profile.
Rental Statistics
Rentals - Median $/SF by Month
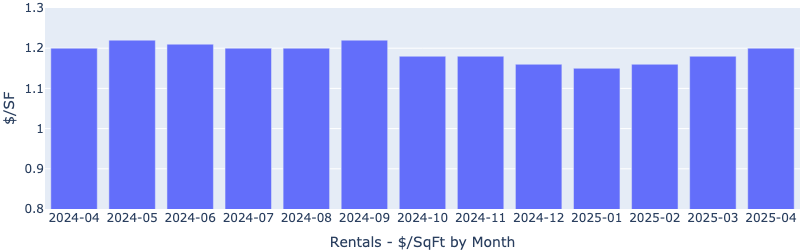
YoY rents grew 14.3%. A phenomenal growth for rents.
Rentals - List to Contract Days by Month
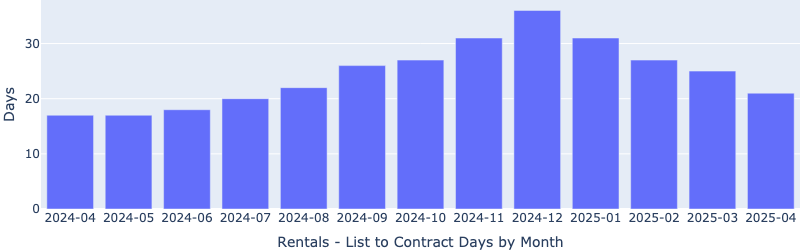
Median days on market has been under 10 days since March 2021.
Rentals - Availability by Month

Rentals - Months of Supply
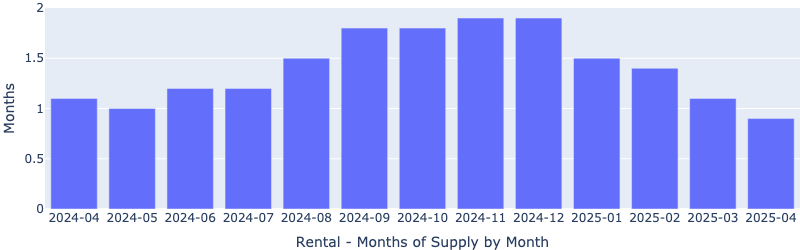
Only half a month of supply for our target rental property profile.
Sales Statistics
Median $/SF by Month
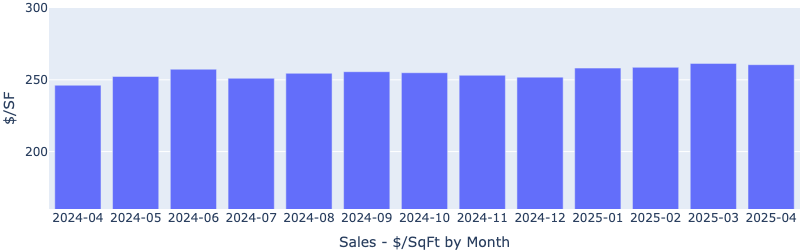
YoY prices increased by 18%!
Sales - List to Contract Days by Month

Median days on market has been near 5 days since March 2021.
Sales - Availability by Month
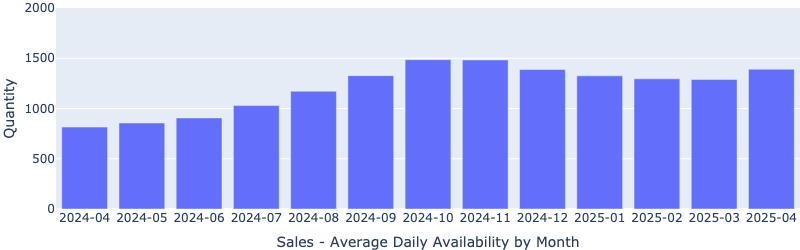
Inventory has been steadily declining since September 2020.
Sales - Months of Supply
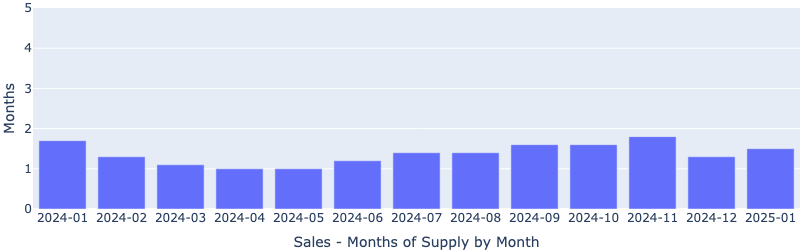
There has been less than half of a month of supply since March 2021.
Is the Market Overheated?
Housing prices for Las Vegas are still well below the 2006 peak prices. The chart below includes all price ranges of single-family homes in the metro Las Vegas area. If you ignore inflation, prices have almost reached the 2006/2007 peak. However, inflation is real and must be considered. $174/SF in 2008 dollars is the same as $234/SF in 2021 dollars so there is still a long way to go.

What About Foreclosures?
This is not 2008. In 2008, all properties were underwater; foreclosure was the only option. And, there was 90 (ninety) months of inventory so the odds of selling any property at peak value was very small. Today, there is about 0.5 months of inventory and almost all properties are above water. If people get into financial trouble today, the majority will sell their homes, pocket the profit, and rent a place to live. How serious is the distressed property situation in Las Vegas today? I searched the MLS (06-04-2021) for distressed properties:
- Bank owned: 18
- Short sale: 18
- Foreclosure started: 5
Not a significant percentage of all available properties.
Market Risks
Another COVID like event. However, demand and property prices have risen all through last year. So I do not know what impact another similar virus would have.
California completely changes and becomes the go to state for low-cost operations, personal freedom, and limited government control. I put the risk of this happening on par with being struck by a meteor while I'm writing this article.
Major terrorism event - Terrorism is always a concern, but I don't think any group would target Las Vegas when there are much better targets.
Dramatic increase in interest rates - I think this is the most probable event that could derail the national and Las Vegas market. However, the Fed is committed to keeping interest rates low so I do not see this happening in the foreseeable future.
In Summary
Predicting anything beyond yesterday is guessing, so no one knows for certain. We can only look at the current market and extrapolate from this what we see happening in the foreseeable future. Today, we see no indicators that prices will decline or even level off. There is simply a shortage of inventory, and new home builders cannot keep pace with the demand. Plus, Las Vegas has an overall limit for expansion. I've never heard of a situation where an ever increasing amount of money was chasing a declining pool of resources when prices did not rise. So, now you know why we believe that the current trend will continue for the foreseeable future.


Comments