
Is Las Vegas' Growth Sustainable?
Las Vegas is in a state of rapid growth. We are frequently asked: "Has the Las Vegas market maxed out?", "Is the current growth sustainable?"As you will read later in this post, Las Vegas is very likely to continue to grow for several more years.
Current Market Condition
The value of anything is determined by demand. For example, would you pay $100 for a half consumed bottle of water? No? Suppose you are lost in the Mohave desert and dying of thirst. You would be willing to pay $100, $1,000 or any amount of money for the same half consumed bottle of water. Such is the difference demand makes. The same is true with real estate. I look in some cities and a 1,500 SqFt single family home is selling for $15,000. The same house in some coastal cities in California would sell for $2,000,000 or more. Like the previous example, it’s the same house but different demand. So, let’s start by looking at the current Las Vegas real estate and rental demand situation today.
Current Demand
I will subdivide the demand question into sales and rentals.
Sales
The best demand barometers I know of for the current market is the trend of: days on market, $/SqFt and inventory.
Days on Market
Days on market is the number of days between when a property is listed and the date when the property is placed under contract. As you can see below, the days on market is currently about 15 days. This includes over priced properties that may well sit on the market for months or longer so 15 days is a very short period of time for real estate. The short days on market indicates a high level of demand.
$/SqFt
Price per SqFt ($/SqFt) is another indicator of demand. The chart below shows $/SqFt since 2008.
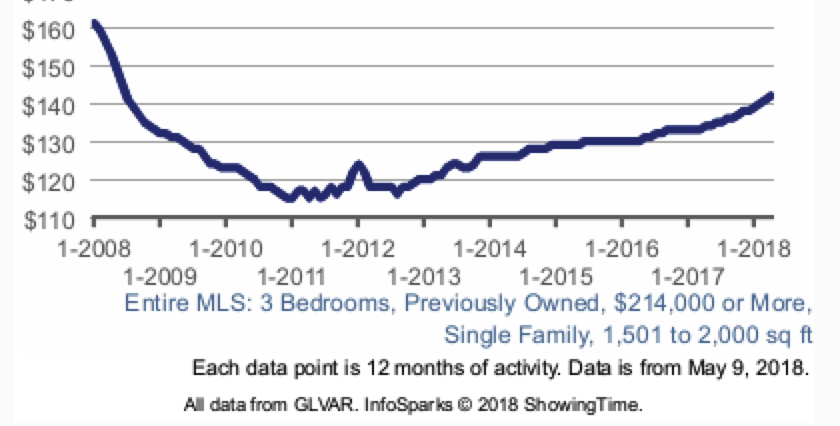
Note that while prices have increased since the bottom in 2011, we are still at about 80% of the 2007 peak prices. Also, Las Vegas has the further to go to reach pre-crash peak prices than any other major city.
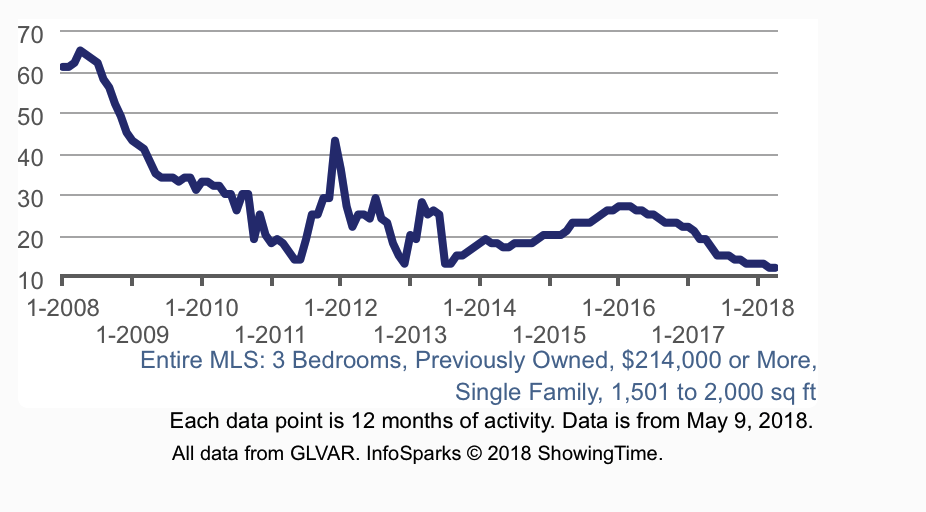
Inventory
Inventory is measured in months of supply. A six month supply is considered balanced. As you can see below, current inventory levels are about 1.8 months of supply, which indicates a high level of demand.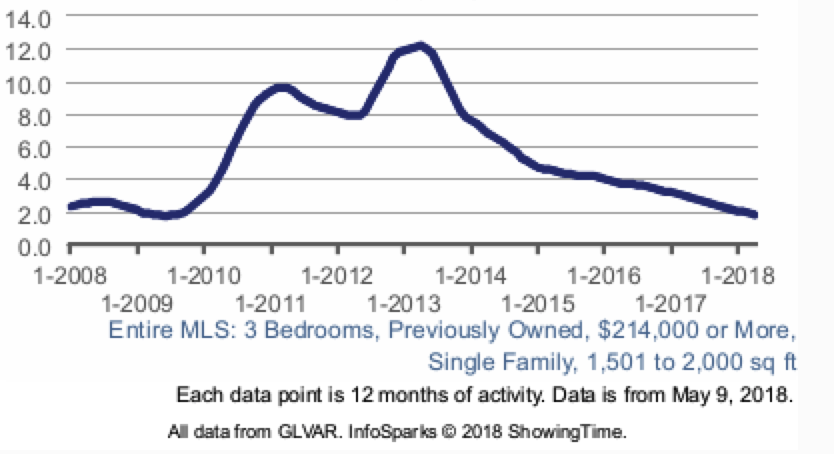
Rentals
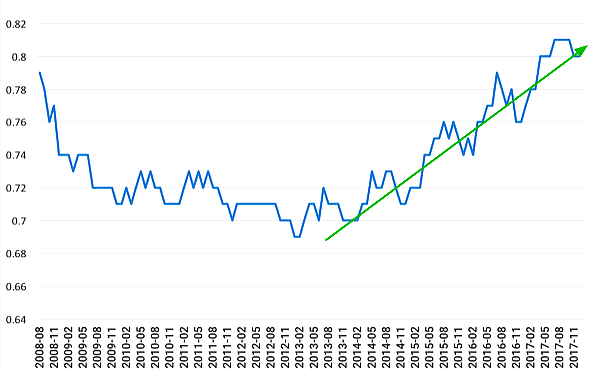
$/SqFt
The following data is for the entire MLS, not just the narrow property profile we target. As you can see, rents have steadily risen since 2013.
Rental Inventory
Over the last few months, total available rental properties has fallen. Below is the total number of rental properties available on the 18th of the month, by month, by type.

As you can see, rental inventory has decreased drastically since January. Note that we have not even entered the peak rental demand period of June through September.
Typically, time-to-rent is 2 to 3 weeks. Today, we are closer to 2-3 days.
Current Demand Summary
The numbers clearly indicate there is significant demand for both properties to purchase and properties to rent. Declining inventories in both sales and rentals indicate that property prices and rents will continue to increase, at least in the remainder of 2018. How about in the foreseeable future?
Future Demand
While no one can accurately predict the future, you can infer what a market is likely to do by looking at current and recent trends. Stock investors do this all the time. Fortunately, while stock prices can change almost instantaneously (sometimes due to seemingly unrelated events), real estate markets generally change very slowly, which makes trends easy to spot.
Purchase and rental demand is largely driven by:
- Jobs - Real estate is no better than the jobs around them.
- Population growth - More buyers means increasing demand.
- Urban sprawl - If people are leaving an area, demand in that area will fall. This is true even if the population of the metro area is unchanged or growing.
Population growth
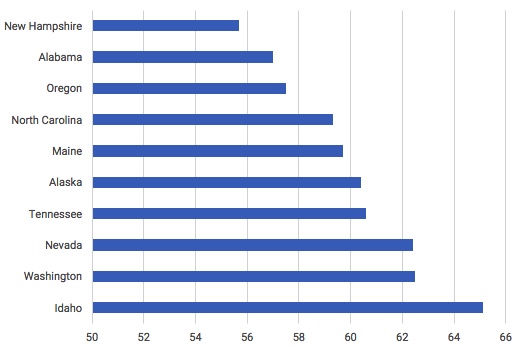
Las Vegas’ population grew by 2.2% in 2017. This is a healthy and sustainable growth rate. Nevada ranked 3rd in Atlas Van Lines annual migration report in terms of most popular states to move into. See the graph below. The numbers show what percentage of moves are inbound vs. outbound from the state. Greater than 50% indicates more people moved into the state than out of the state.
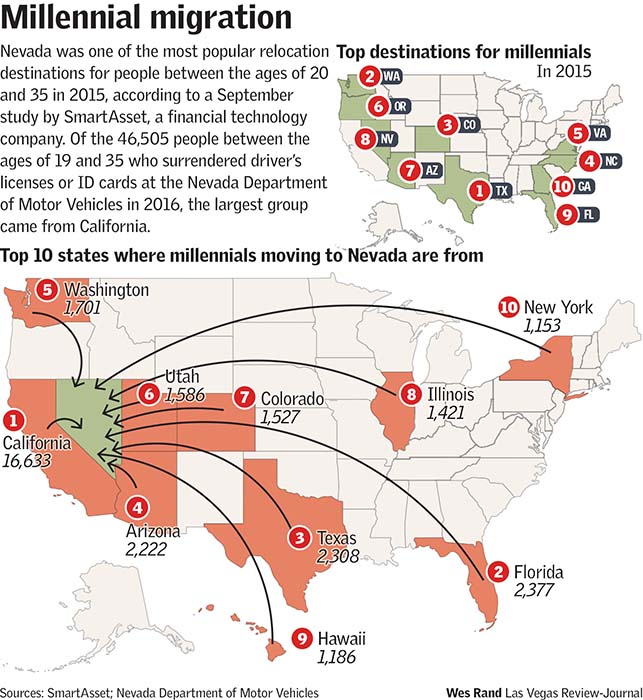
Below is a 2015 graphic (I was not able to find a more recent similar graphic) showing the top states from which people are moving to Nevada. Note that the population of Las Vegas is about 80% of the population of the state of Nevada so the majority of the new population is likely moving to Las Vegas. Note that while the numbers shown below may seem small if you compare them to the population of California, the total population of Las Vegas is approximately 2.3M so the number of people moving in has a big impact.
Jobs
Rental properties are no better than the jobs around it and Las Vegas is experiencing a lot of job growth. However, the quantity of jobs is only half of the story.
Job Quality
Job quality is almost as important as job quantity. For example, in many parts of the US high paying manufacturing jobs have gone away, such as the automotive manufacturing jobs for which the average pay was about $40/Hr plus benefits. Today, these same people are most likely working in the service sector. Services sector jobs typically pay between $11/Hr and $13/Hr. So, while the overall job quantity did not change, the quality did. If people are earning less, what they can afford to pay for rent will fall over time as well. What does this mean to you as a landlord?
The best metric I know of for determining overall job quality for an area is inflation adjusted per-capita income. See the chart below from the St Louis Federal reserve.
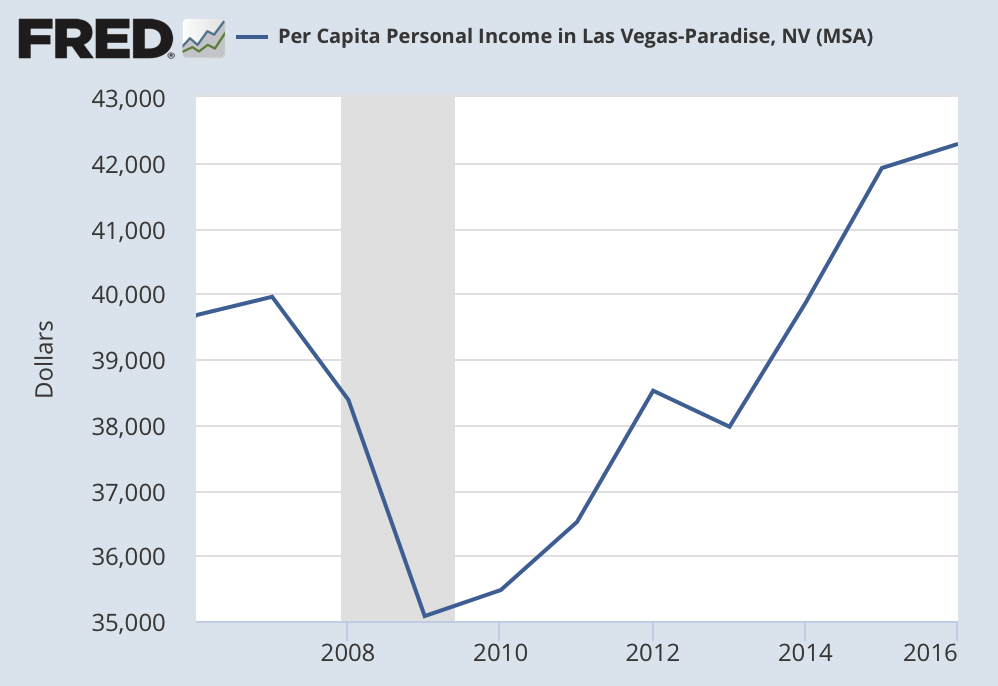
As you can see, per capita income continues to rise in Las Vegas which means quality is increasing.
Job Quantity
A good measurement is the rate of unemployment. As you can see below, unemployment is around 5%, which is great compared to what it was in 2010. How do the current number of jobs compare to pre-crash job numbers? In 2016, Nevada surpassed pre-recession employment levels with 70,000 fewer construction jobs. (Note: Las Vegas metro area is about 80% of the total state population.) Here is a report by the Federal Bureau of Labor Statistics on Las Vegas employment.
As the population of Las Vegas continues to grow, unless the number of jobs increases as well, unemployment will rise. Below is a chart showing the rate of unemployment for the metro area from the St Louis Federal reserve.
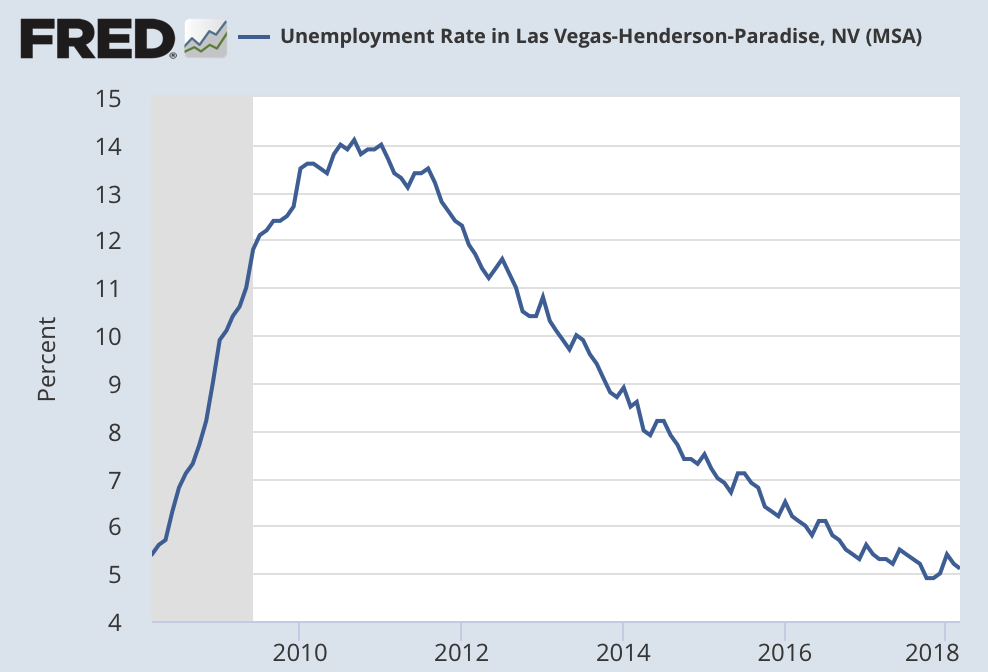
As you can see, despite the increase in population, unemployment continues to decline and per-capita income continues to increase. A very good combination for the future.
While it is hard to quantify the number of jobs generated by small to medium businesses, it is easy to quantify for large projects.
Major Projects
Below are some of the top projects under construction in Las Vegas. These projects create large numbers of both short term (mostly construction) jobs and long term employment once the projects are complete. And, every worker will need a place to live.
- Resorts World Las Vegas - $7.2B
- Drew Las Vegas (formally the Fontainebleau) - $3B
- Raider’s Stadium - $2B
- Wynn Resorts World - $1.9B
Other Sources Of Growth
Blue State Refugees
Since Nevada is adjacent to California, I will focus my remarks specifically on California. However, people who leave blue states due to the high cost of living will look at places like Las Vegas.
I’ve researched one segment off California population that will be greatly impacted by the 2018 Tax Act and rising prices and taxes and that is people living on a fixed income.
California has about 6M retired people. Due to the 2018 Tax Act, an unknown percentage will choose (or be forced) to leave the state and look for a lower cost of living. Las Vegas is a known location to the people of Los Angles and San Diego. The fact that it is only 4 hour drive away from friends and family is a major plus. Lets look at the numbers.
If 0.25% of the 6M retired people in California decide to move to Las Vegas and we assume that all are couples, the number of residences needed will be:
6M x 0.25% / 2 = 7,500
To put this in perspective, the total number of single-family homes sold in Las Vegas in 2017 was 34,659. If an incremental demand for an additional 7,500 residences occurs over the next coupled of years, demand will further increase sales and rental prices.
You might question whether this is only a short term situation because developers could just add thousands of new homes to meet the demand. The short answer is, “No.” The reason is a lack of available and desirable land.
Limited Land
Las Vegas is an island surrounded by federal land. See the map below. The areas in red are federal land.
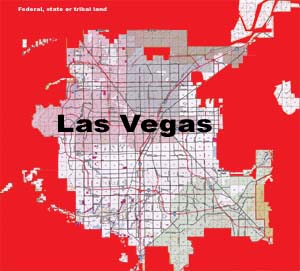
See the gif below to see how the metro area has consumed the available land between 1984 and 2016.
Las Vegas is in a situation where:
- Population is growing
- Job quality and quantity is increasing
- Unemployment is decreasing
- Due to the low cost of living and no state income taxes, is very likely to attract a percentage of people seeking a lower cost of living
However, there is more to the story.
Corporate Expansion
The 2018 Tax Law reduced tax rates and encourages US corporations to expand operations within the US as opposed to overseas. Below is a small example of the factors that make Las Vegas a desirable location for businesses.
- The fiber optic lines connecting the West and East coast run under Las Vegas Blvd.
- Within 2 days driving distance to 20% of the population of the US, which is desirable for distribution centers.
- Las Vegas is one of the few large metro areas with dual sources of electric power: Hoover Dam and California. This is a huge advantage for server farms, manufacturers and others who cannot afford to lose electrical power.
- Relatively low energy cost. For example, below is a comparison between the statewide energy cost in California vs. Nevada.

- No state income tax.
- Nevada’s proximity to California is important for companies looking for new locations.
- Nevada is a Right to Work state, along with 27 other states. For information on the benefits to employers, see this Wikipedia page.
- Nevada is a business-friendly environment.
While Las Vegas is a desirable location for business expansion, what will drive large expansions? The reduced tax on repatriating funds that have been sitting in offshore accounts for years. Apple just made a $38B tax payment in order to repatriate their cash held overseas. Apple also announced plans to add 20,000 US jobs. Apple is only one of many companies who hold money overseas due to high US taxes (35%). With the 2018 tax changes, I believe more will follow Apple’s lead. Below is a list of the top 10 US companies that have funds stashed overseas.

The above are the biggest but only a small subset of the total number of US companies with overseas deposits. One article I read placed the total dollars sitting in offshore accounts at $3.1T!
If you suddenly inject close to $1T into the US economy and it is done efficiently (not by the government) this will have a huge impact on US growth. Companies will be looking to expand in the US and will be looking for new US locations. Las Vegas has enough advantages that a percentage of the expansions will be in Las Vegas, which will bring more people to the city, who will all need places to live.
Summary
Today the Las Vegas economy is rapidly expanding and, with just a few of the opportunities I described above, Las Vegas should continue to expand for the foreseeable future.


Comments