$699,900
Investment Summary
- Monthly Cash Flow
- -$1,801
- Cap Rate
- 3.2%
- Cash-on-Cash Return
- -13.4%
- Debt Coverage Ratio
- 0.51
- Internal Rate of Return (5 years)
- -9.0%
Cash Flow
Net Operating Income (NOI) minus mortgage payments.
Calculation:
NOI - Mortgage Payments
Cap Rate (Market Value)
Capitalization Rate is a rate of return that compares the yearly Net Operating Income (NOI) to the market value.
Calculation:
NOI / Market Value
Cash-on-Cash Return (CoC)
Annual Cash Flow / Cash Invested
Calculation:
Annual cash flow divided by initial cash invested.
Debt Coverage Ratio (DCR)
Net Operating Income (NOI) divided by total debt payments.
Calculation:
NOI / Total Debt Payments
Internal Rate of Return (IRR)
A metric for assessing profitability over time. IRR is the discount rate at which the net present value (NPV) of all future cash flows (positive and negative) from an investment equals zero — including both periodic cash flow (such as rent) and a projected sale at the end of the holding period. It represents the expected annualized return, accounting for income, expenses, and the recovery of capital through a future sale.
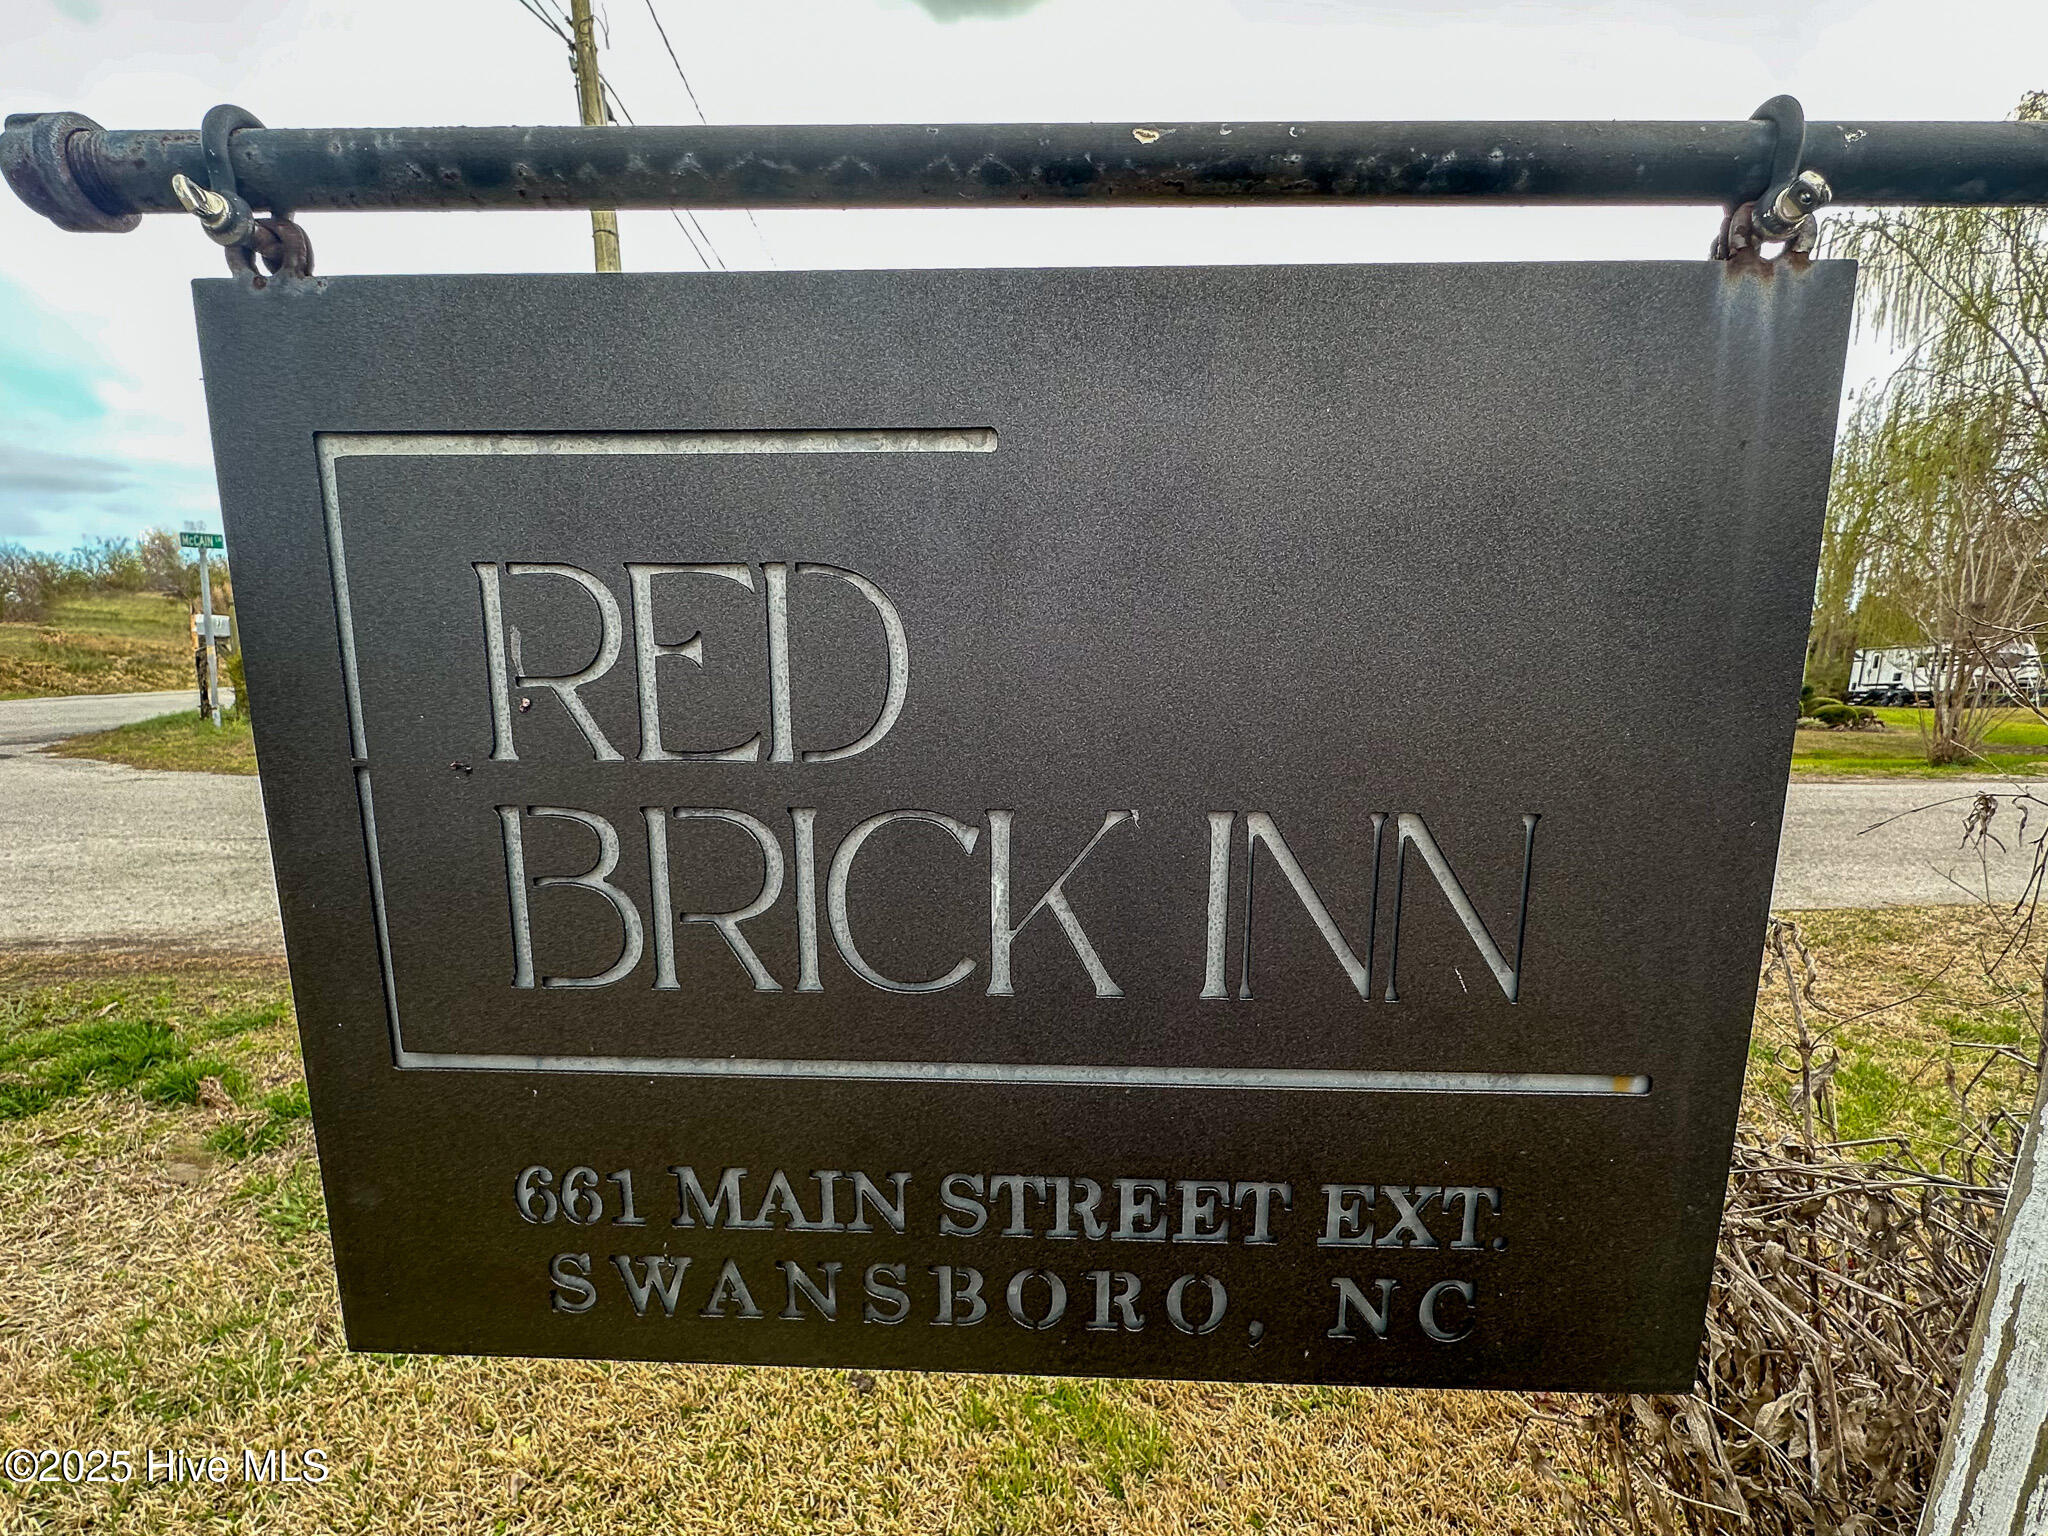
Property Description
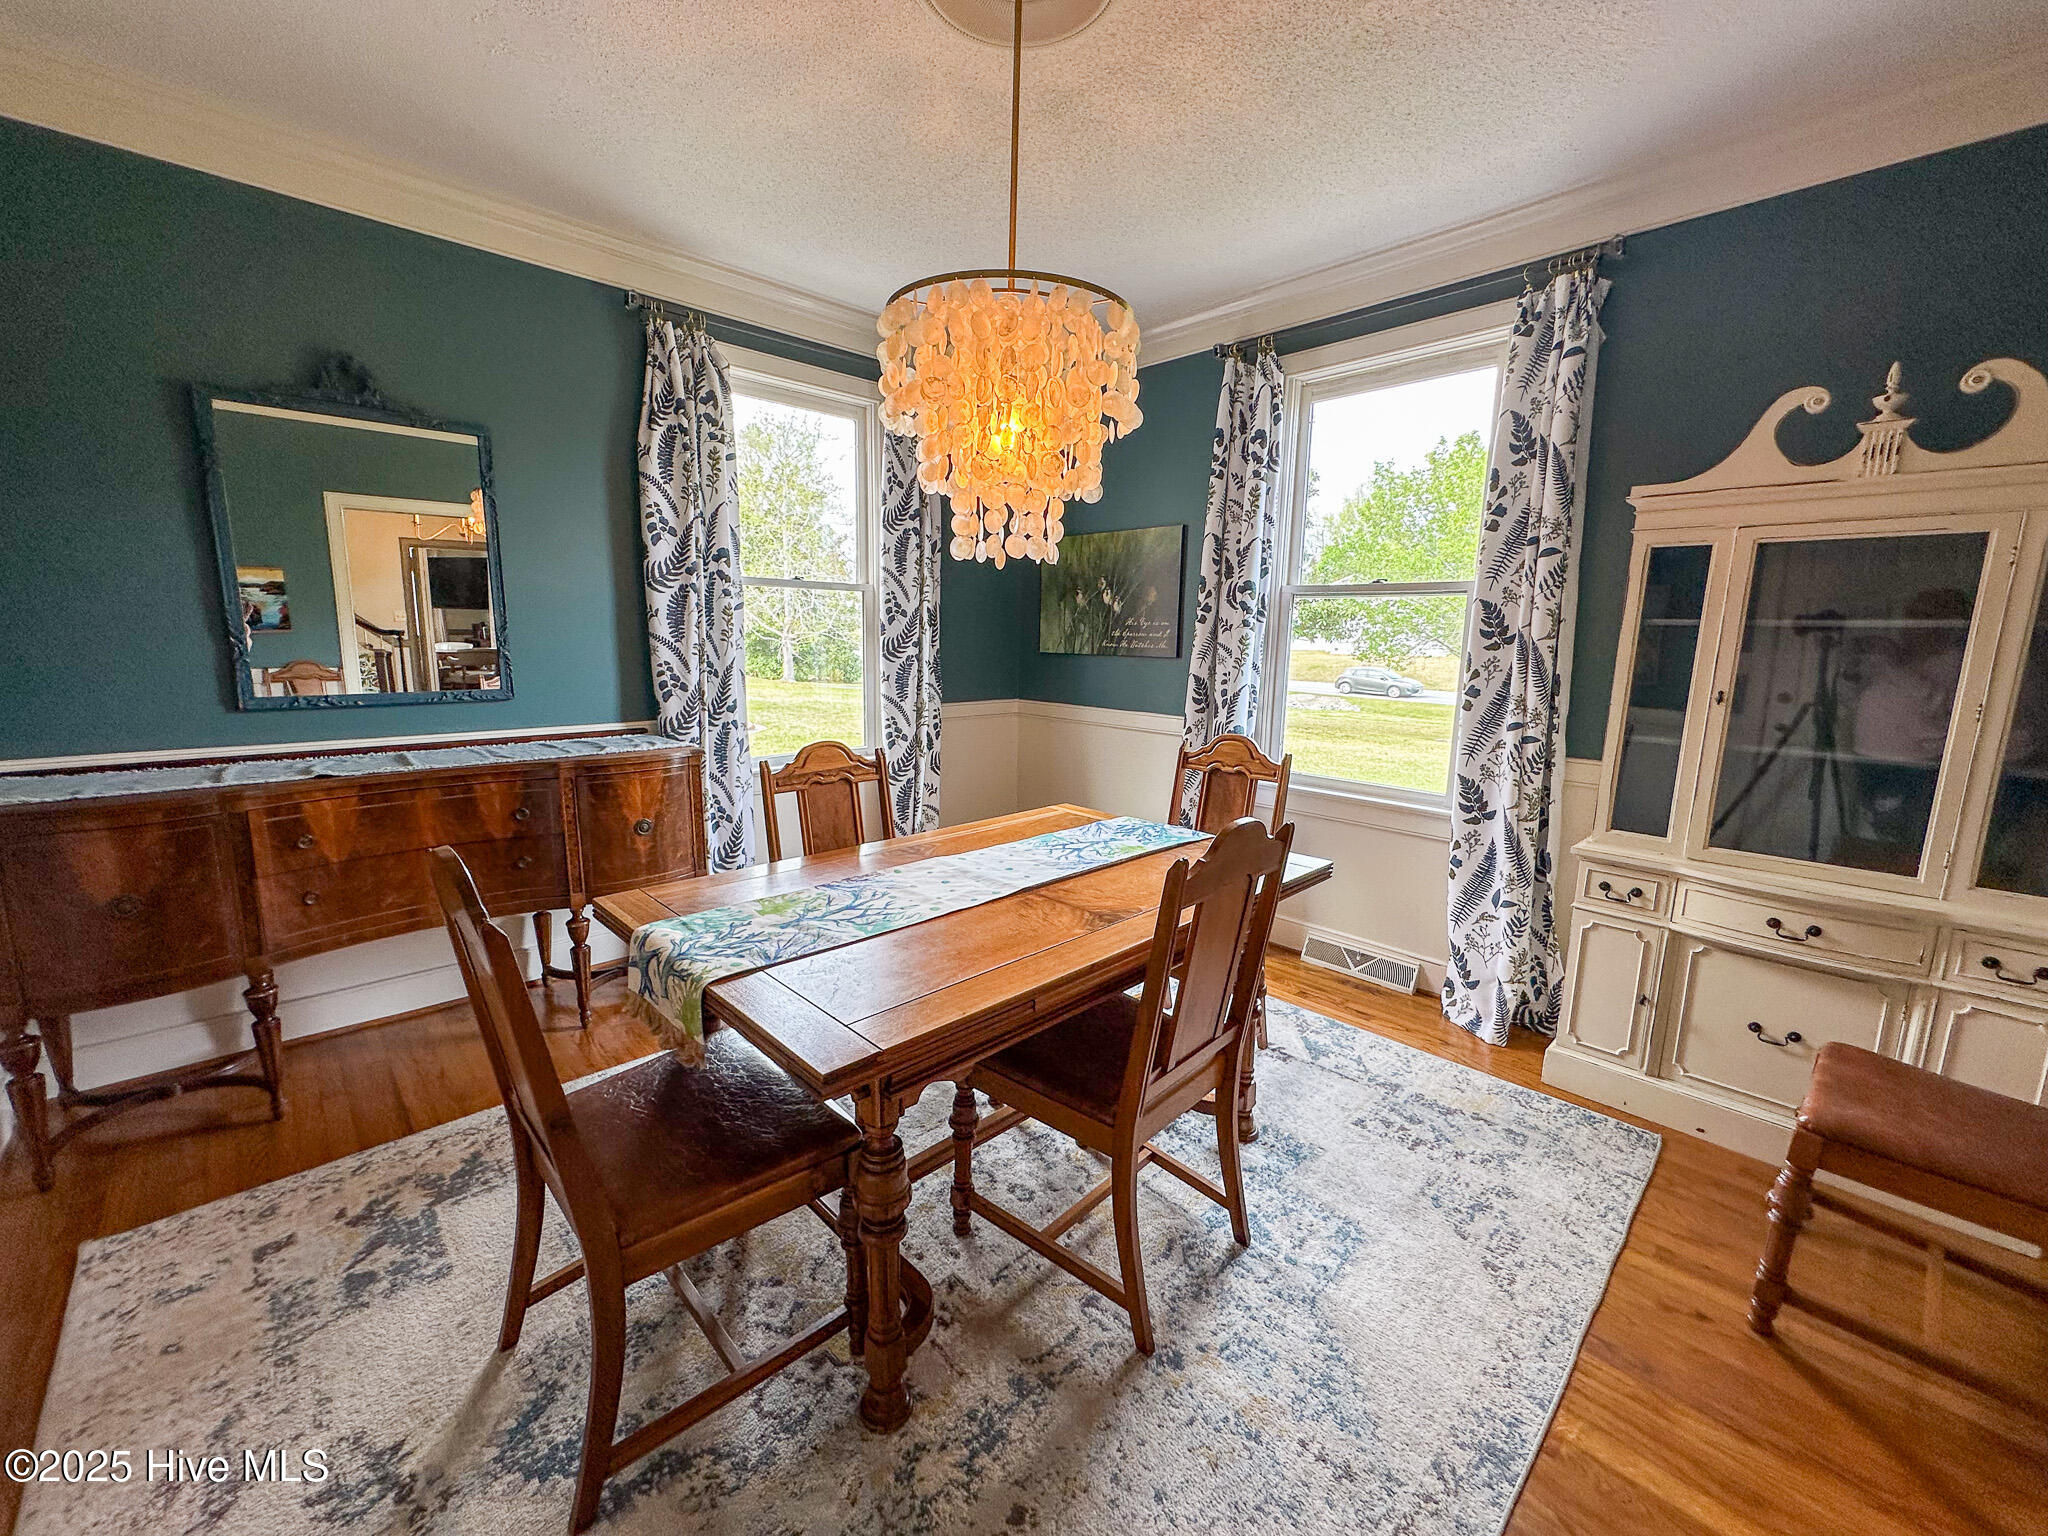
The Tucker House, circa 1973. Originally built and operated as an Inn, The Tucker House is full of NC history. The brick for the home and walkways was purchased at auction by Mr. Tucker when the original 1901 Pepsi plant in New Bern was torn down. After being used as a single family residence, from previous owners, the current owners decided to bring it back to its glory days and operate it as an Inn, as well as their full time residence. Since the current owner is also an herbalist and master gardener, the gardens out back are a chef's dream, full of many different types of fresh herbs for cooking, as well as medicinal herbs. The primary suite is located on the main level. The en suite offers a dressing/vanity area plus a large soaker tub and shower. 2 other suites are located upstairs. The Swansboro room features a private bath and coffee bar. The Crystal Coast Room features a large private bath, main bedroom space plus an additional bonus room for extra guests/play room/office. The main floor also features a formal dining room, living room, half bath and a large laundry room with office space and under cabinet lighting. The current owners updated all of the light fixtures and painted throughout when they purchased the home in 2021. The original hardwood flooring covers the foyer, living room and dining room. Enjoy a large lot flanked with beautiful trees and walkways. Fig vines run along the chimney and the detached garage is the perfect place to house your classic vehicles or your workshop. There is plenty of parking for your cars as well as guest cars. Located just down the road from historic downtown, you can easily enjoy all of the waterfront festivals, summer concerts and downtown dining. Beautiful Emerald Isle beaches are just 6 miles away. Hammocks Beach State Park is 1.5 miles away and both Camp Lejeune and Cherry Point main gates are an approximately 30 minute drive. Call today for your private tour.
Build Your Team
Quickly find investor-friendly professionals who can help you succeed in real estate investing at any stage of the investing journey.


Agents
Match with investor-friendly agents who can help you find, analyze, and close your next deal


Lenders
Get the best funding…find investor-friendly lenders who specialize in your deal strategy


Property Managers
Transition to passive investing. Find a trusted property management partnership that lasts.


Tax Pros & Accountants
Taxes and financial reporting made easy—find experts to create tax savings strategies, file taxes, and more
Location
Property Details
Parking
- Description: On Site, Paved
- Details: Detached, Additional Parking, Concrete, Garage Door Opener, On Site, Paved
- Garage Spaces: 0
- Spaces Total: 2
Bedroom Information
- # of Bedrooms: 3
Bathroom Information
- # of Baths (Full): 3
- # of Baths (Partial): 1
- # of Baths (Total): 4.0
Interior Features
- # of Rooms: 7
- # of Stories: 2
- Basement Description: Crawl Space, None
- Fireplace: Yes
Exterior Features
- Exterior Walls Materials: Brick Veneer
- Roof Material: Shake, Shingle, Wood
Land Information
- Land Use: Residential
- Land Use Subtype: Single Family Residential
Lot Information
- Parcel ID: 027174
- Lot Size: 37026 sqft
Property Information
- Property Type: Single Family Residence
- Year Built: 1973
Tax Information
- Annual Tax: $4,257
Utilities
- Water & Sewer: Public
- Heating: Heat Pump, Fireplace(s), Electric, Propane
- Cooling: Ceiling Fan(s), Central Air, Zoned
Location
- County: Onslow
Listing Details
Investment Summary
- Monthly Cash Flow
- -$1,801
- Cap Rate
- 3.2%
- Cash-on-Cash Return
- -13.4%
- Debt Coverage Ratio
- 0.51
- Internal Rate of Return (5 years)
- -9.0%
Cash Flow
Net Operating Income (NOI) minus mortgage payments.
Calculation:
NOI - Mortgage Payments
Cap Rate (Market Value)
Capitalization Rate is a rate of return that compares the yearly Net Operating Income (NOI) to the market value.
Calculation:
NOI / Market Value
Cash-on-Cash Return (CoC)
Annual Cash Flow / Cash Invested
Calculation:
Annual cash flow divided by initial cash invested.
Debt Coverage Ratio (DCR)
Net Operating Income (NOI) divided by total debt payments.
Calculation:
NOI / Total Debt Payments
Internal Rate of Return (IRR)
A metric for assessing profitability over time. IRR is the discount rate at which the net present value (NPV) of all future cash flows (positive and negative) from an investment equals zero — including both periodic cash flow (such as rent) and a projected sale at the end of the holding period. It represents the expected annualized return, accounting for income, expenses, and the recovery of capital through a future sale.
Purchase Details
Purchase PriceThe price paid for the property. Purchase price:
| $699,900 |
|---|---|
Amount FinancedThe amount of the purchase financed through a loan. Amount financed:
| -$559,920 |
Down paymentThe initial payment made towards the purchase. Down payment:
| $139,980 |
Closing CostsFees and expenses associated with purchasing a property, typically ranging from 2% to 5% of the home’s purchase price, paid at the end of a home purchase to cover services like lending, title transfer, and taxes. Closing costs:
| $20,997 |
Rehab CostsCosts incurred to repair or improve the property, including: roof, flooring, exterior siding, kitchen, exterior paint, bathrooms, etc. Rehab costs:
| $0 |
Initial Cash InvestedThe total initial cash invested in the property. Calculation:Down payment + Buying costs + Rehab costs Initial cash invested:
| $160,977 |
Square Feet (SQFT)The total square footage of the property. Square feet:
| 2,717 |
Cost Per Square FootCost per square foot of the property. Calculation:Purchase Price / Square Feet Cost per square foot:
| $258 |
Monthly Rent Per Square FootMonthly rent divided by the number of square feet. This ratio helps investors compare rental income efficiency across properties, markets, and unit sizes Calculation:Monthly Rent / Square Feet Monthly rent per square foot:
| $1.18 |
Financing Details
Loan AmountThe total sum of money borrowed from a lender to finance a property purchase. Calculation:Purchase Price - Down Payment
Loan amount:
| $559,920 |
|---|---|
Loan to Value Ratio (LTV)Loan amount divided by the market value of the property. Calculation:Loan Amount / Market Value
Loan to value ratio:
| 80.0% |
Loan TypeThe type of loan (e.g., fixed, adjustable).
Loan type:
| Amortizing |
TermThe loan repayment period in years.
Term:
| 30 years |
Interest RateThe percentage a lender charges on the borrowed amount of a loan, determining the cost of borrowing money.
Interest rate:
| 6.810% |
Principal & Interest (PI)The principal is the portion of the loan payment that reduces the loan balance. The interest is the lender's charge for borrowing money. Calculation:(P * r * (1 + r) ** n) / ((1 + r) ** n - 1) Where:
P = Loan amount (principal)
Principal & interest:
| $3,654 |
Property TaxesAnnual taxes levied by local governments on real estate properties. These taxes fund public services like schools, roads, and emergency services. Calculation:Assumes 12% of gross rental income, unless public tax records are available.
Property tax:
| $355 |
InsuranceThe costs for insurance coverage to protect against financial losses due to risks like fire, natural disasters, theft, liability, or tenant-related damages. Calculation:Assumes 7% of gross rental income, unless insurance rates are specified.
Insurance:
| $224 |
Private Mortgage Insurance (PMI)A fee that borrowers pay when they take out a conventional loan with a loan-to-value (LTV) ratio above 80%.
Private mortgage insurance (PMI):
| $0 |
Monthly PaymentThe fixed amount a borrower pays each month to repay a loan. It typically includes principal and interest (P&I) and may also cover property taxes, insurance, HOA fees, and PMI if escrowed. Monthly payment:
| $4,233 |
Operating Income
| % Rent | Monthly | Yearly | |
|---|---|---|---|
Gross RentThe total rental income received from tenants before deducting any expenses. Includes base rent, late fees, pet fees, parking fees, and other recurring charges.
Gross rent:
| $3,200 | $38,400 | |
Vacancy LossExpected loss of rent due to vacancies.
Vacancy loss:
(6%)
| 6% | -$192 | -$2,304 |
Operating IncomeGross rental income minus vacancy loss. Calculation:Gross rent - Vacancy loss
Operating income:
| $3,008 | $36,096 |
Operating Expenses
| % Rent | Monthly | Yearly | |
|---|---|---|---|
Property TaxesAnnual taxes levied by local governments on real estate properties. These taxes fund public services like schools, roads, and emergency services. Calculation:Assumes 12% of gross rental income, unless public tax records are available. | 11% | -$355 | -$4,257 |
InsuranceThe costs for insurance coverage to protect against financial losses due to risks like fire, natural disasters, theft, liability, or tenant-related damages. Calculation:Assumes 7% of gross rental income, unless insurance rates are specified. | 7% | -$224 | -$2,688 |
Property ManagementThe costs associated with hiring a property manager to handle the day-to-day operations of a rental property. Includes management fees, leasing fes, eviction fees, etc. Calculation:Assumes 8% of gross rental income. | 8% | -$256 | -$3,072 |
Repairs & MaintenanceOngoing costs for routine upkeep and minor fixes needed to keep a property in good working condition. Calculation:Assumes 5% of gross rental income. Varies by property age and condition. | 5% | -$160 | -$1,920 |
Capital ExpensesLarge, infrequent costs for major improvements or replacements, like a new roof, HVAC system, or appliances. Calculation:Assumes 5% of gross rental income. Varies by property age. | 5% | -$160 | -$1,920 |
HOA FeesRegular dues paid to a Homeowners Association for community maintenance, amenities, and management. Similar fees include: Condo Association Fees, Co-op Maintenance Fees, etc. Calculation:Assumes 0% gross rental income, unless specified.. | 0% | $0 | $0 |
Operating ExpensesRecurring costs required to maintain and manage a rental property, including property taxes, insurance, maintenance, repairs, utilities (if paid by the owner), property management fees, and other day-to-day expenses. Calculation:Insurance + Property Taxes + Property Management + Repairs & Maintenance + Capital Expenditures + HOA Fees | 36% | -$1,155 | -$13,857 |
Cash Flow
| Monthly | Yearly | |
|---|---|---|
Net Operating Income (NOI)The income generated from a property after deducting all operating expenses but before deducting mortgage payments, taxes, and capital expenditures. Calculation:Gross Operating Income - Operating Expenses
Net operating income:
| $1,853 | $22,236 |
Mortgage PaymentThe fixed amount a borrower pays each month to repay a loan. It typically includes principal and interest (P&I) and may also cover property taxes, insurance, HOA fees, and PMI if escrowed. | -$3,654 | -$43,848 |
Cash FlowNet Operating Income (NOI) minus mortgage payments. Calculation:NOI - Mortgage Payments | $1,801 | $21,612 |