
$949,000
Investment Summary
- Monthly Cash Flow
- -$1,774
- Cap Rate
- 3.4%
- Cash-on-Cash Return
- -9.8%
- Debt Coverage Ratio
- 0.60
- Internal Rate of Return (5 years)
- -5.4%
Cash Flow
Net Operating Income (NOI) minus mortgage payments.
Calculation:
NOI - Mortgage Payments
Cap Rate (Market Value)
Capitalization Rate is a rate of return that compares the yearly Net Operating Income (NOI) to the market value.
Calculation:
NOI / Market Value
Cash-on-Cash Return (CoC)
Annual Cash Flow / Cash Invested
Calculation:
Annual cash flow divided by initial cash invested.
Debt Coverage Ratio (DCR)
Net Operating Income (NOI) divided by total debt payments.
Calculation:
NOI / Total Debt Payments
Internal Rate of Return (IRR)
A metric for assessing profitability over time. IRR is the discount rate at which the net present value (NPV) of all future cash flows (positive and negative) from an investment equals zero — including both periodic cash flow (such as rent) and a projected sale at the end of the holding period. It represents the expected annualized return, accounting for income, expenses, and the recovery of capital through a future sale.
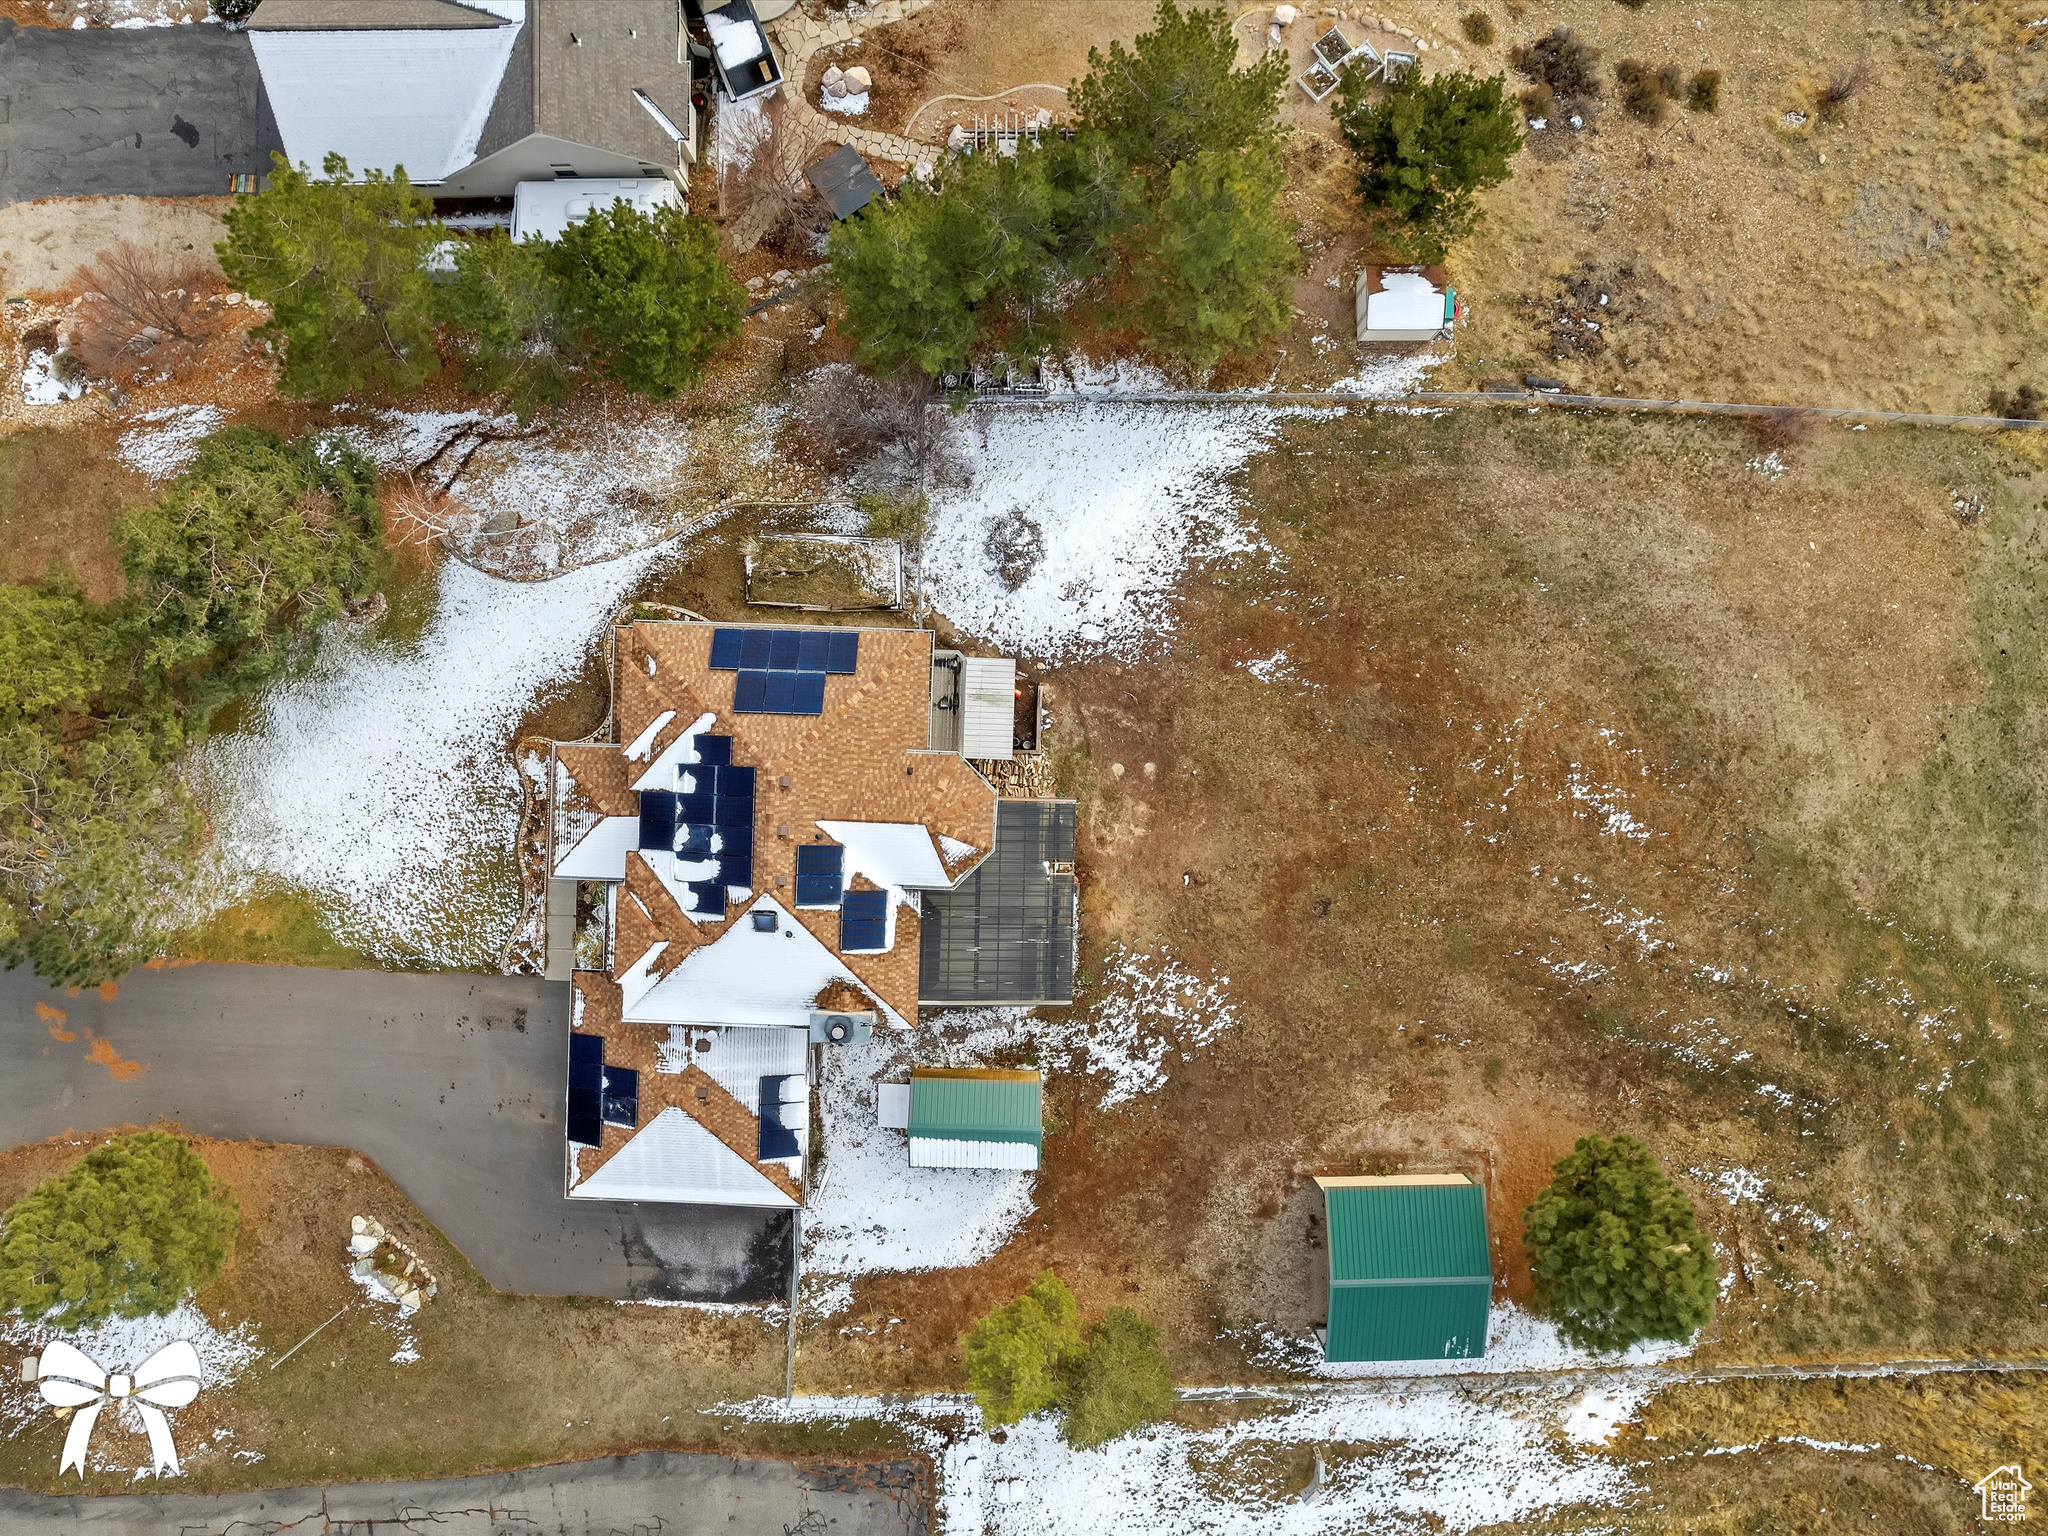
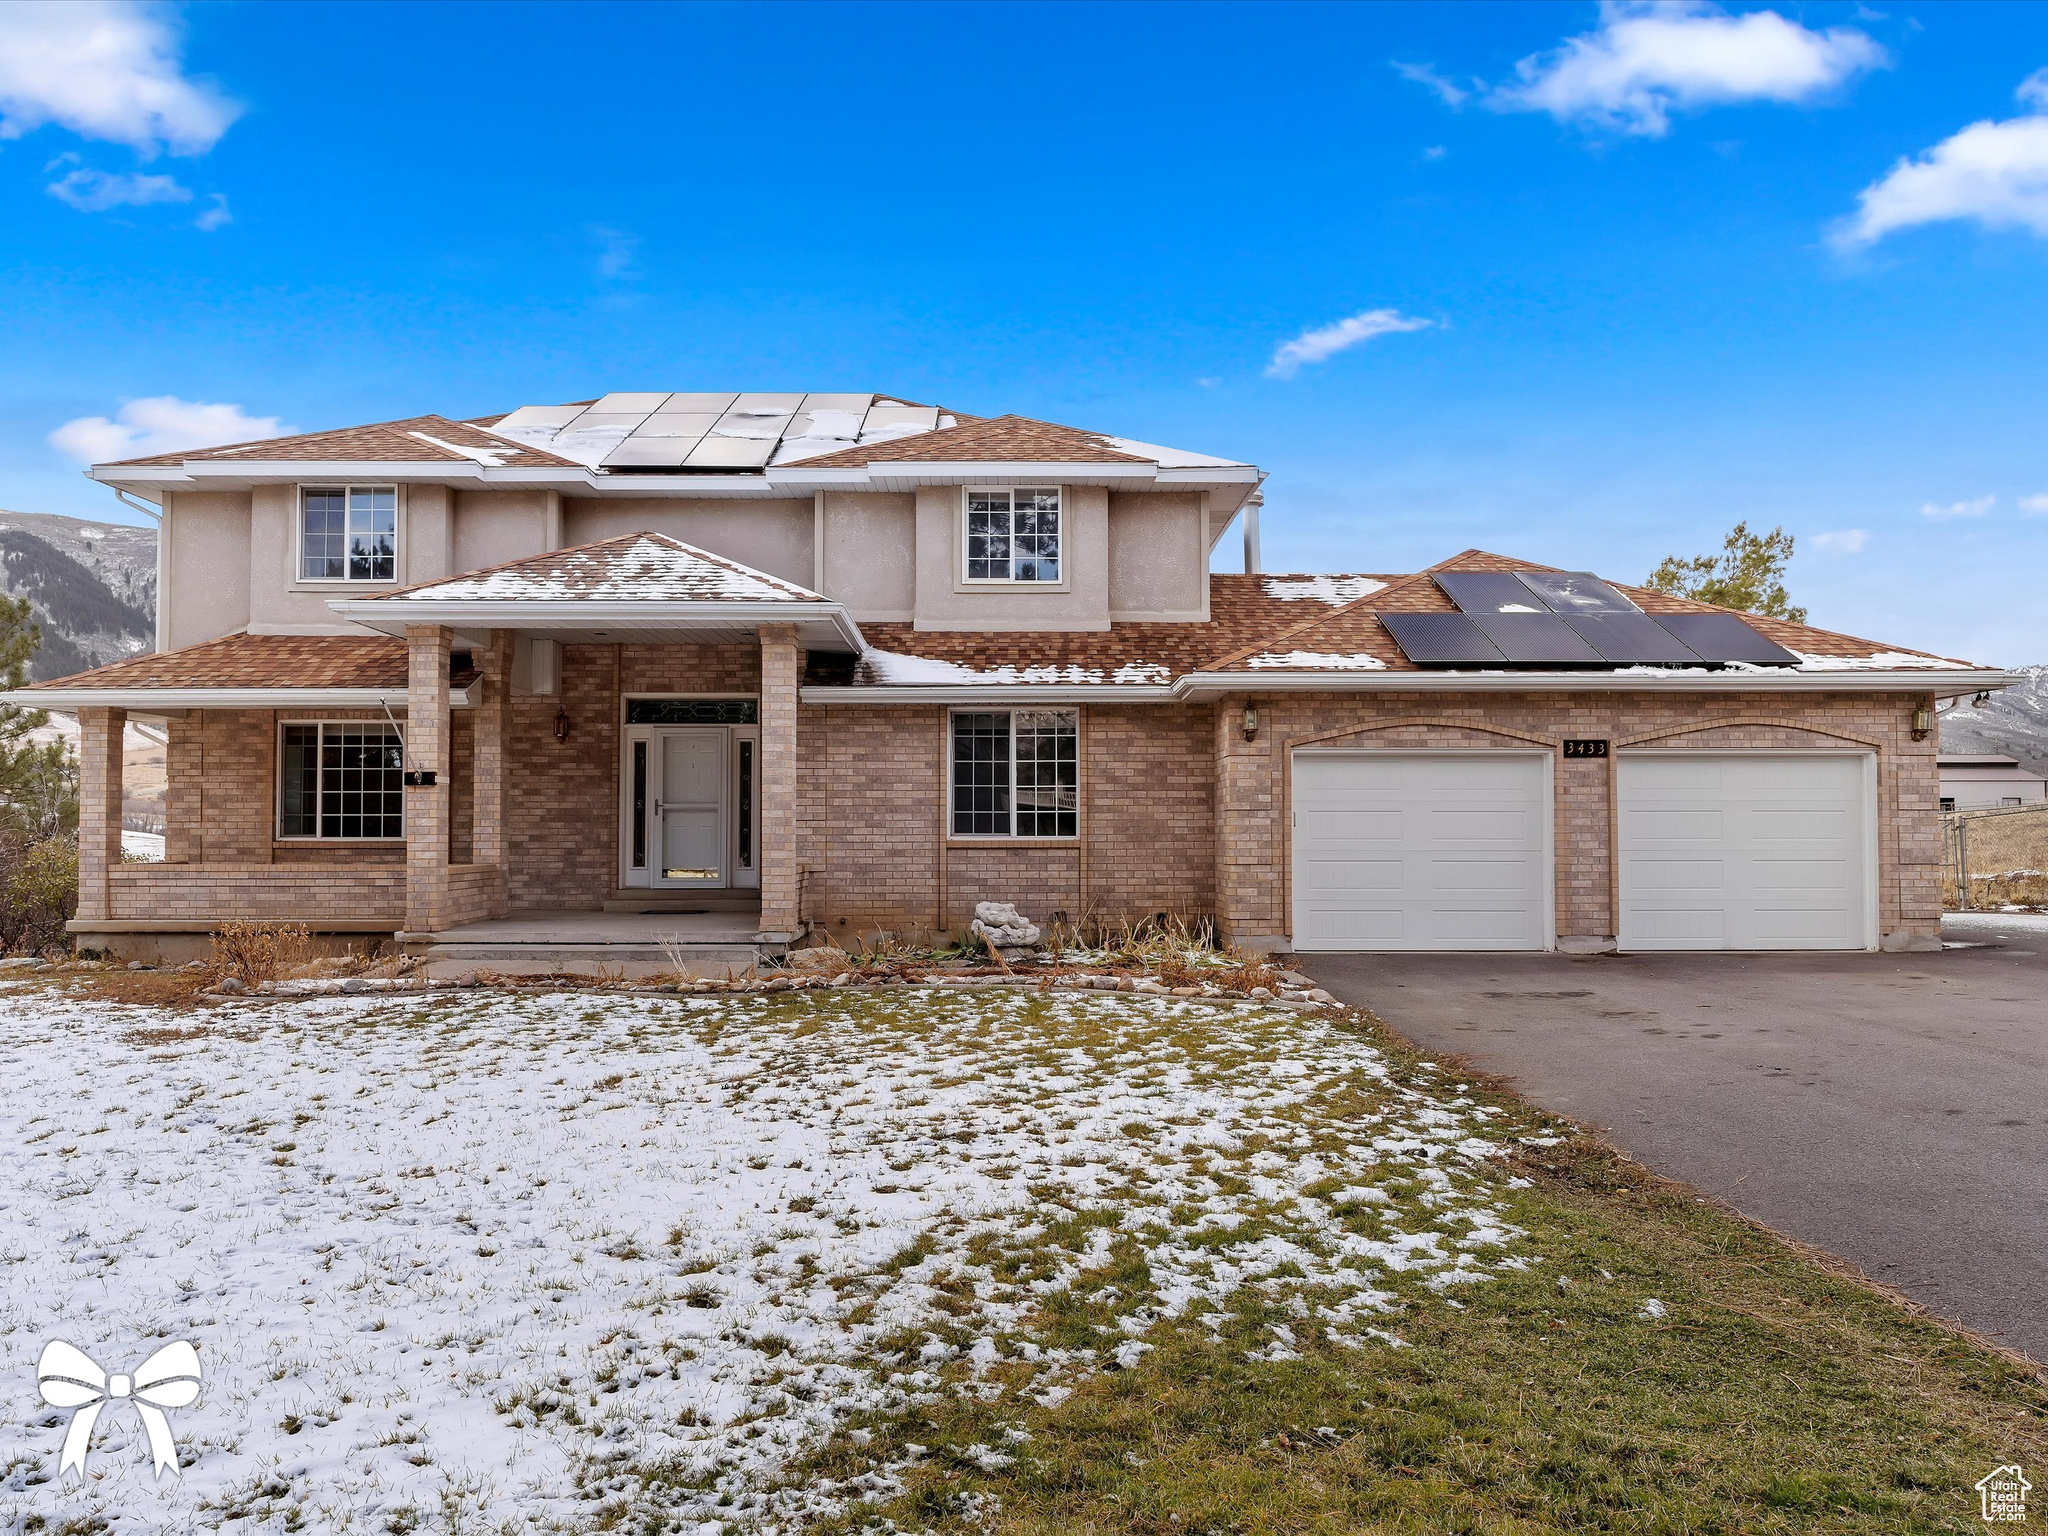
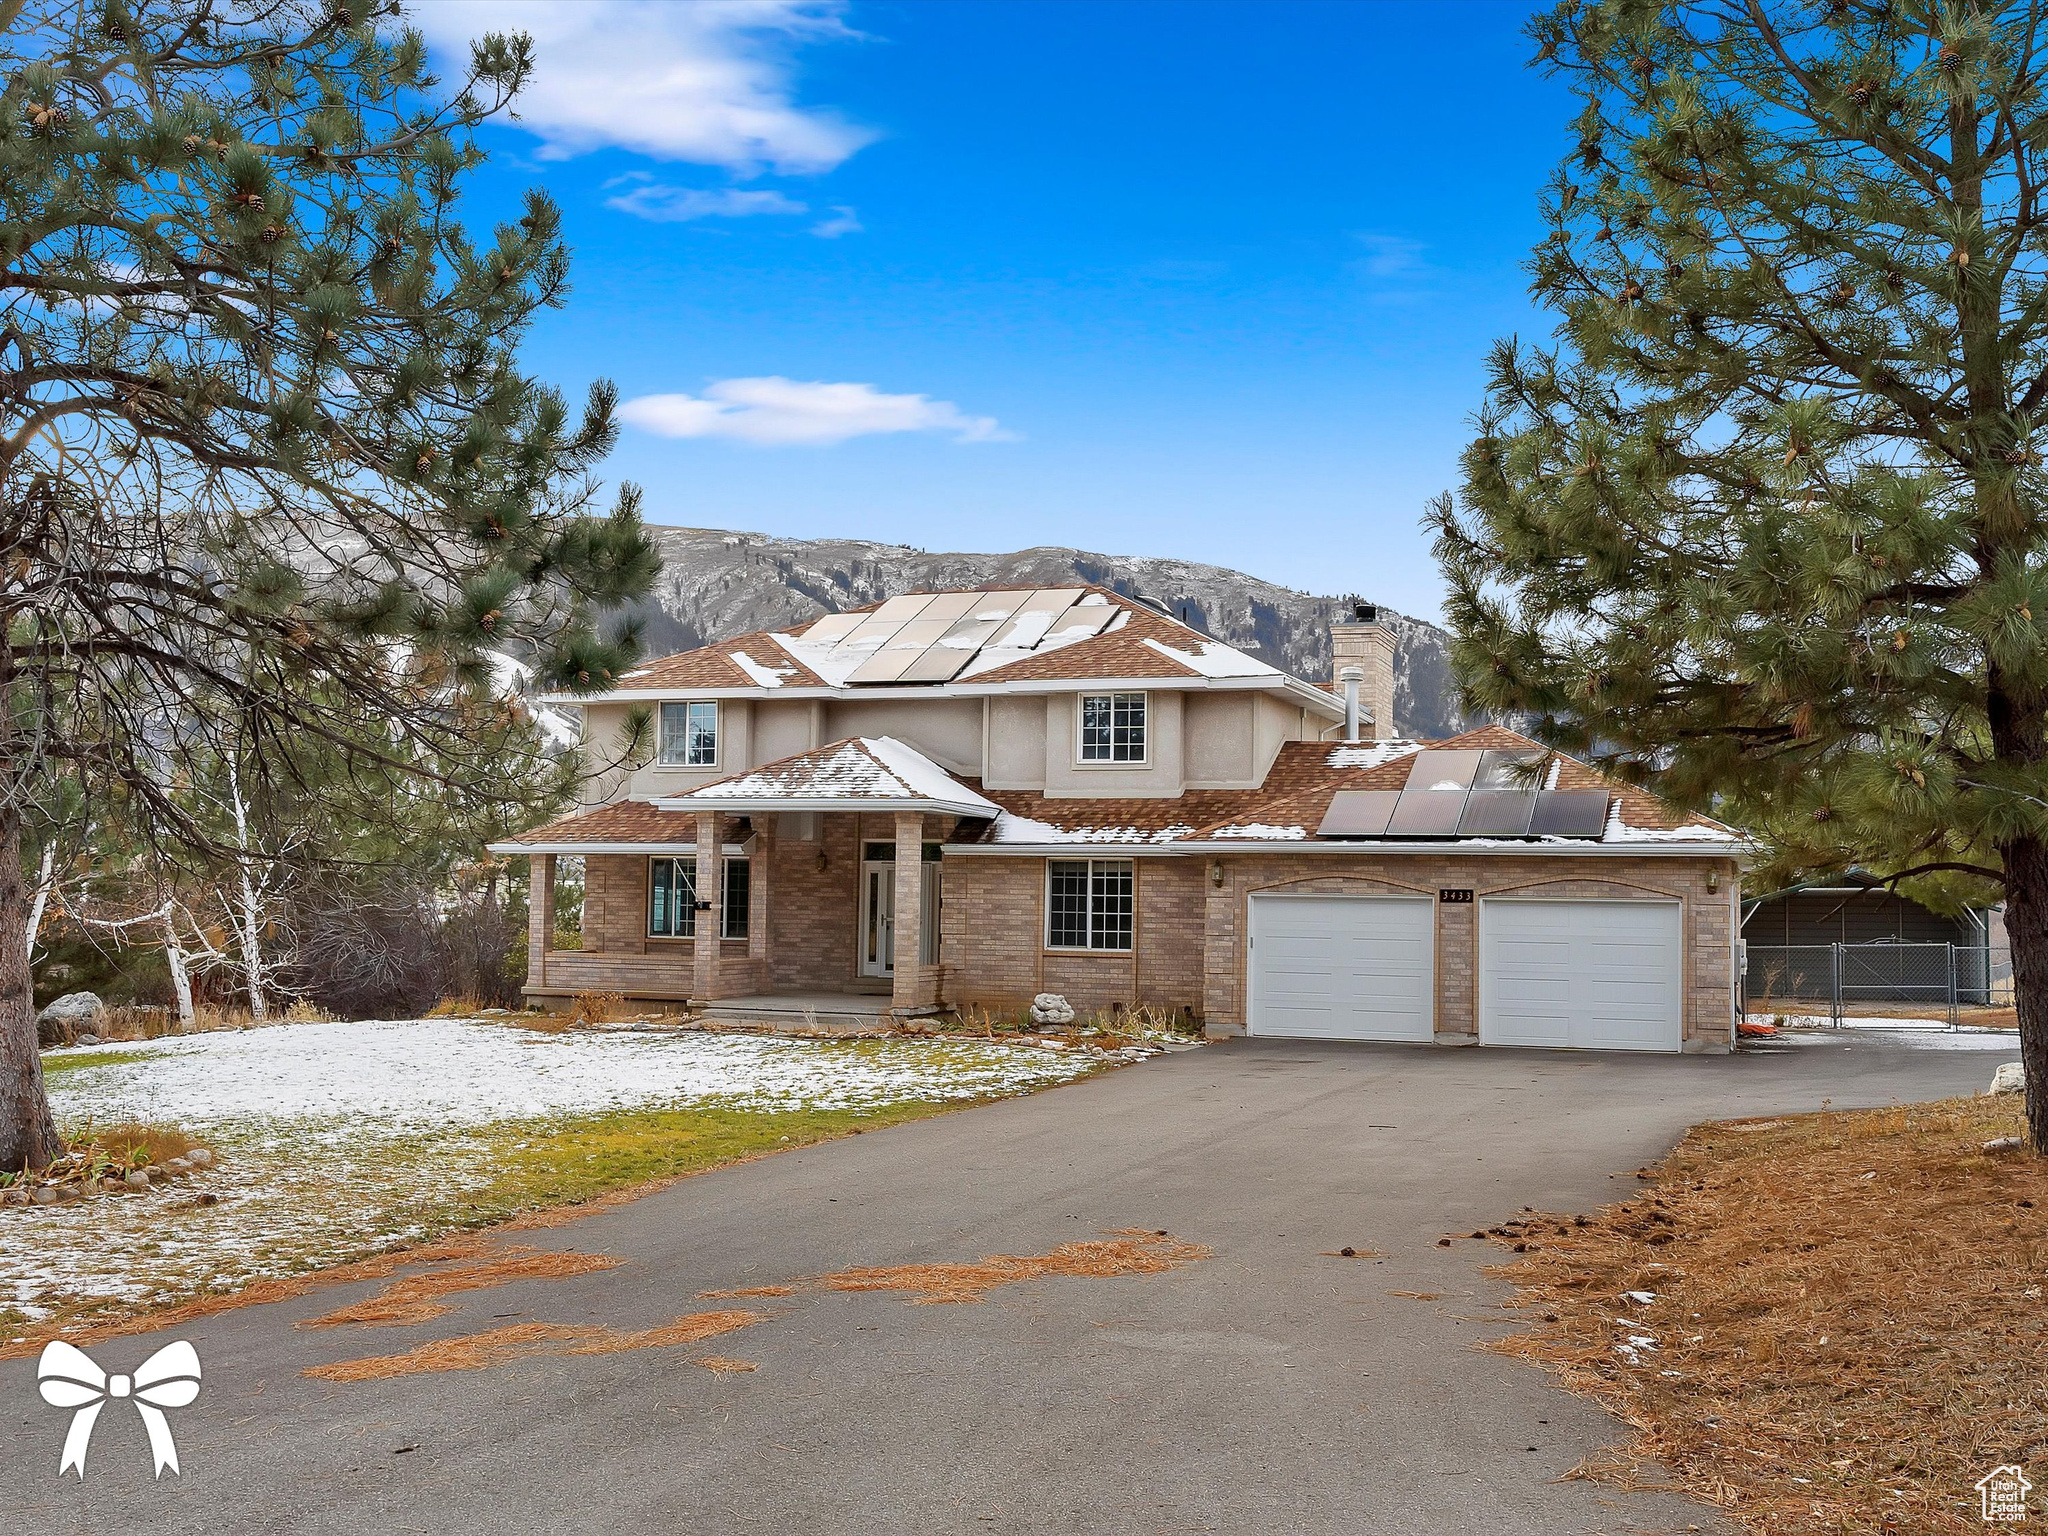
Property Description
Unlock the Potential of Your Mountain Retreat in Eden, Utah. Discover an exceptional opportunity to own a spacious 4-bedroom, 3-bathroom home in the heart of serene Ogden Valley. This residence offers over 4,200 square feet of living space on more than of a acre, with boundless potential to transform it into your perfect mountain sanctuary. Step inside and experience a versatile floor plan that blends functionality with charm, ideal for everyday living and entertaining. Highlights include a formal living, formal dining room, and a spacious great room that seamlessly connects to the kitchen. This cozy area, complete with a fireplace, makes it the perfect spot to unwind after a day of outdoor adventures. Radiant heated floors and two water heaters provide year-round comfort. The kitchen is ready to meet all your culinary needs, offering stainless steel appliances, ample cabinetry, and generous counter space. Multiple dining options include a casual kitchen nook, a formal dining room, and easy access to the patio for outdoor meals. The expansive master suite on the second floor offers incredible potential to become your ultimate retreat. With French doors leading to a private balcony, a walk-in closet, and stunning sunset views, it's a space primed for personalization. The ensuite bathroom features a jetted tub, a separate shower, dual sinks, and the opportunity to create a luxurious spa-like experience. Two additional bedrooms upstairs-one with a walk-in closet and direct bathroom access-provide comfort and convenience. On the main floor, an additional bedroom offers flexible use as a guest room, home office, or hobby space. The laundry room and half bathroom add practicality to the layout. The walkout basement, plumbed for a bathroom, is an exciting blank slate for future expansion-whether as a recreation room, extra bedrooms, or a home gym. Outside, the fully fenced backyard is a canvas for your imagination. With a large patio, lush grassy space, and panoramic mountain and valley views, it's ideal for hosting gatherings or simply enjoying the tranquil setting. A 10x12 outbuilding in the back with insulation and power and an RV pad adjacent to the oversized garage add convenience for the hobbyist or adventure enthusiasts. This home is perfectly situated to embrace Ogden Valley's renowned outdoor lifestyle. From world-class skiing at Snowbasin and Powder Mountain to boating on Pineview Reservoir, fishing, golfing, hiking, and biking, you're never far from your next adventure. While secluded and peaceful, the property is just a short drive to the Wasatch Front's shopping, dining, and entertainment options. Don't miss this chance to create your dream retreat in one of Utah's most sought-after locations. Call today for a private tour and imagine the endless possibilities of making this your ultimate mountain escape! All property information, boundaries, and documents are to be verified by Buyer.
Build Your Team
Quickly find investor-friendly professionals who can help you succeed in real estate investing at any stage of the investing journey.


Agents
Match with investor-friendly agents who can help you find, analyze, and close your next deal


Lenders
Get the best funding…find investor-friendly lenders who specialize in your deal strategy


Property Managers
Transition to passive investing. Find a trusted property management partnership that lasts.


Tax Pros & Accountants
Taxes and financial reporting made easy—find experts to create tax savings strategies, file taxes, and more
Location
Property Details
Parking
- Description: Parking: Uncovered, Rv Parking
- Details: RV Access/Parking, Attached
- Garage Spaces: 2
- Spaces Total: 2
Bedroom Information
- # of Bedrooms: 4
Bathroom Information
- # of Baths (Full): 2
- # of Baths (Partial): 1
- # of Baths (Total): 3.0
Interior Features
- # of Rooms: 15
- # of Stories: 3
- Basement: Yes
- Basement Description: Full, Walk-Out Access
- Fireplace: Yes
Exterior Features
- Exterior Walls Materials: Brick Veneer
- Roof Material: Asphalt
- Solar Panels: Yes
Land Information
- Land Use: Residential
- Land Use Subtype: Single Family Residential
Lot Information
- Parcel ID: 220730001
- Lot Size: 34848 sqft
Property Information
- Property Type: Single Family Residence
- Style: Stories: 2
- Year Built: 1990
Tax Information
- Annual Tax: $4,661
Utilities
- Heating: Radiant Floor, Radiant
- Cooling: Ceiling Fan(s), None
Location
- County: Weber
Listing Details
Investment Summary
- Monthly Cash Flow
- -$1,774
- Cap Rate
- 3.4%
- Cash-on-Cash Return
- -9.8%
- Debt Coverage Ratio
- 0.60
- Internal Rate of Return (5 years)
- -5.4%
Cash Flow
Net Operating Income (NOI) minus mortgage payments.
Calculation:
NOI - Mortgage Payments
Cap Rate (Market Value)
Capitalization Rate is a rate of return that compares the yearly Net Operating Income (NOI) to the market value.
Calculation:
NOI / Market Value
Cash-on-Cash Return (CoC)
Annual Cash Flow / Cash Invested
Calculation:
Annual cash flow divided by initial cash invested.
Debt Coverage Ratio (DCR)
Net Operating Income (NOI) divided by total debt payments.
Calculation:
NOI / Total Debt Payments
Internal Rate of Return (IRR)
A metric for assessing profitability over time. IRR is the discount rate at which the net present value (NPV) of all future cash flows (positive and negative) from an investment equals zero — including both periodic cash flow (such as rent) and a projected sale at the end of the holding period. It represents the expected annualized return, accounting for income, expenses, and the recovery of capital through a future sale.
Purchase Details
Purchase PriceThe price paid for the property. Purchase price:
| $949,000 |
|---|---|
Amount FinancedThe amount of the purchase financed through a loan. Amount financed:
| -$759,200 |
Down paymentThe initial payment made towards the purchase. Down payment:
| $189,800 |
Closing CostsFees and expenses associated with purchasing a property, typically ranging from 2% to 5% of the home’s purchase price, paid at the end of a home purchase to cover services like lending, title transfer, and taxes. Closing costs:
| $28,470 |
Rehab CostsCosts incurred to repair or improve the property, including: roof, flooring, exterior siding, kitchen, exterior paint, bathrooms, etc. Rehab costs:
| $0 |
Initial Cash InvestedThe total initial cash invested in the property. Calculation:Down payment + Buying costs + Rehab costs Initial cash invested:
| $218,270 |
Square Feet (SQFT)The total square footage of the property. Square feet:
| 4,324 |
Cost Per Square FootCost per square foot of the property. Calculation:Purchase Price / Square Feet Cost per square foot:
| $219 |
Monthly Rent Per Square FootMonthly rent divided by the number of square feet. This ratio helps investors compare rental income efficiency across properties, markets, and unit sizes Calculation:Monthly Rent / Square Feet Monthly rent per square foot:
| $1.04 |
Financing Details
Loan AmountThe total sum of money borrowed from a lender to finance a property purchase. Calculation:Purchase Price - Down Payment
Loan amount:
| $759,200 |
|---|---|
Loan to Value Ratio (LTV)Loan amount divided by the market value of the property. Calculation:Loan Amount / Market Value
Loan to value ratio:
| 80.0% |
Loan TypeThe type of loan (e.g., fixed, adjustable).
Loan type:
| Amortizing |
TermThe loan repayment period in years.
Term:
| 30 years |
Interest RateThe percentage a lender charges on the borrowed amount of a loan, determining the cost of borrowing money.
Interest rate:
| 5.875% |
Principal & Interest (PI)The principal is the portion of the loan payment that reduces the loan balance. The interest is the lender's charge for borrowing money. Calculation:(P * r * (1 + r) ** n) / ((1 + r) ** n - 1) Where:
P = Loan amount (principal)
Principal & interest:
| $4,491 |
Property TaxesAnnual taxes levied by local governments on real estate properties. These taxes fund public services like schools, roads, and emergency services. Calculation:Assumes 12% of gross rental income, unless public tax records are available.
Property tax:
| $388 |
InsuranceThe costs for insurance coverage to protect against financial losses due to risks like fire, natural disasters, theft, liability, or tenant-related damages. Calculation:Assumes 7% of gross rental income, unless insurance rates are specified.
Insurance:
| $315 |
Private Mortgage Insurance (PMI)A fee that borrowers pay when they take out a conventional loan with a loan-to-value (LTV) ratio above 80%.
Private mortgage insurance (PMI):
| $0 |
Monthly PaymentThe fixed amount a borrower pays each month to repay a loan. It typically includes principal and interest (P&I) and may also cover property taxes, insurance, HOA fees, and PMI if escrowed. Monthly payment:
| $5,194 |
Operating Income
| % Rent | Monthly | Yearly | |
|---|---|---|---|
Gross RentThe total rental income received from tenants before deducting any expenses. Includes base rent, late fees, pet fees, parking fees, and other recurring charges.
Gross rent:
| $4,500 | $54,000 | |
Vacancy LossExpected loss of rent due to vacancies.
Vacancy loss:
(6%)
| 6% | -$270 | -$3,240 |
Operating IncomeGross rental income minus vacancy loss. Calculation:Gross rent - Vacancy loss
Operating income:
| $4,230 | $50,760 |
Operating Expenses
| % Rent | Monthly | Yearly | |
|---|---|---|---|
Property TaxesAnnual taxes levied by local governments on real estate properties. These taxes fund public services like schools, roads, and emergency services. Calculation:Assumes 12% of gross rental income, unless public tax records are available. | 9% | -$388 | -$4,661 |
InsuranceThe costs for insurance coverage to protect against financial losses due to risks like fire, natural disasters, theft, liability, or tenant-related damages. Calculation:Assumes 7% of gross rental income, unless insurance rates are specified. | 7% | -$315 | -$3,780 |
Property ManagementThe costs associated with hiring a property manager to handle the day-to-day operations of a rental property. Includes management fees, leasing fes, eviction fees, etc. Calculation:Assumes 8% of gross rental income. | 8% | -$360 | -$4,320 |
Repairs & MaintenanceOngoing costs for routine upkeep and minor fixes needed to keep a property in good working condition. Calculation:Assumes 5% of gross rental income. Varies by property age and condition. | 5% | -$225 | -$2,700 |
Capital ExpensesLarge, infrequent costs for major improvements or replacements, like a new roof, HVAC system, or appliances. Calculation:Assumes 5% of gross rental income. Varies by property age. | 5% | -$225 | -$2,700 |
HOA FeesRegular dues paid to a Homeowners Association for community maintenance, amenities, and management. Similar fees include: Condo Association Fees, Co-op Maintenance Fees, etc. Calculation:Assumes 0% gross rental income, unless specified.. | 0% | $0 | $0 |
Operating ExpensesRecurring costs required to maintain and manage a rental property, including property taxes, insurance, maintenance, repairs, utilities (if paid by the owner), property management fees, and other day-to-day expenses. Calculation:Insurance + Property Taxes + Property Management + Repairs & Maintenance + Capital Expenditures + HOA Fees | 34% | -$1,513 | -$18,161 |
Cash Flow
| Monthly | Yearly | |
|---|---|---|
Net Operating Income (NOI)The income generated from a property after deducting all operating expenses but before deducting mortgage payments, taxes, and capital expenditures. Calculation:Gross Operating Income - Operating Expenses
Net operating income:
| $2,717 | $32,604 |
Mortgage PaymentThe fixed amount a borrower pays each month to repay a loan. It typically includes principal and interest (P&I) and may also cover property taxes, insurance, HOA fees, and PMI if escrowed. | -$4,491 | -$53,892 |
Cash FlowNet Operating Income (NOI) minus mortgage payments. Calculation:NOI - Mortgage Payments | $1,774 | $21,288 |