$749,900
Investment Summary
- Monthly Cash Flow
- -$2,088
- Cap Rate
- 2.3%
- Cash-on-Cash Return
- -14.5%
- Debt Coverage Ratio
- 0.41
- Internal Rate of Return (5 years)
- -10.1%
Cash Flow
Net Operating Income (NOI) minus mortgage payments.
Calculation:
NOI - Mortgage Payments
Cap Rate (Market Value)
Capitalization Rate is a rate of return that compares the yearly Net Operating Income (NOI) to the market value.
Calculation:
NOI / Market Value
Cash-on-Cash Return (CoC)
Annual Cash Flow / Cash Invested
Calculation:
Annual cash flow divided by initial cash invested.
Debt Coverage Ratio (DCR)
Net Operating Income (NOI) divided by total debt payments.
Calculation:
NOI / Total Debt Payments
Internal Rate of Return (IRR)
A metric for assessing profitability over time. IRR is the discount rate at which the net present value (NPV) of all future cash flows (positive and negative) from an investment equals zero — including both periodic cash flow (such as rent) and a projected sale at the end of the holding period. It represents the expected annualized return, accounting for income, expenses, and the recovery of capital through a future sale.
Property Description
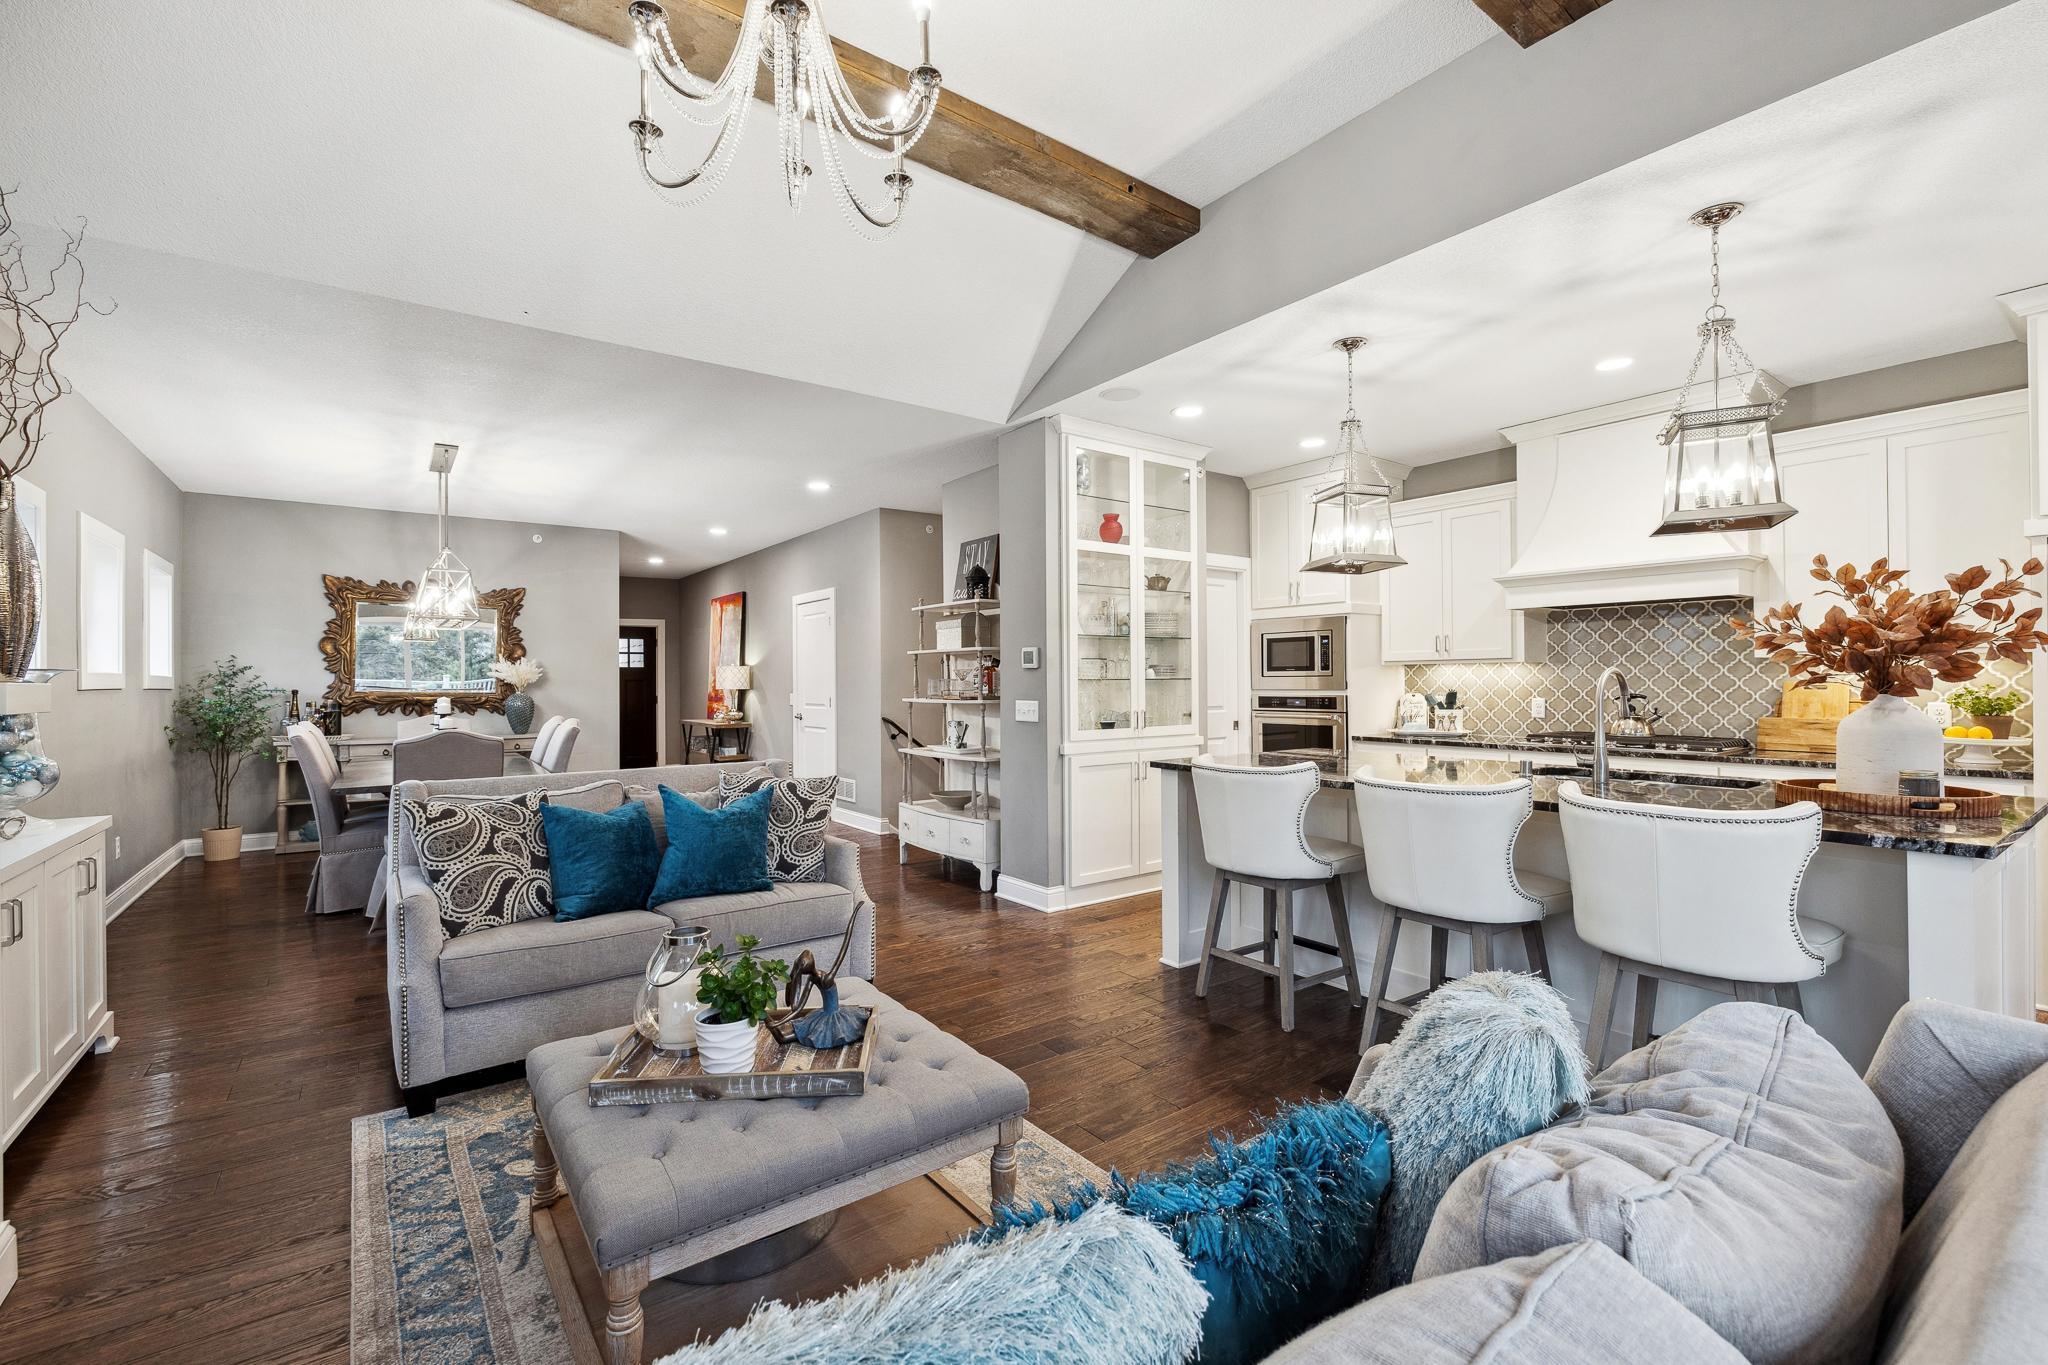
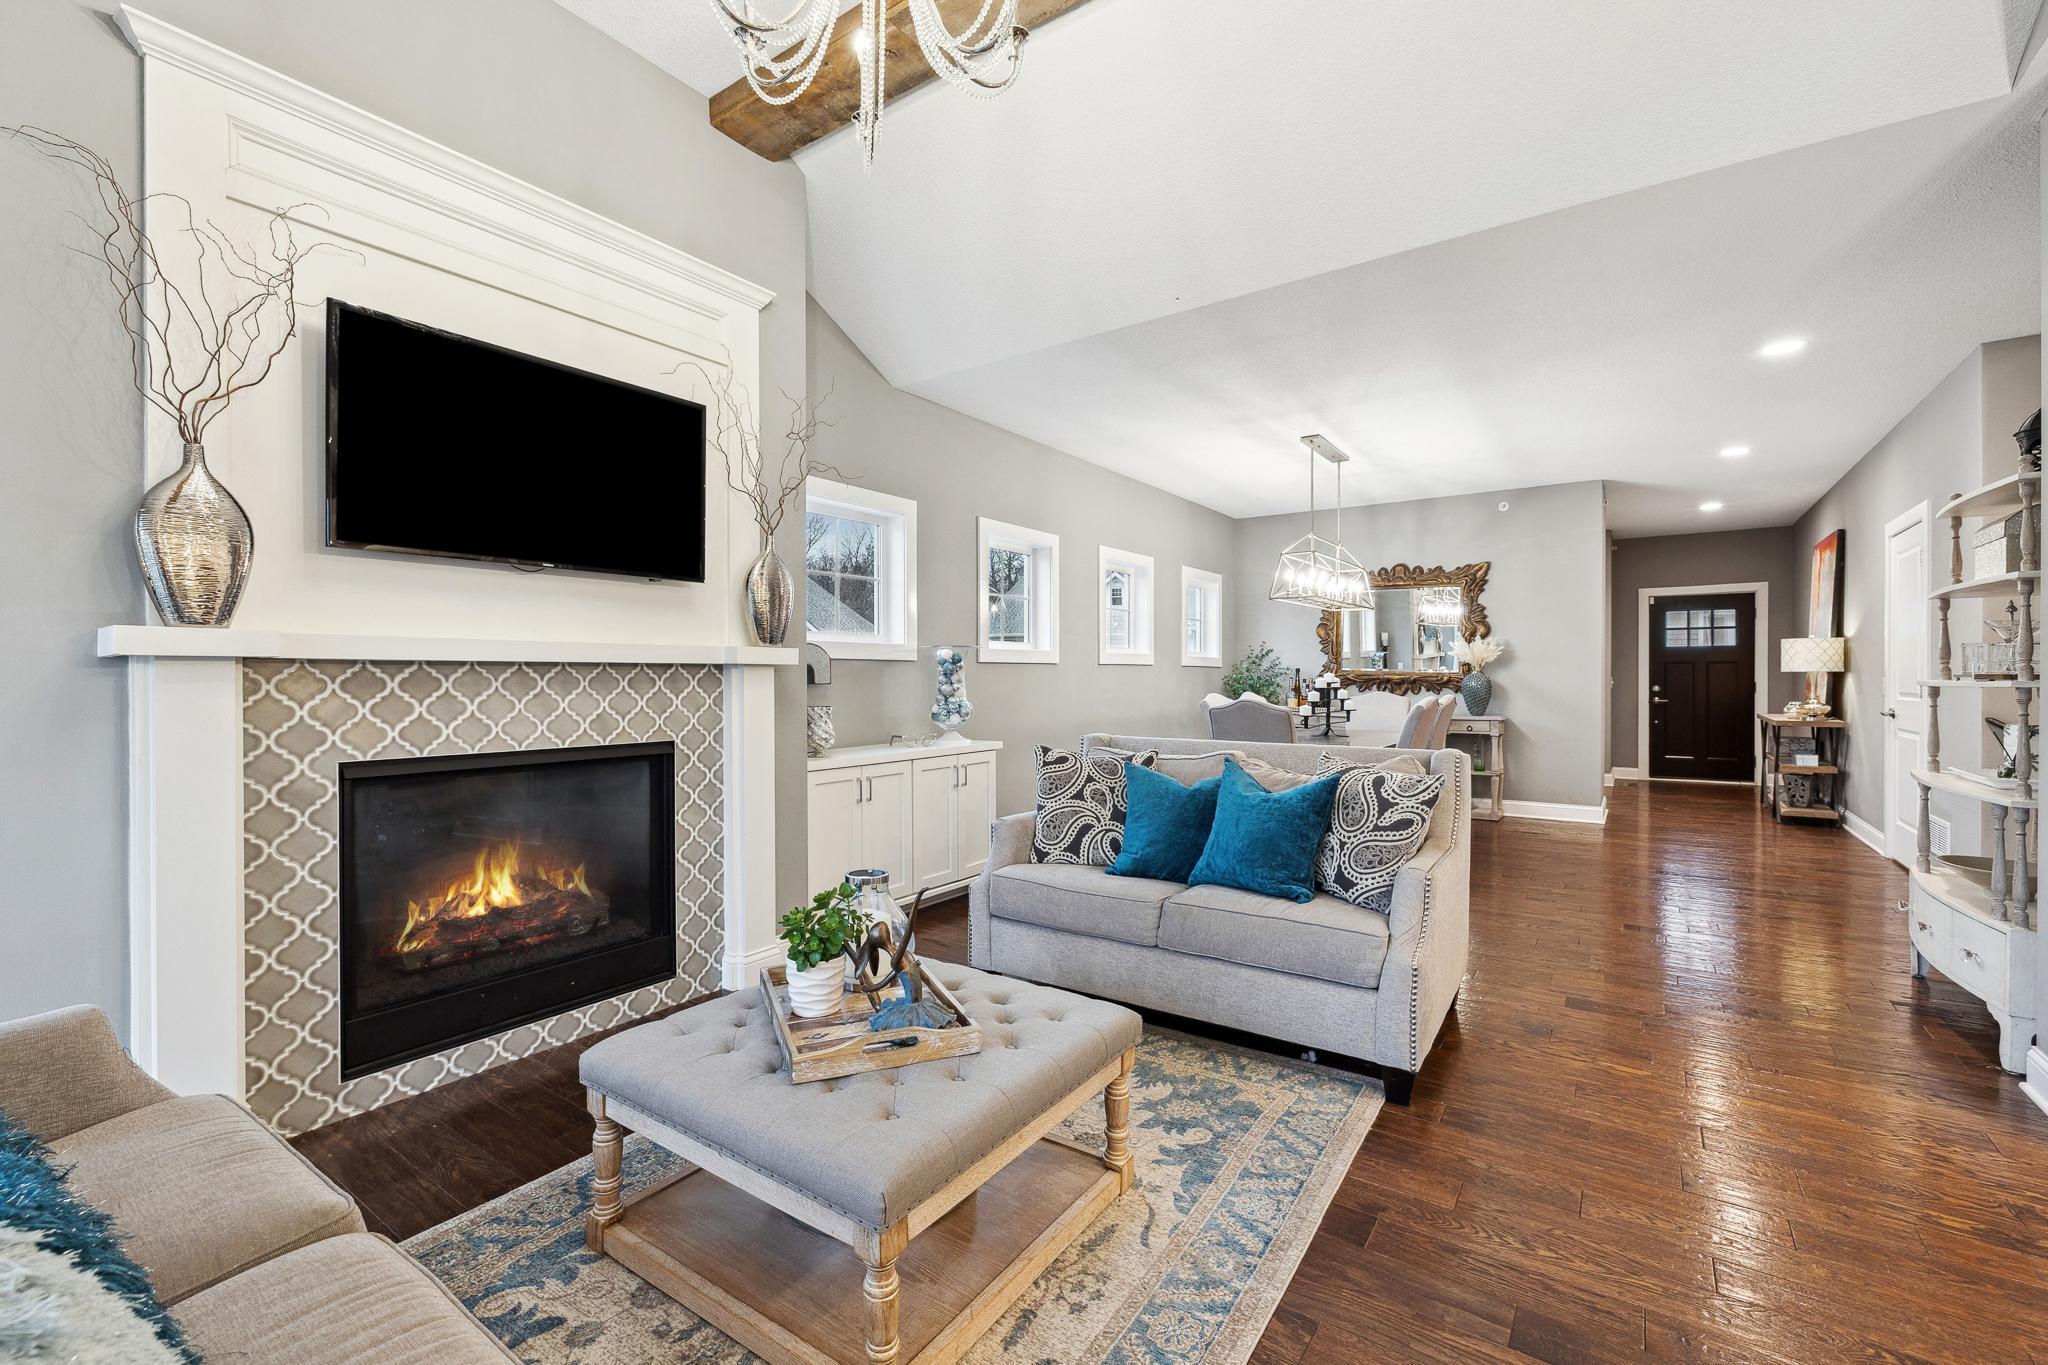
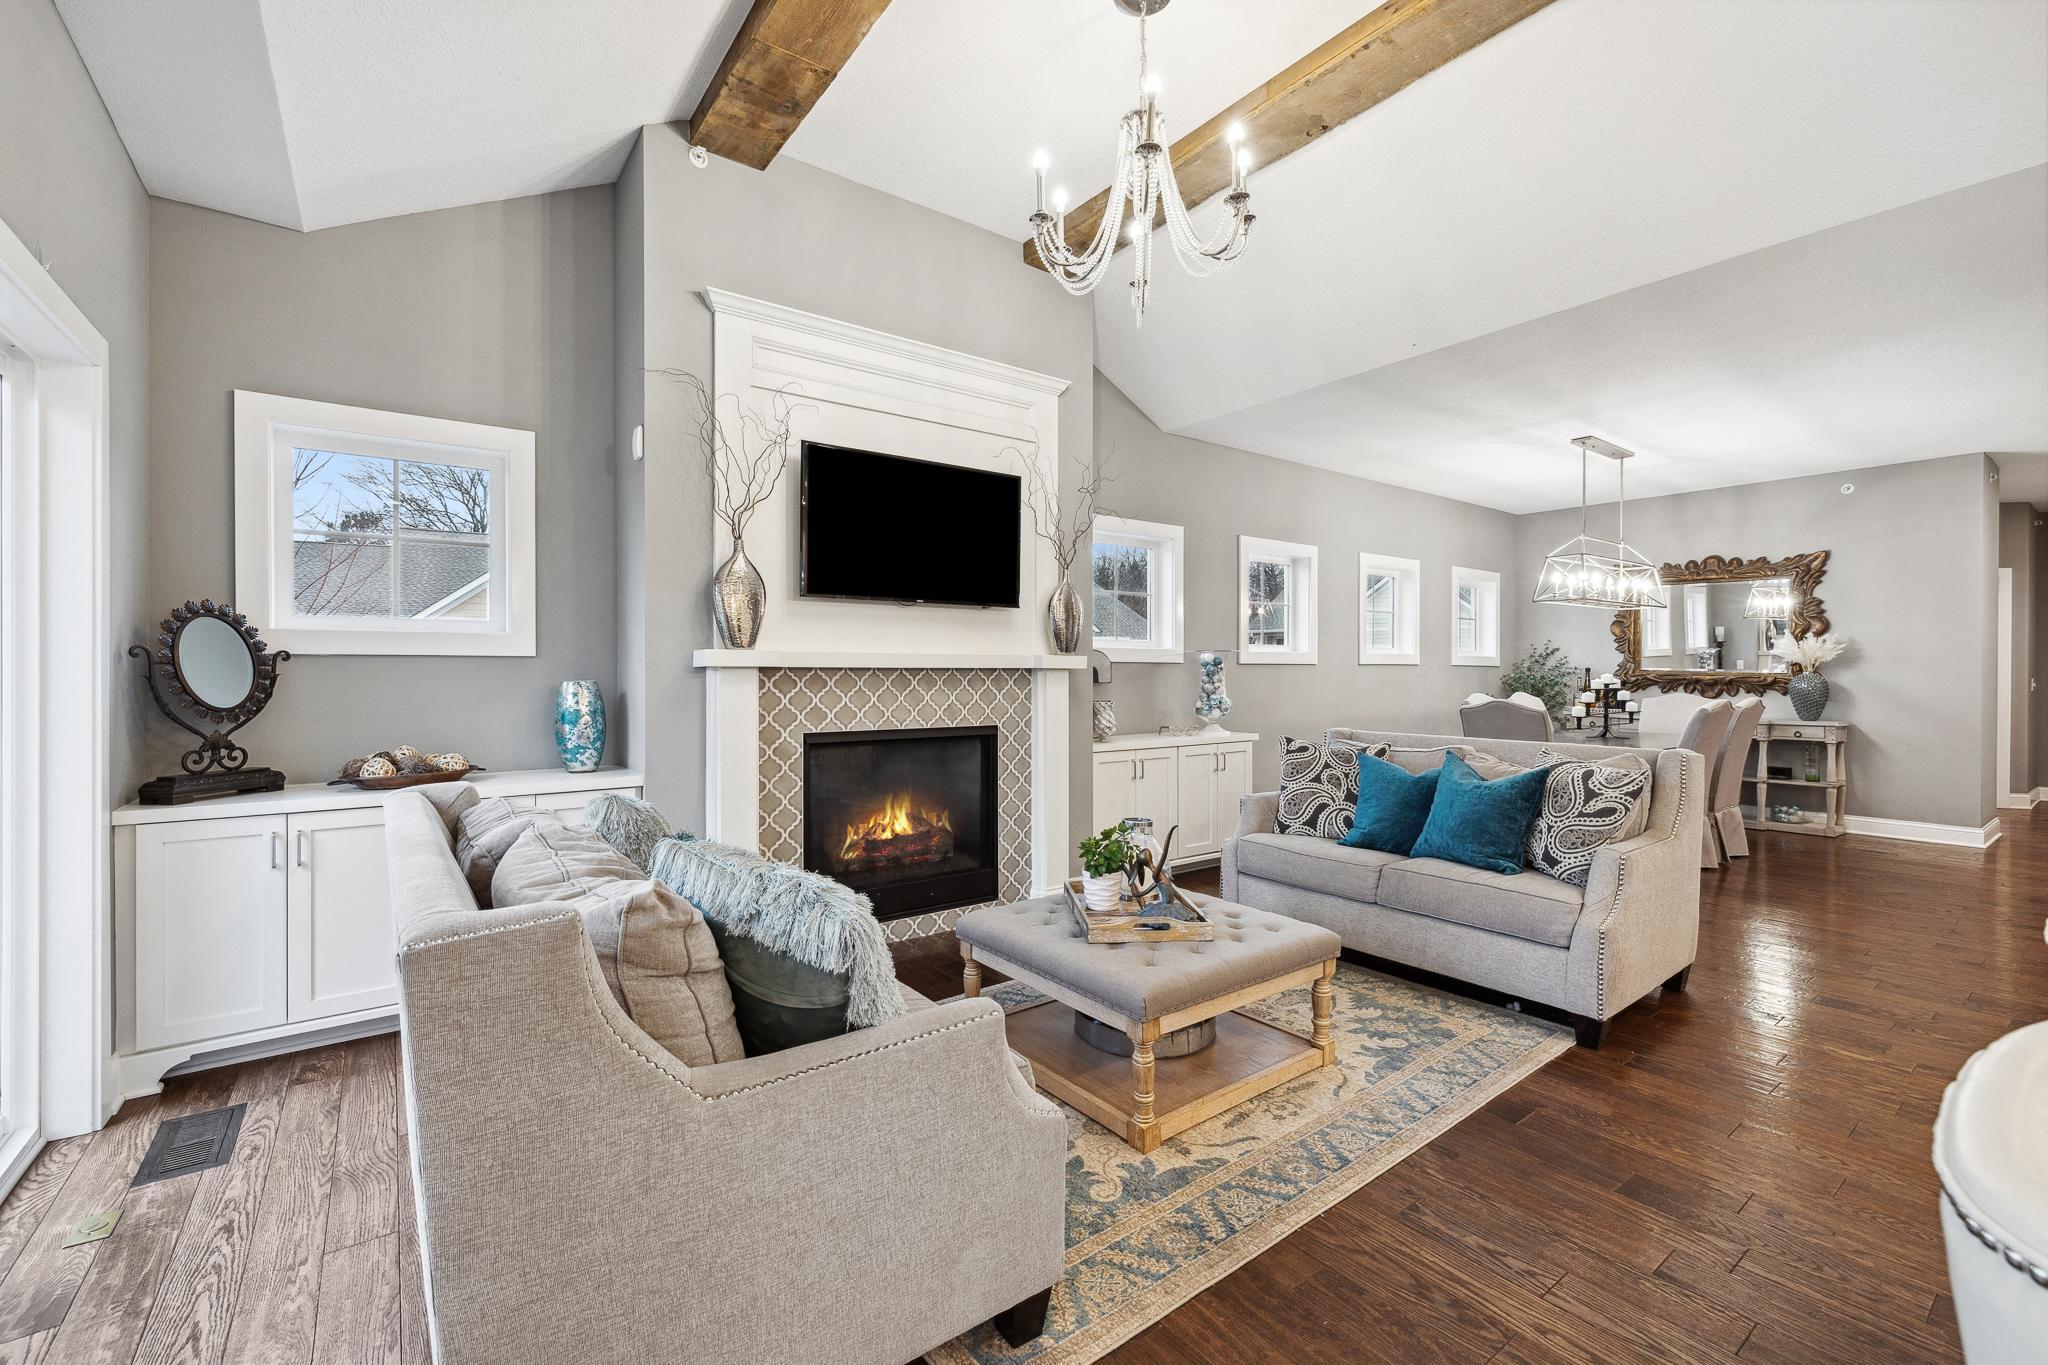
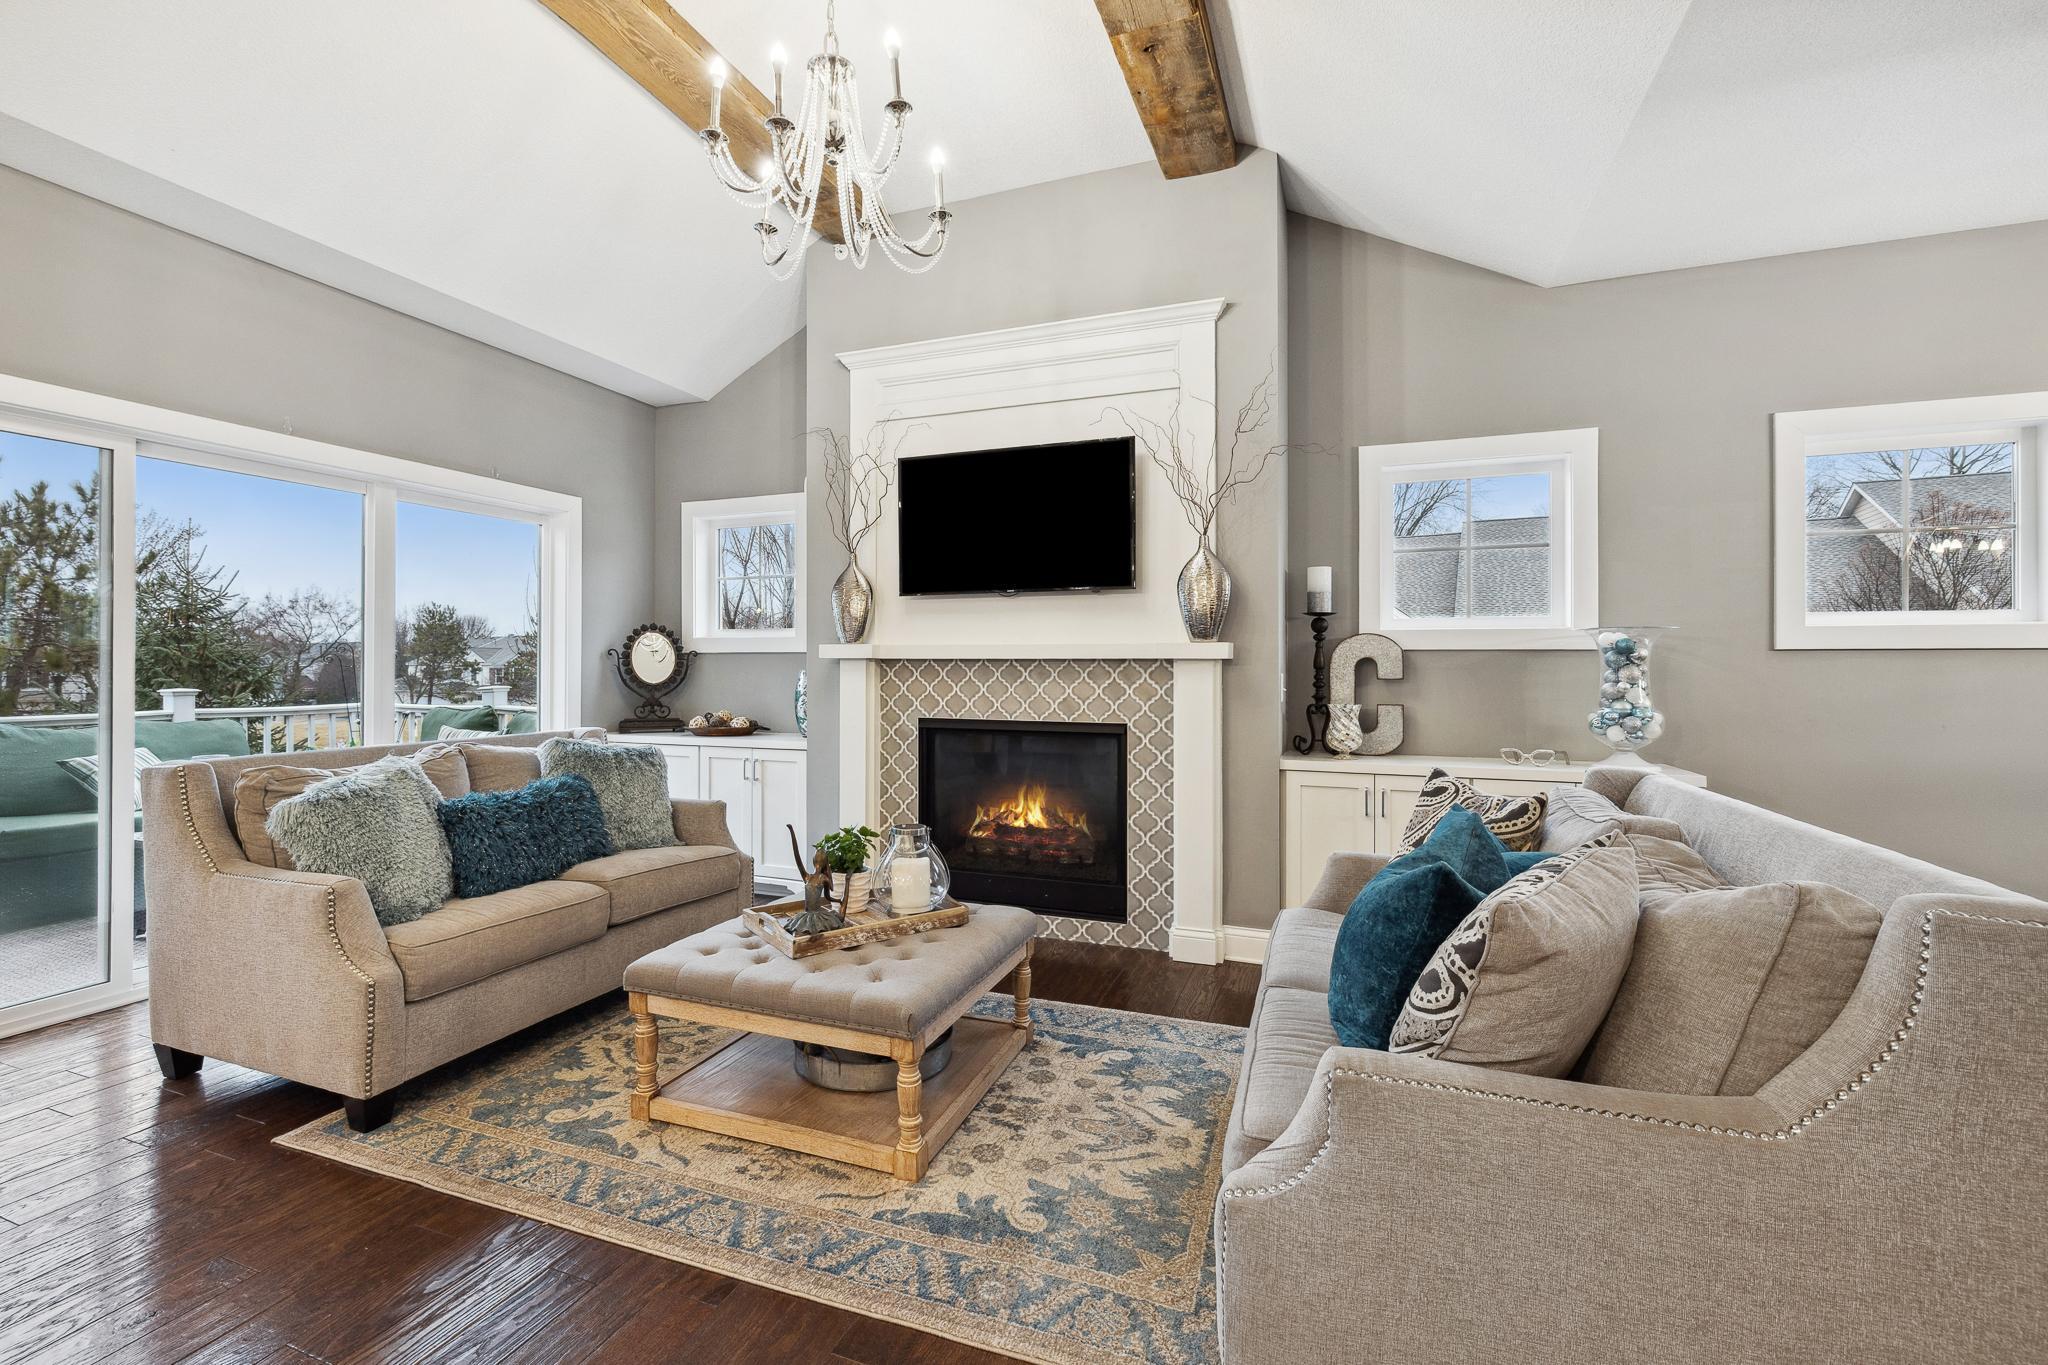
Introducing a showstopper in executive living! Built in 2017 by custom builder, this twin home offers almost 3000 sf, 1,450+ square feet more than its counterparts. New-construction allure—without the million-dollar price tag!! Discover an executive home that redefines its community. This luxury end-unit townhome stands apart as a true masterpiece of modern design and timeless craftsmanship. Freshly painted and move-in ready, it’s perfectly positioned on a sunlit, south-facing corner lot where expansive windows bathe every room in natural light, creating an inviting, light, and airy atmosphere. This home’s breathtaking interior blends high-end finishes with sophisticated details. The gourmet kitchen is the heart of the home, featuring exquisite quartz countertops, a massive island, enameled cabinetry with custom built-ins, wide-plank hardwood floors,—all designed to inspire culinary creativity and effortless entertaining. The fabulous fireplace, and ceiling barnwood beams, accentuated by stunning light fixtures throughout, set a showstopping ambiance that elevates every room. Retreat to the expansive main floor primary suite, complete with more barnwood beams, new plush carpeting, a huge walk-in closet, and a luxurious full bath showcasing a separate soaking tub, a glass-enclosed shower, and in-floor heat for ultimate comfort. Custom touches continue seamlessly, with a fully stone-stacked wall, refined craftsman details including molded trim, wooden benches, French doors, quartz and granite throughout. The lower level is an entertainer’s dream. Enjoy a lively atmosphere at the full bar—equipped with a sink, full-size refrigerator, large island seating four, built-in floating shelves, and a wine rack—ideal for hosting social gatherings. Two additional bedrooms with walk-in closets, full bath, a family room, media room, and an exercise room provide ample space for relaxation and recreation. Completing this exceptional home, the seller is including a suite of premium extras—three mounted flat-screen SMART TVs, an elliptical machine, and an integrated security system with motion sensors and lower-level glass breakage sensors—ensuring comprehensive peace of mind. A state-of-the-art sound system graces both levels, while a built-in gas line on the deck and a fire suppression system throughout add to the convenience and safety, making outdoor entertaining a delight. Embrace an unparalleled outdoor and lake living lifestyle with the MN Arboretum, Lake Minnewashta, and Lake Ann just a quarter-mile away, offering beaches, park areas, walking paths, and dog parks. With a short three-minute drive to Excelsior and Victoria’s vibrant farmers markets, boutique shops, and exceptional dining options, this home truly has it all. Don't miss this rare opportunity!
Build Your Team
Quickly find investor-friendly professionals who can help you succeed in real estate investing at any stage of the investing journey.


Agents
Match with investor-friendly agents who can help you find, analyze, and close your next deal


Lenders
Get the best funding…find investor-friendly lenders who specialize in your deal strategy


Property Managers
Transition to passive investing. Find a trusted property management partnership that lasts.


Tax Pros & Accountants
Taxes and financial reporting made easy—find experts to create tax savings strategies, file taxes, and more
Location
Property Details
Parking
- Description: Attached Garage, Concrete
- Details: Concrete
- Garage Spaces: 2
- Spaces Total: 0
Bedroom Information
- # of Bedrooms: 3
Bathroom Information
- # of Baths (Full): 2
- # of Baths (Partial): 1
- # of Baths (Total): 3.0
Interior Features
- # of Rooms: 13
- Basement: Yes
- Basement Description: Finished, Concrete, Sump Pump
- Fireplace: Yes
HOA
- Has HOA: Yes
- Association: Highlands at Bluff Creek
- HOA Fee: $450/monthly
Land Information
- Land Use: Residential
- Land Use Subtype: Single Family Residential (Assumed)
Lot Information
- Parcel ID: 253540161
- Lot Size: 3920 sqft
Property Information
- Property Type: Townhouse
- Style: (TH) Side x Side
- Year Built: 2017
Tax Information
- Annual Tax: $6,870
Utilities
- Heating: Forced Air
Location
- County: Carver
Listing Details
Investment Summary
- Monthly Cash Flow
- -$2,088
- Cap Rate
- 2.3%
- Cash-on-Cash Return
- -14.5%
- Debt Coverage Ratio
- 0.41
- Internal Rate of Return (5 years)
- -10.1%
Cash Flow
Net Operating Income (NOI) minus mortgage payments.
Calculation:
NOI - Mortgage Payments
Cap Rate (Market Value)
Capitalization Rate is a rate of return that compares the yearly Net Operating Income (NOI) to the market value.
Calculation:
NOI / Market Value
Cash-on-Cash Return (CoC)
Annual Cash Flow / Cash Invested
Calculation:
Annual cash flow divided by initial cash invested.
Debt Coverage Ratio (DCR)
Net Operating Income (NOI) divided by total debt payments.
Calculation:
NOI / Total Debt Payments
Internal Rate of Return (IRR)
A metric for assessing profitability over time. IRR is the discount rate at which the net present value (NPV) of all future cash flows (positive and negative) from an investment equals zero — including both periodic cash flow (such as rent) and a projected sale at the end of the holding period. It represents the expected annualized return, accounting for income, expenses, and the recovery of capital through a future sale.
Purchase Details
Purchase PriceThe price paid for the property. Purchase price:
| $749,900 |
|---|---|
Amount FinancedThe amount of the purchase financed through a loan. Amount financed:
| -$599,920 |
Down paymentThe initial payment made towards the purchase. Down payment:
| $149,980 |
Closing CostsFees and expenses associated with purchasing a property, typically ranging from 2% to 5% of the home’s purchase price, paid at the end of a home purchase to cover services like lending, title transfer, and taxes. Closing costs:
| $22,497 |
Rehab CostsCosts incurred to repair or improve the property, including: roof, flooring, exterior siding, kitchen, exterior paint, bathrooms, etc. Rehab costs:
| $0 |
Initial Cash InvestedThe total initial cash invested in the property. Calculation:Down payment + Buying costs + Rehab costs Initial cash invested:
| $172,477 |
Square Feet (SQFT)The total square footage of the property. Square feet:
| 2,985 |
Cost Per Square FootCost per square foot of the property. Calculation:Purchase Price / Square Feet Cost per square foot:
| $251 |
Monthly Rent Per Square FootMonthly rent divided by the number of square feet. This ratio helps investors compare rental income efficiency across properties, markets, and unit sizes Calculation:Monthly Rent / Square Feet Monthly rent per square foot:
| $1.21 |
Financing Details
Loan AmountThe total sum of money borrowed from a lender to finance a property purchase. Calculation:Purchase Price - Down Payment
Loan amount:
| $599,920 |
|---|---|
Loan to Value Ratio (LTV)Loan amount divided by the market value of the property. Calculation:Loan Amount / Market Value
Loan to value ratio:
| 80.0% |
Loan TypeThe type of loan (e.g., fixed, adjustable).
Loan type:
| Amortizing |
TermThe loan repayment period in years.
Term:
| 30 years |
Interest RateThe percentage a lender charges on the borrowed amount of a loan, determining the cost of borrowing money.
Interest rate:
| 5.875% |
Principal & Interest (PI)The principal is the portion of the loan payment that reduces the loan balance. The interest is the lender's charge for borrowing money. Calculation:(P * r * (1 + r) ** n) / ((1 + r) ** n - 1) Where:
P = Loan amount (principal)
Principal & interest:
| $3,549 |
Property TaxesAnnual taxes levied by local governments on real estate properties. These taxes fund public services like schools, roads, and emergency services. Calculation:Assumes 12% of gross rental income, unless public tax records are available.
Property tax:
| $573 |
InsuranceThe costs for insurance coverage to protect against financial losses due to risks like fire, natural disasters, theft, liability, or tenant-related damages. Calculation:Assumes 7% of gross rental income, unless insurance rates are specified.
Insurance:
| $252 |
Private Mortgage Insurance (PMI)A fee that borrowers pay when they take out a conventional loan with a loan-to-value (LTV) ratio above 80%.
Private mortgage insurance (PMI):
| $0 |
Monthly PaymentThe fixed amount a borrower pays each month to repay a loan. It typically includes principal and interest (P&I) and may also cover property taxes, insurance, HOA fees, and PMI if escrowed. Monthly payment:
| $4,374 |
Operating Income
| % Rent | Monthly | Yearly | |
|---|---|---|---|
Gross RentThe total rental income received from tenants before deducting any expenses. Includes base rent, late fees, pet fees, parking fees, and other recurring charges.
Gross rent:
| $3,600 | $43,200 | |
Vacancy LossExpected loss of rent due to vacancies.
Vacancy loss:
(6%)
| 6% | -$216 | -$2,592 |
Operating IncomeGross rental income minus vacancy loss. Calculation:Gross rent - Vacancy loss
Operating income:
| $3,384 | $40,608 |
Operating Expenses
| % Rent | Monthly | Yearly | |
|---|---|---|---|
Property TaxesAnnual taxes levied by local governments on real estate properties. These taxes fund public services like schools, roads, and emergency services. Calculation:Assumes 12% of gross rental income, unless public tax records are available. | 16% | -$573 | -$6,870 |
InsuranceThe costs for insurance coverage to protect against financial losses due to risks like fire, natural disasters, theft, liability, or tenant-related damages. Calculation:Assumes 7% of gross rental income, unless insurance rates are specified. | 7% | -$252 | -$3,024 |
Property ManagementThe costs associated with hiring a property manager to handle the day-to-day operations of a rental property. Includes management fees, leasing fes, eviction fees, etc. Calculation:Assumes 8% of gross rental income. | 8% | -$288 | -$3,456 |
Repairs & MaintenanceOngoing costs for routine upkeep and minor fixes needed to keep a property in good working condition. Calculation:Assumes 5% of gross rental income. Varies by property age and condition. | 5% | -$180 | -$2,160 |
Capital ExpensesLarge, infrequent costs for major improvements or replacements, like a new roof, HVAC system, or appliances. Calculation:Assumes 5% of gross rental income. Varies by property age. | 5% | -$180 | -$2,160 |
HOA FeesRegular dues paid to a Homeowners Association for community maintenance, amenities, and management. Similar fees include: Condo Association Fees, Co-op Maintenance Fees, etc. Calculation:Assumes 0% gross rental income, unless specified.. | 13% | -$450 | -$5,400 |
Operating ExpensesRecurring costs required to maintain and manage a rental property, including property taxes, insurance, maintenance, repairs, utilities (if paid by the owner), property management fees, and other day-to-day expenses. Calculation:Insurance + Property Taxes + Property Management + Repairs & Maintenance + Capital Expenditures + HOA Fees | 53% | -$1,923 | -$23,070 |
Cash Flow
| Monthly | Yearly | |
|---|---|---|
Net Operating Income (NOI)The income generated from a property after deducting all operating expenses but before deducting mortgage payments, taxes, and capital expenditures. Calculation:Gross Operating Income - Operating Expenses
Net operating income:
| $1,461 | $17,532 |
Mortgage PaymentThe fixed amount a borrower pays each month to repay a loan. It typically includes principal and interest (P&I) and may also cover property taxes, insurance, HOA fees, and PMI if escrowed. | -$3,549 | -$42,588 |
Cash FlowNet Operating Income (NOI) minus mortgage payments. Calculation:NOI - Mortgage Payments | $2,088 | $25,056 |