$400,000
Investment Summary
- Monthly Cash Flow
- -$531
- Cap Rate
- 4.6%
- Cash-on-Cash Return
- -6.9%
- Debt Coverage Ratio
- 0.74
- Internal Rate of Return (5 years)
- -2.7%
Cash Flow
Net Operating Income (NOI) minus mortgage payments.
Calculation:
NOI - Mortgage Payments
Cap Rate (Market Value)
Capitalization Rate is a rate of return that compares the yearly Net Operating Income (NOI) to the market value.
Calculation:
NOI / Market Value
Cash-on-Cash Return (CoC)
Annual cash flow divided by initial cash invested.
Calculation:
Annual Cash Flow / Cash Invested
Debt Coverage Ratio (DCR)
Net Operating Income (NOI) divided by total debt payments.
Calculation:
NOI / Total Debt Payments
Internal Rate of Return (IRR)
A metric for assessing profitability over time. IRR is the discount rate at which the net present value (NPV) of all future cash flows (positive and negative) from an investment equals zero — including both periodic cash flow (such as rent) and a projected sale at the end of the holding period. It represents the expected annualized return, accounting for income, expenses, and the recovery of capital through a future sale.
Calculation:
(Future Value / Present Value) ** (1 / Years) - 1
Property Description
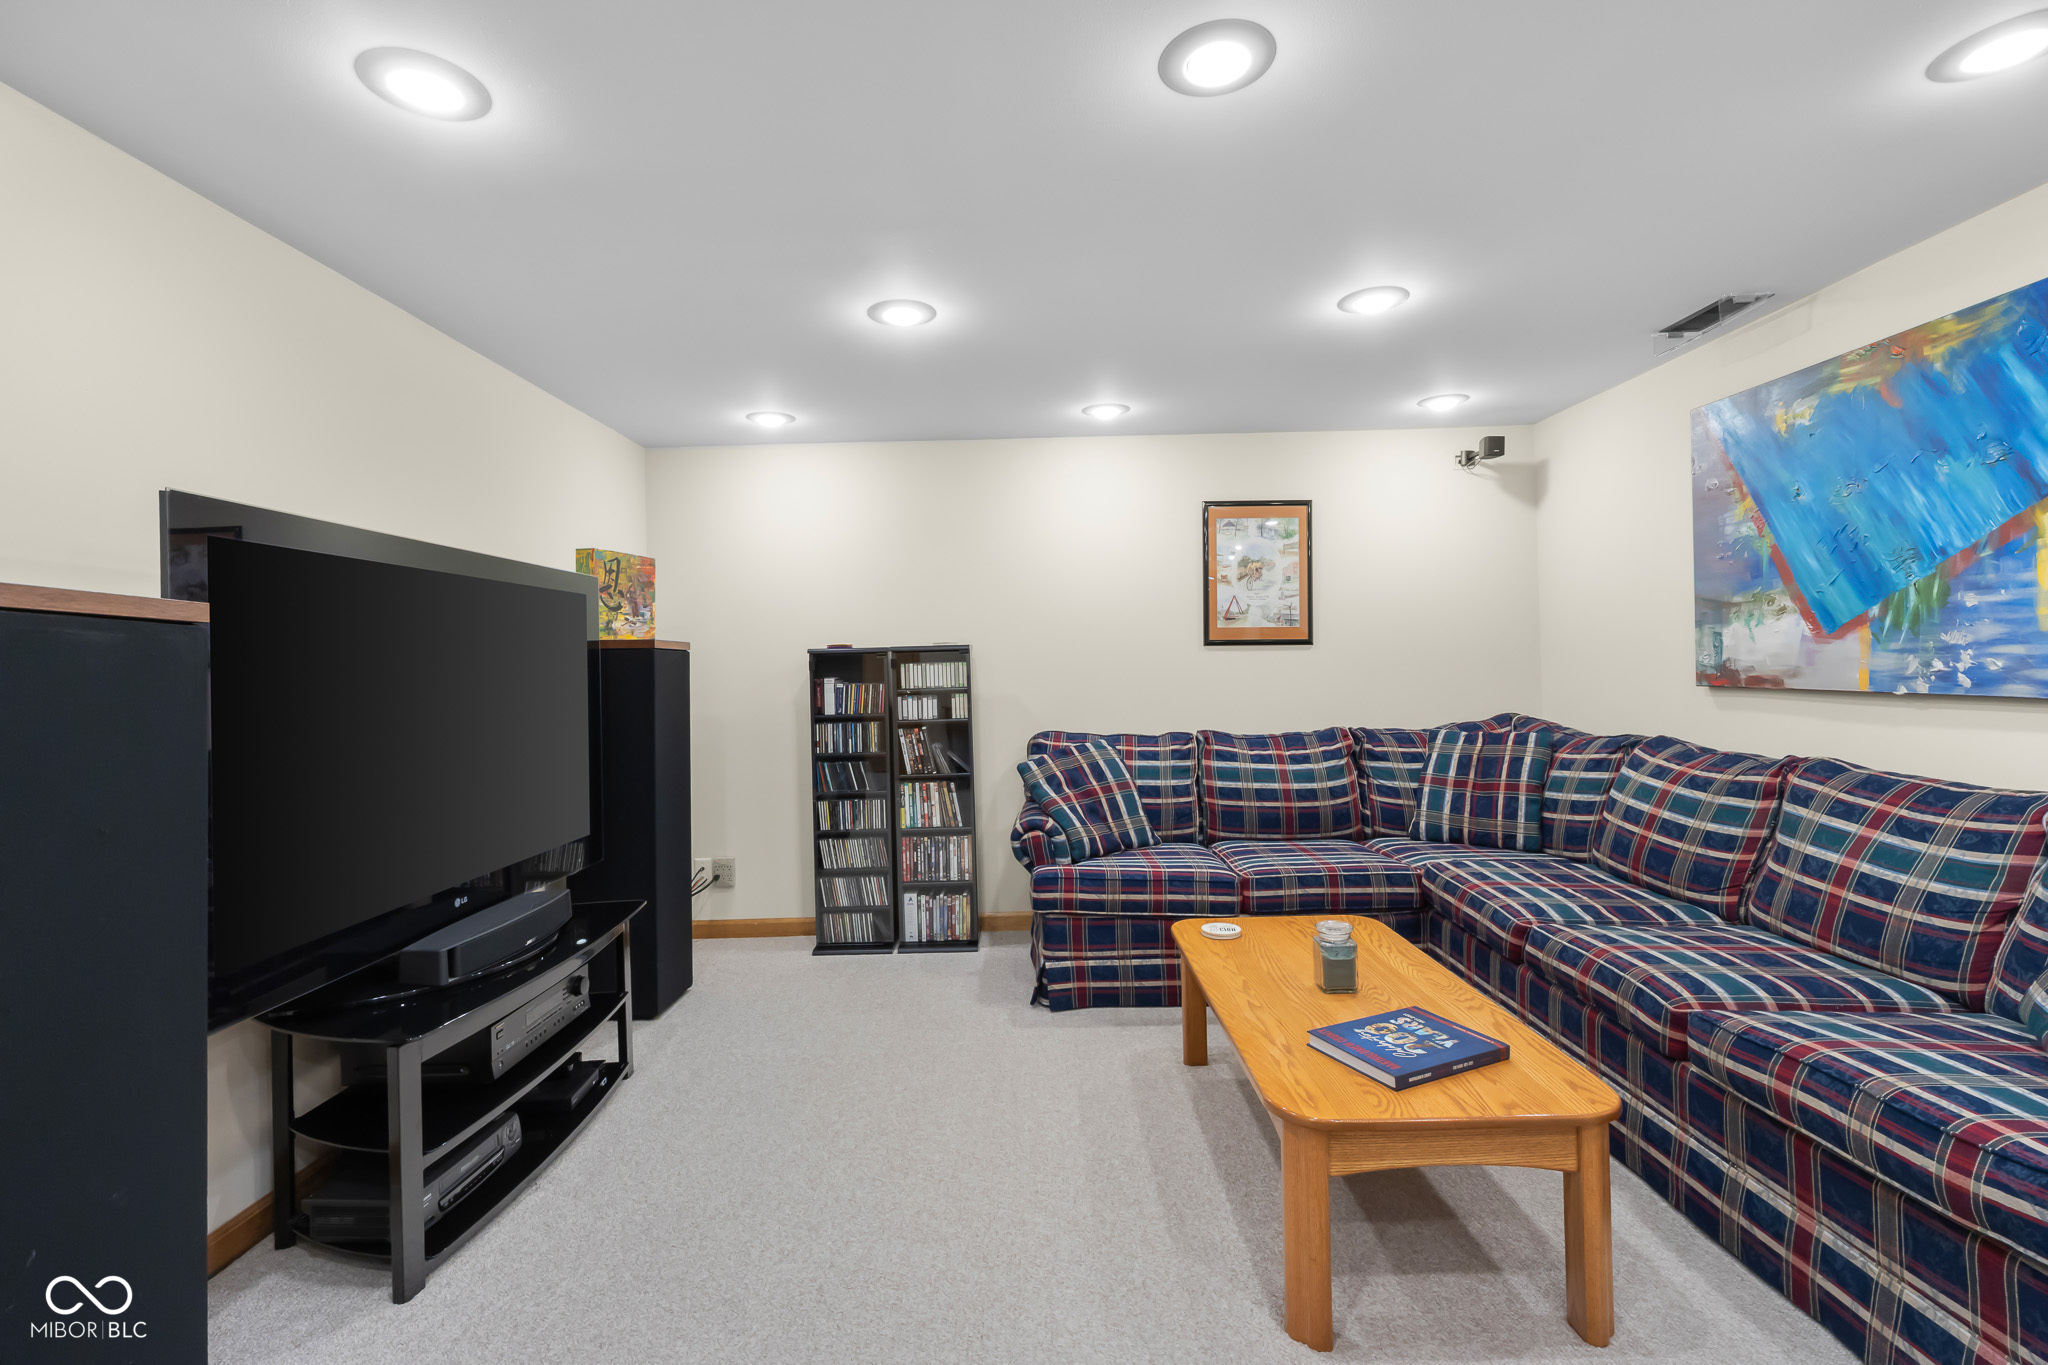
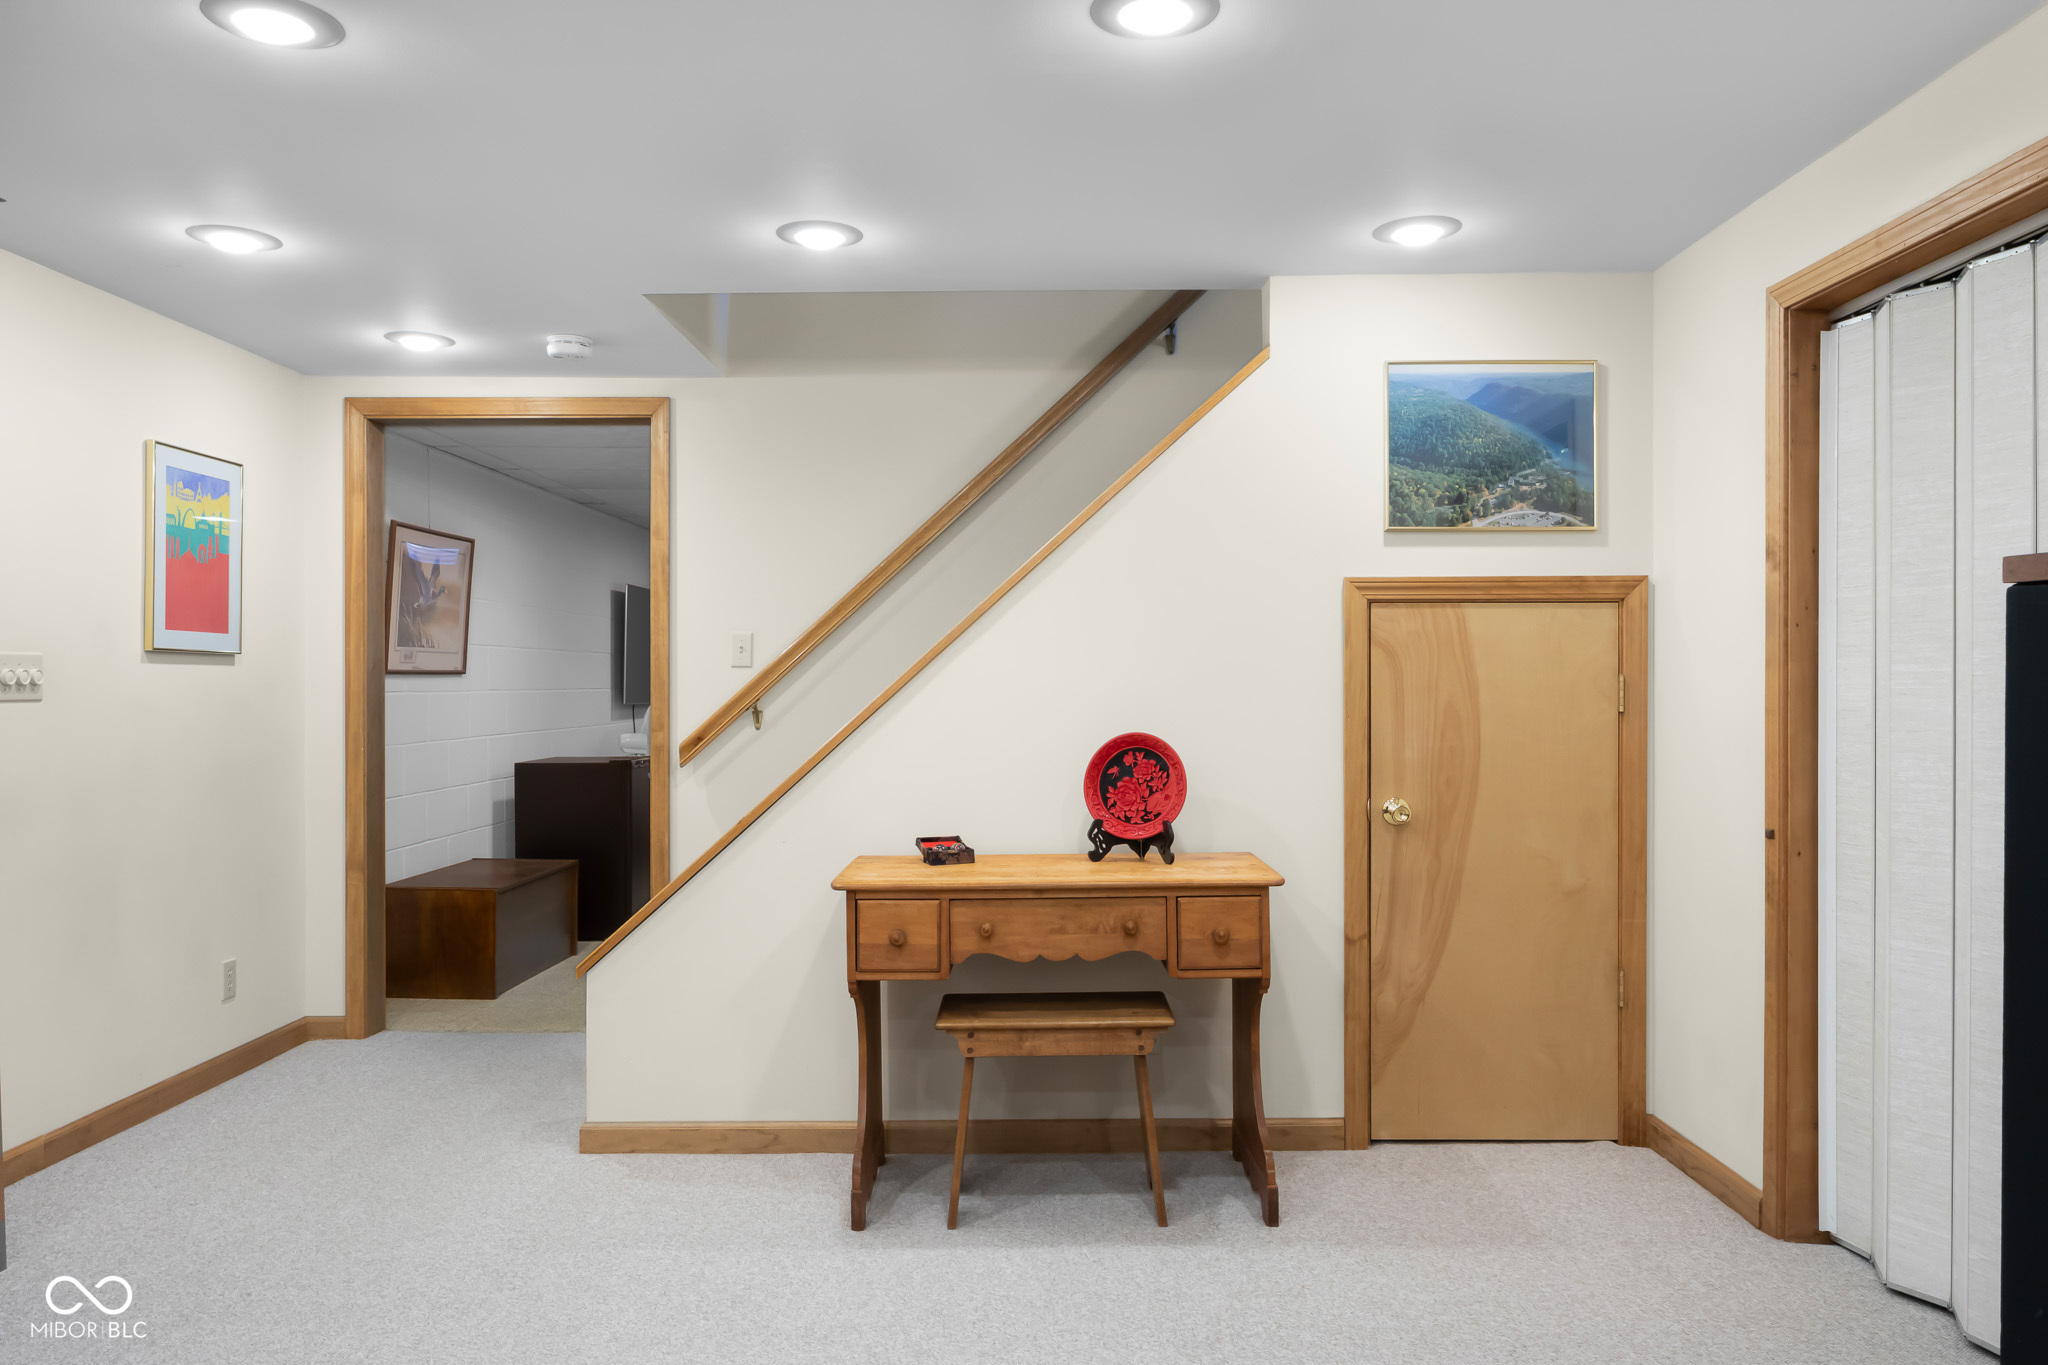
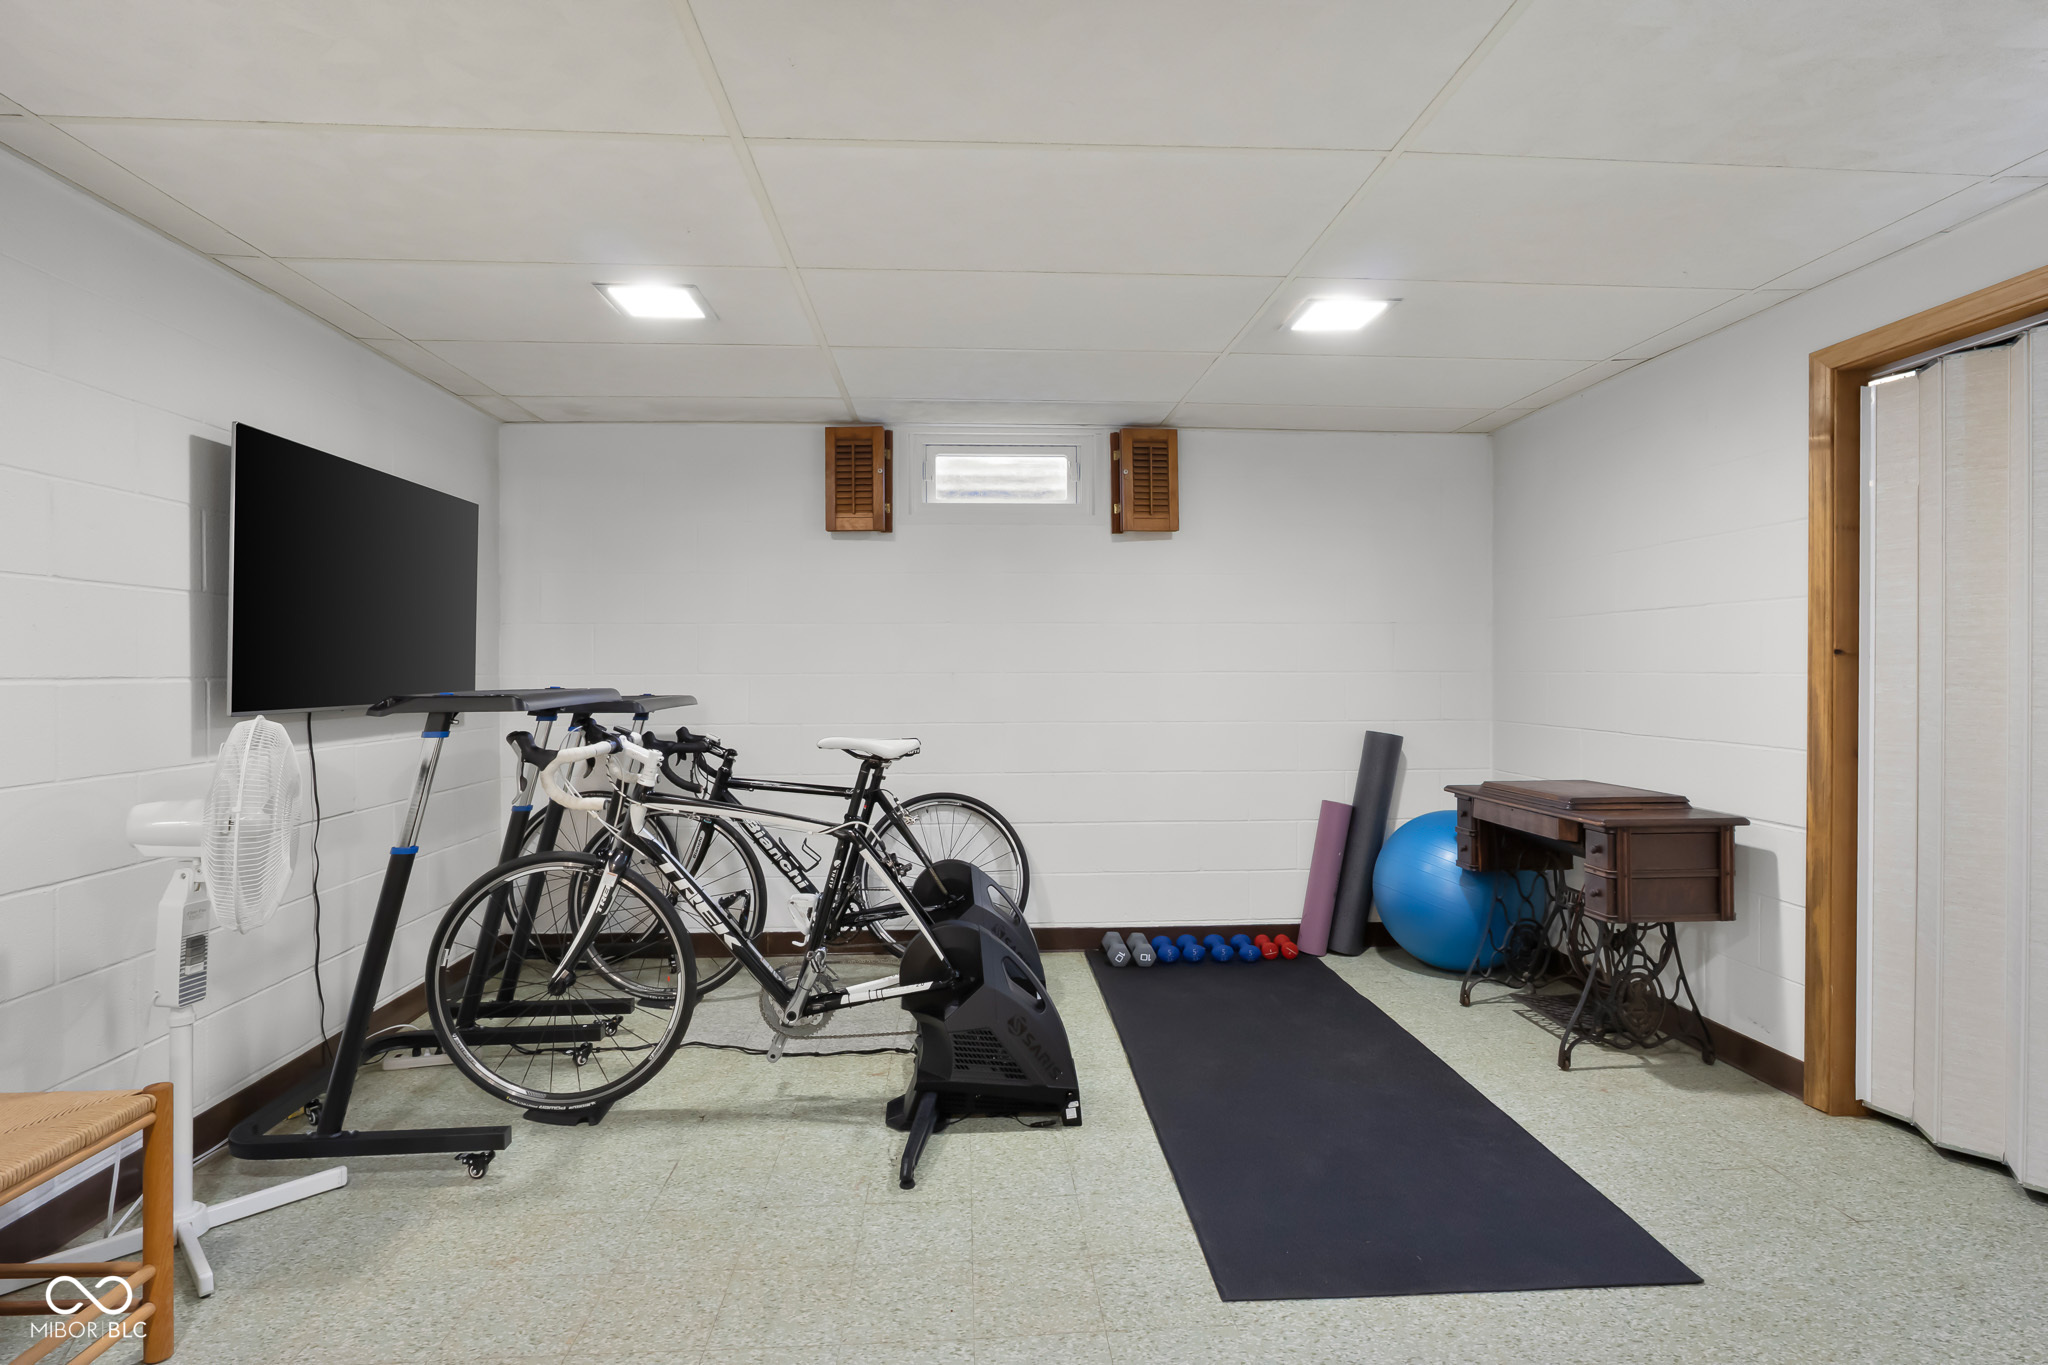
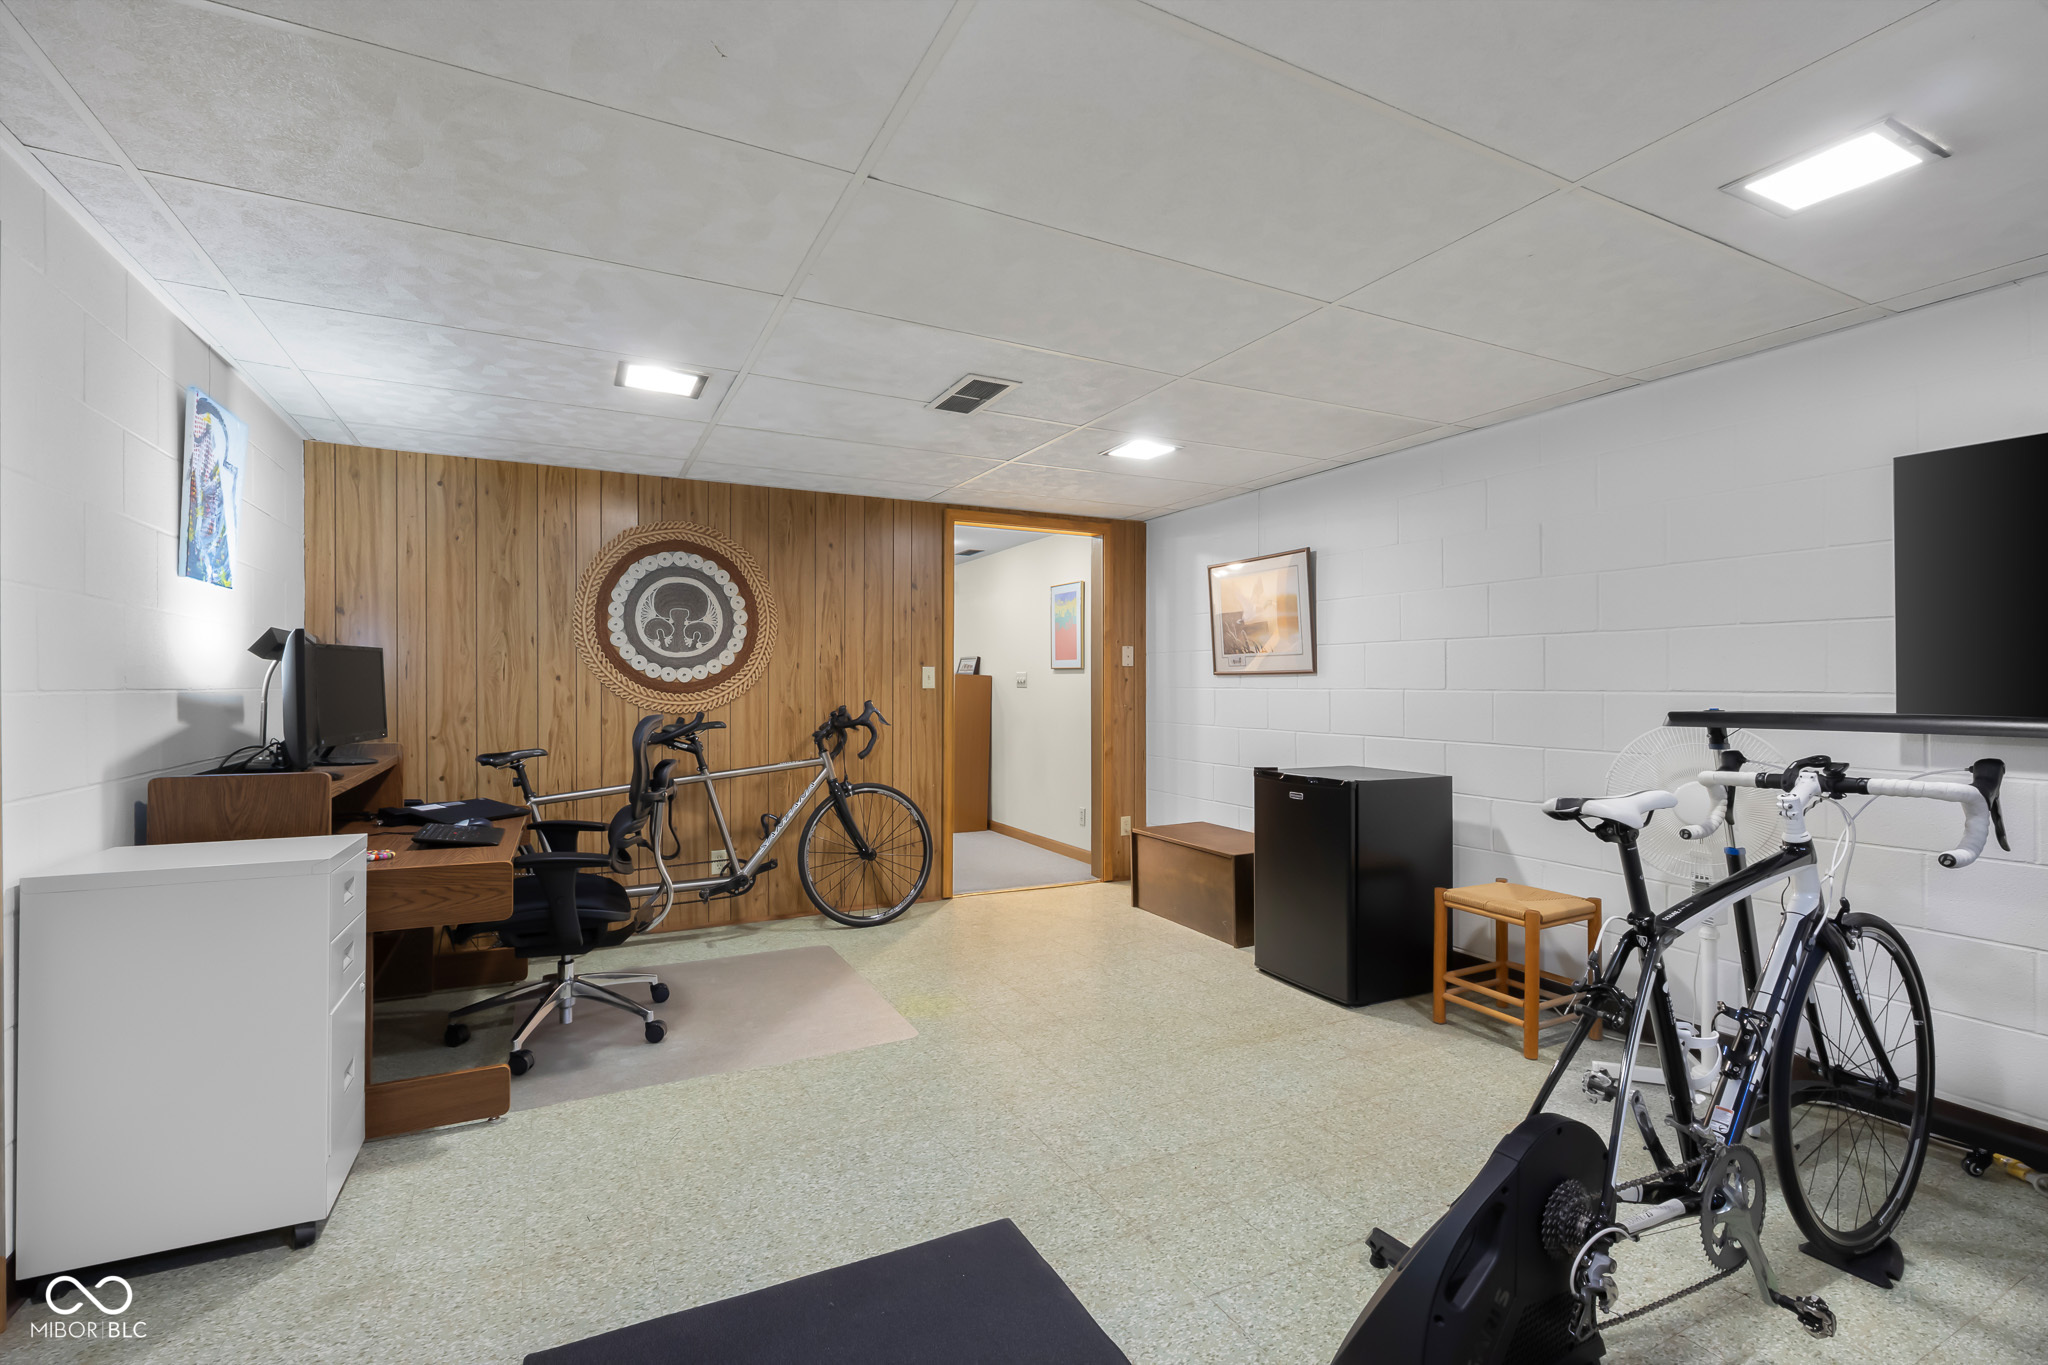
This beautifully maintained 4-bedroom, 2.5-bathroom two-story traditional home offers the perfect blend of comfort, style, and convenience. Located in one of the most desirable neighborhoods, it's just a short walk to several schools and St. Bartholomew, offering easy access to school activities, including sports events! The cozy family room is warm and inviting, featuring a charming fireplace that creates the perfect setting for relaxing evenings. Open to the kitchen, this area fosters a connected, inviting flow, perfect for spending quality time with family or entertaining guests. The kitchen has been thoughtfully renovated with rich wood cabinets, sleek stainless steel appliances, and beautiful quartz countertops. Additional highlights include a newer HVAC system, Marvin windows for enhanced comfort and energy efficiency, and a replaced sewer line, offering improved functionality and peace of mind. Step outside to enjoy the large, well-maintained lot, and relax on the generous screened-in porch overlooking the backyard-an ideal spot for both quiet moments and gatherings. The backyard also features a basketball goal, making it the perfect space for outdoor recreation and fun. The basement offers plenty of versatility-perfect for a home gym, movie nights, or a playroom-and includes abundant storage space. With its excellent location, modern updates, and functional living spaces, this home is a must-see. Schedule your private tour today!
Build Your Team
Quickly find investor-friendly professionals who can help you succeed in real estate investing at any stage of the investing journey.


Agents
Match with investor-friendly agents who can help you find, analyze, and close your next deal


Lenders
Get the best funding…find investor-friendly lenders who specialize in your deal strategy


Property Managers
Transition to passive investing. Find a trusted property management partnership that lasts.


Tax Pros & Accountants
Taxes and financial reporting made easy—find experts to create tax savings strategies, file taxes, and more
Location
Property Details
Parking
- Description: Attached Garage
- Details: Attached
- Garage Spaces: 2
- Spaces Total: 0
Bedroom Information
- # of Bedrooms: 4
Bathroom Information
- # of Baths (Full): 2
- # of Baths (Partial): 1
- # of Baths (Total): 3.0
Interior Features
- # of Rooms: 11
- # of Stories: 2
- Basement: Yes
- Fireplace: Yes
Exterior Features
- Foundation: Block
Land Information
- Land Use: Residential
- Land Use Subtype: Single Family Residential
Lot Information
- Parcel ID: 039513140004.900005
- Lot Size: 11326 sqft
Property Information
- Property Type: Single Family Residence
- Style: TraditonalAmerican
- Year Built: 1962
Tax Information
- Annual Tax: $0
Utilities
- Heating: Natural Gas
Location
- County: Bartholomew
Listing Details
Investment Summary
- Monthly Cash Flow
- -$531
- Cap Rate
- 4.6%
- Cash-on-Cash Return
- -6.9%
- Debt Coverage Ratio
- 0.74
- Internal Rate of Return (5 years)
- -2.7%
Cash Flow
Net Operating Income (NOI) minus mortgage payments.
Calculation:
NOI - Mortgage Payments
Cap Rate (Market Value)
Capitalization Rate is a rate of return that compares the yearly Net Operating Income (NOI) to the market value.
Calculation:
NOI / Market Value
Cash-on-Cash Return (CoC)
Annual cash flow divided by initial cash invested.
Calculation:
Annual Cash Flow / Cash Invested
Debt Coverage Ratio (DCR)
Net Operating Income (NOI) divided by total debt payments.
Calculation:
NOI / Total Debt Payments
Internal Rate of Return (IRR)
A metric for assessing profitability over time. IRR is the discount rate at which the net present value (NPV) of all future cash flows (positive and negative) from an investment equals zero — including both periodic cash flow (such as rent) and a projected sale at the end of the holding period. It represents the expected annualized return, accounting for income, expenses, and the recovery of capital through a future sale.
Calculation:
(Future Value / Present Value) ** (1 / Years) - 1
Purchase Details
|
The price paid for the property. Purchase price:
| $400,000 |
|---|---|
|
The amount of the purchase financed through a loan. Amount financed:
| -$320,000 |
Down paymentThe initial payment made towards the purchase. Calculation:Purchase price - Amount financed Down payment:
| $80,000 |
Closing costsFees and expenses associated with purchasing a property, typically ranging from 2% to 5% of the home’s purchase price, paid at the end of a home purchase to cover services like lending, title transfer, and taxes. Closing costs:
| $12,000 |
|
Costs incurred to repair or improve the property. Rehab costs:
| $0 |
Initial cash investedTotal initial cash invested in the property. Calculation:Down payment + Buying costs + Rehab costs Initial cash invested:
| $92,000 |
|
The total square footage (SQFT) of the property. Square feet:
| 2,603 |
|
Cost per square foot of the property. Calculation:Purchase price / Square feet Cost per square foot:
| $154 |
|
Monthly rent divided by square footage. Calculation:Monthly rent / Square feet Monthly rent per square foot:
| $0.85 |
Financing Details
Loan amountThe total sum of money borrowed from a lender to finance a property purchase. Calculation:Purchase Price - Down Payment
Loan amount:
| $320,000 |
|---|---|
Loan to Value Ratio (LTV)Loan amount divided by the market value of the property. Calculation:Loan Amount / Market Value
Loan to value ratio:
| 80.0% |
Loan typeThe type of loan (e.g., fixed, adjustable).
Loan type:
| Amortizing |
TermThe loan repayment period in years.
Term:
| 30 years |
Interest RateThe percentage a lender charges on the borrowed amount of a loan, determining the cost of borrowing money.
Interest rate:
| 6.625% |
Principle & Interest (PI)The principle is the portion of the loan payment that reduces the loan balance. The interest is the lender's charge for borrowing money.
Principle & interest:
| $2,049 |
Property TaxesAnnual taxes levied by local governments on real estate properties. These taxes fund public services like schools, roads, and emergency services. Calculation:Assumes 12% of gross rental income, unless public tax records are available.
Property tax:
| $0 |
InsuranceThe costs for insurance coverage to protect against financial losses due to risks like fire, natural disasters, theft, liability, or tenant-related damages. Calculation:Assumes 7% of gross rental income, unless insurance rates are specified.
Insurance:
| $154 |
Private Mortgage Insurance (PMI)A fee that borrowers pay when they take out a conventional loan with a loan-to-value (LTV) ratio above 80%.
Private mortgage insurance (PMI):
| $0 |
|
The fixed amount a borrower pays each month to repay a loan. It typically includes principal and interest (P&I) and may also cover property taxes, insurance, HOA fees, and PMI if escrowed. Monthly payment:
| $2,203 |
Operating Income
| % Rent | Monthly | Yearly | |
|---|---|---|---|
Gross RentThe total rental income received from tenants before deducting any expenses. Includes base rent, late fees, pet fees, parking fees, and other recurring charges.
Gross rent:
| $2,200 | $26,400 | |
Vacancy LossExpected loss of rent due to vacancies.
Vacancy loss:
(6%)
| 6% | -$132 | -$1,584 |
Operating IncomeGross rental income minus vacancy loss. Calculation:Gross rent - Vacancy loss
Operating income:
| $2,068 | $24,816 |
Operating Expenses
| % Rent | Monthly | Yearly | |
|---|---|---|---|
Property TaxesAnnual taxes levied by local governments on real estate properties. These taxes fund public services like schools, roads, and emergency services. Calculation:Assumes 12% of gross rental income, unless public tax records are available. | 0% | $0 | $0 |
InsuranceThe costs for insurance coverage to protect against financial losses due to risks like fire, natural disasters, theft, liability, or tenant-related damages. Calculation:Assumes 7% of gross rental income, unless insurance rates are specified. | 7% | -$154 | -$1,848 |
Property ManagementThe costs associated with hiring a property manager to handle the day-to-day operations of a rental property. Includes management fees, leasing fes, eviction fees, etc. Calculation:Assumes 8% of gross rental income. | 8% | -$176 | -$2,112 |
Repairs & MaintenanceOngoing costs for routine upkeep and minor fixes needed to keep a property in good working condition. Calculation:Assumes 5% of gross rental income. Varies by property age and condition. | 5% | -$110 | -$1,320 |
Capital ExpensesLarge, infrequent costs for major improvements or replacements, like a new roof, HVAC system, or appliances. Calculation:Assumes 5% of gross rental income. Varies by property age. | 5% | -$110 | -$1,320 |
HOA FeesRegular dues paid to a Homeowners Association for community maintenance, amenities, and management. Similar fees include: Condo Association Fees, Co-op Maintenance Fees, etc. Calculation:Assumes 0% gross rental income, unless specified.. | 0% | $0 | $0 |
Operating ExpensesRecurring costs required to maintain and manage a rental property, including property taxes, insurance, maintenance, repairs, utilities (if paid by the owner), property management fees, and other day-to-day expenses. Calculation:Insurance + Property Taxes + Property Management + Repairs & Maintenance + Capital Expenditures + HOA Fees | 25% | -$550 | -$6,600 |
Cash Flow
| Monthly | Yearly | |
|---|---|---|
Net Operating Income (NOI)The income generated from a property after deducting all operating expenses but before deducting mortgage payments, taxes, and capital expenditures. Calculation:Gross Operating Income - Operating Expenses
Net operating income:
| $1,518 | $18,216 |
Mortgage PaymentThe fixed amount a borrower pays each month to repay a loan. It typically includes principal and interest (P&I) and may also cover property taxes, insurance, HOA fees, and PMI if escrowed. | -$2,049 | -$24,588 |
Cash FlowNet Operating Income (NOI) minus mortgage payments. Calculation:NOI - Mortgage Payments | $531 | $6,372 |