
$1,199,000
Investment Summary
- Monthly Cash Flow
- -$1,939
- Cap Rate
- 4.3%
- Cash-on-Cash Return
- -8.4%
- Debt Coverage Ratio
- 0.69
- Internal Rate of Return (5 years)
- -4.2%
Cash Flow
Net Operating Income (NOI) minus mortgage payments.
Calculation:
NOI - Mortgage Payments
Cap Rate (Market Value)
Capitalization Rate is a rate of return that compares the yearly Net Operating Income (NOI) to the market value.
Calculation:
NOI / Market Value
Cash-on-Cash Return (CoC)
Annual Cash Flow / Cash Invested
Calculation:
Annual cash flow divided by initial cash invested.
Debt Coverage Ratio (DCR)
Net Operating Income (NOI) divided by total debt payments.
Calculation:
NOI / Total Debt Payments
Internal Rate of Return (IRR)
A metric for assessing profitability over time. IRR is the discount rate at which the net present value (NPV) of all future cash flows (positive and negative) from an investment equals zero — including both periodic cash flow (such as rent) and a projected sale at the end of the holding period. It represents the expected annualized return, accounting for income, expenses, and the recovery of capital through a future sale.
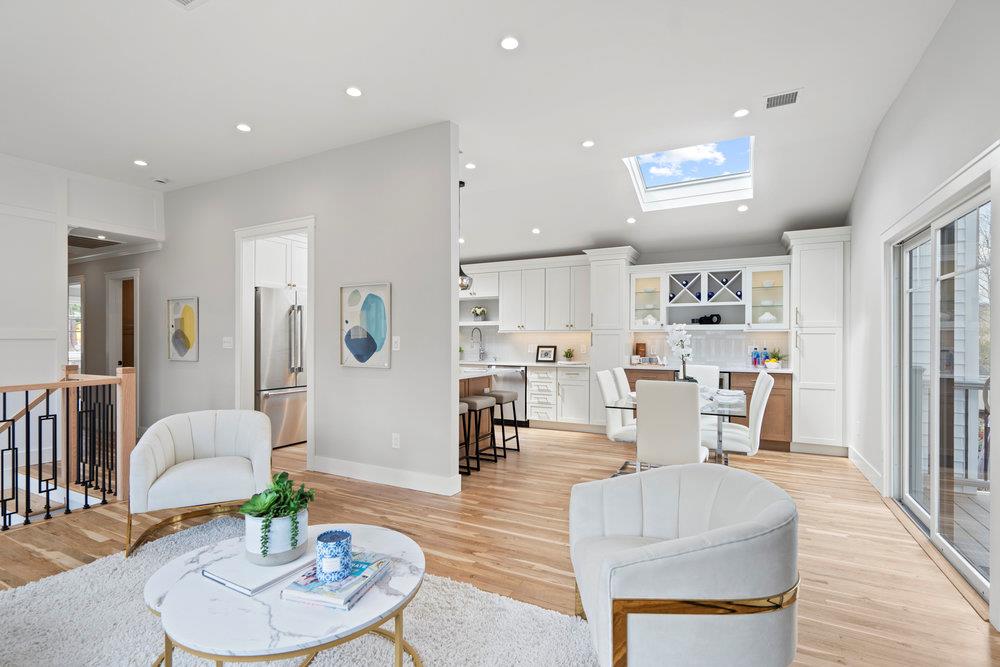
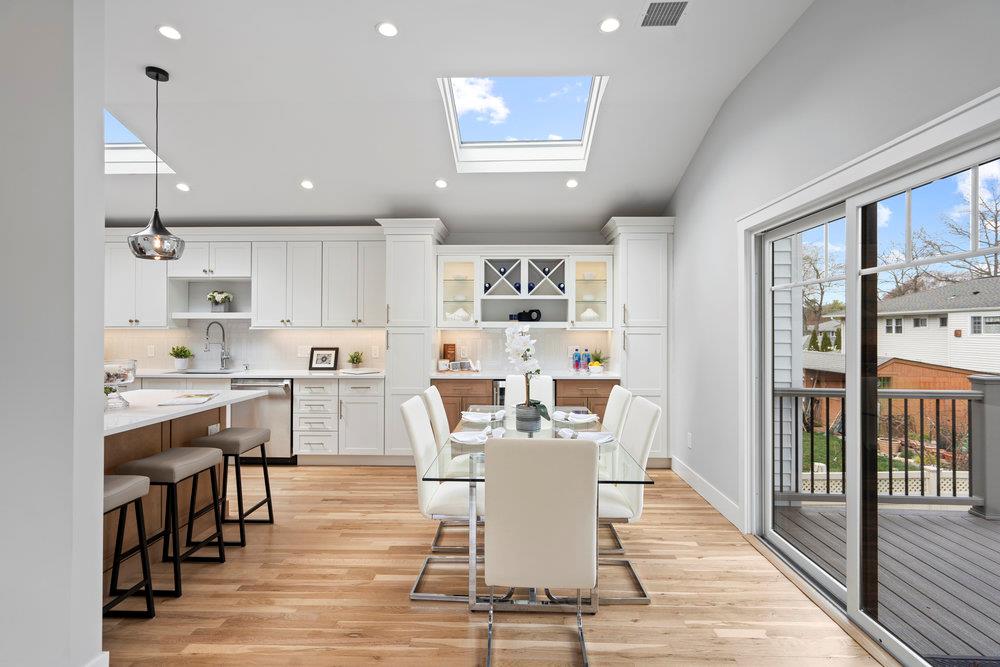
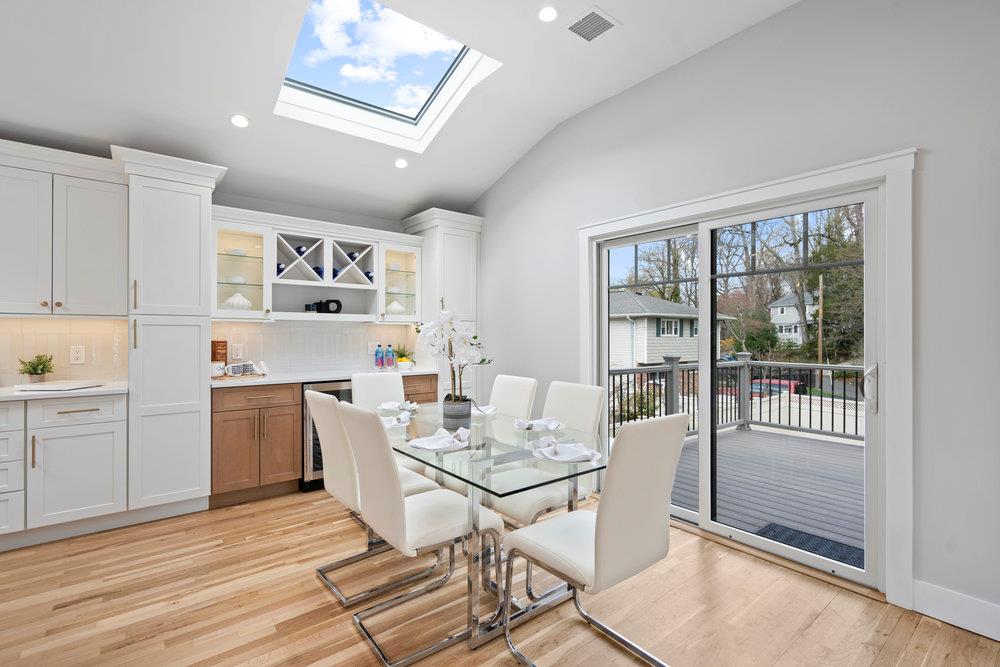
Property Description
Welcome to 2 Valley Street—a stunning high ranch that has been completely and expertly renovated. This exceptional property is ideally within walking distance of Heckscher Park, known for its playground, community events, and sporting activities. You are just a short walk-away from the vibrant village, where you can enjoy parades, holiday festivals, MSG-style entertainment, excellent dining, and incredible shopping along the main street. This impressive residence features four spacious bedrooms and three luxurious bathrooms. Every detail reflects a comprehensive renovation that includes the latest building code updates: new plumbing, state-of-the-art electrical systems with all-new wiring, stylish transom-style windows and doors, brand-new central air conditioning, and a new roof and siding adorned with beautiful stonework and an inviting front patio. Step inside to discover an open floor plan, highlighted by a chef’s kitchen with high-quality stainless-steel appliances, quartzite countertops, a gas cooktop with a convenient pasta filler, and a breakfast island perfect for quick meals. Adjacent to the kitchen is a charming nook featuring a built-in beverage center and lighted glass cabinets to showcase your finest crystal. Two pantry closets provide ample storage space. This new, open layout allows for effortless entertaining, seamlessly connecting the kitchen, living room, and expansive raised deck, which offers private views of the yard and nearby park and family entertaining. Access to the fully fenced yard is easy via the deck, which features a beautifully designed paver walkway. The property includes a primary suite that offers unparalleled comfort and privacy, while two additional bedrooms share a well-designed second bathroom with ample storage and a tub. The first floor boasts a large, inviting den with direct access to the backyard, a full bathroom, and a versatile fourth bedroom or office with a closet. Additionally, there is a laundry room featuring a never-used stackable washer and gas dryer. From the den, you can easily access a well-lit two-car garage, and every closet is enhanced with upgraded built-in shelving. The stunning new Belgium block driveway has been meticulously expanded to accommodate three cars, ensuring convenience is a priority. This property is ideally positioned for easy access to outdoor activities and community events, making it the perfect place to thrive. Live boldly in this vibrant neighborhood, which is close to shops, restaurants, cultural attractions, and train services. This move-in-ready home is a rare gem in Huntington Village, offering the perfect blend of convenience and style, all within less than an hour's commute from New York City. Don’t miss your chance to make it yours!
Build Your Team
Quickly find investor-friendly professionals who can help you succeed in real estate investing at any stage of the investing journey.


Agents
Match with investor-friendly agents who can help you find, analyze, and close your next deal


Lenders
Get the best funding…find investor-friendly lenders who specialize in your deal strategy


Property Managers
Transition to passive investing. Find a trusted property management partnership that lasts.


Tax Pros & Accountants
Taxes and financial reporting made easy—find experts to create tax savings strategies, file taxes, and more
Location
Property Details
Parking
- Description: Driveway, Garage, Private
- Details: Driveway, Garage, Private
- Garage Spaces: 2
- Spaces Total: 5
Bedroom Information
- # of Bedrooms: 4
Bathroom Information
- # of Baths (Full): 3
- # of Baths (Total): 3.0
Interior Features
- # of Rooms: 8
Land Information
- Land Use: Residential
- Land Use Subtype: Single Family Residential
Lot Information
- Parcel ID: 0400071.0003.00080.000
- Lot Size: 6619 sqft
Property Information
- Property Type: Single Family Residence
- Style: Hi Ranch, Raised Ranch
- Year Built: 1964
Tax Information
- Annual Tax: $14,382
Utilities
- Water & Sewer: Public
- Heating: Forced Air
- Cooling: Central Air
Location
- County: Suffolk
Listing Details
Investment Summary
- Monthly Cash Flow
- -$1,939
- Cap Rate
- 4.3%
- Cash-on-Cash Return
- -8.4%
- Debt Coverage Ratio
- 0.69
- Internal Rate of Return (5 years)
- -4.2%
Cash Flow
Net Operating Income (NOI) minus mortgage payments.
Calculation:
NOI - Mortgage Payments
Cap Rate (Market Value)
Capitalization Rate is a rate of return that compares the yearly Net Operating Income (NOI) to the market value.
Calculation:
NOI / Market Value
Cash-on-Cash Return (CoC)
Annual Cash Flow / Cash Invested
Calculation:
Annual cash flow divided by initial cash invested.
Debt Coverage Ratio (DCR)
Net Operating Income (NOI) divided by total debt payments.
Calculation:
NOI / Total Debt Payments
Internal Rate of Return (IRR)
A metric for assessing profitability over time. IRR is the discount rate at which the net present value (NPV) of all future cash flows (positive and negative) from an investment equals zero — including both periodic cash flow (such as rent) and a projected sale at the end of the holding period. It represents the expected annualized return, accounting for income, expenses, and the recovery of capital through a future sale.
Purchase Details
Purchase PriceThe price paid for the property. Purchase price:
| $1,199,000 |
|---|---|
Amount FinancedThe amount of the purchase financed through a loan. Amount financed:
| -$959,200 |
Down paymentThe initial payment made towards the purchase. Down payment:
| $239,800 |
Closing CostsFees and expenses associated with purchasing a property, typically ranging from 2% to 5% of the home’s purchase price, paid at the end of a home purchase to cover services like lending, title transfer, and taxes. Closing costs:
| $35,970 |
Rehab CostsCosts incurred to repair or improve the property, including: roof, flooring, exterior siding, kitchen, exterior paint, bathrooms, etc. Rehab costs:
| $0 |
Initial Cash InvestedThe total initial cash invested in the property. Calculation:Down payment + Buying costs + Rehab costs Initial cash invested:
| $275,770 |
Square Feet (SQFT)The total square footage of the property. Square feet:
| 2,200 |
Cost Per Square FootCost per square foot of the property. Calculation:Purchase Price / Square Feet Cost per square foot:
| $545 |
Monthly Rent Per Square FootMonthly rent divided by the number of square feet. This ratio helps investors compare rental income efficiency across properties, markets, and unit sizes Calculation:Monthly Rent / Square Feet Monthly rent per square foot:
| $3.64 |
Financing Details
Loan AmountThe total sum of money borrowed from a lender to finance a property purchase. Calculation:Purchase Price - Down Payment
Loan amount:
| $959,200 |
|---|---|
Loan to Value Ratio (LTV)Loan amount divided by the market value of the property. Calculation:Loan Amount / Market Value
Loan to value ratio:
| 80.0% |
Loan TypeThe type of loan (e.g., fixed, adjustable).
Loan type:
| Amortizing |
TermThe loan repayment period in years.
Term:
| 30 years |
Interest RateThe percentage a lender charges on the borrowed amount of a loan, determining the cost of borrowing money.
Interest rate:
| 6.810% |
Principal & Interest (PI)The principal is the portion of the loan payment that reduces the loan balance. The interest is the lender's charge for borrowing money. Calculation:(P * r * (1 + r) ** n) / ((1 + r) ** n - 1) Where:
P = Loan amount (principal)
Principal & interest:
| $6,260 |
Property TaxesAnnual taxes levied by local governments on real estate properties. These taxes fund public services like schools, roads, and emergency services. Calculation:Assumes 12% of gross rental income, unless public tax records are available.
Property tax:
| $1,199 |
InsuranceThe costs for insurance coverage to protect against financial losses due to risks like fire, natural disasters, theft, liability, or tenant-related damages. Calculation:Assumes 7% of gross rental income, unless insurance rates are specified.
Insurance:
| $560 |
Private Mortgage Insurance (PMI)A fee that borrowers pay when they take out a conventional loan with a loan-to-value (LTV) ratio above 80%.
Private mortgage insurance (PMI):
| $0 |
Monthly PaymentThe fixed amount a borrower pays each month to repay a loan. It typically includes principal and interest (P&I) and may also cover property taxes, insurance, HOA fees, and PMI if escrowed. Monthly payment:
| $8,019 |
Operating Income
| % Rent | Monthly | Yearly | |
|---|---|---|---|
Gross RentThe total rental income received from tenants before deducting any expenses. Includes base rent, late fees, pet fees, parking fees, and other recurring charges.
Gross rent:
| $8,000 | $96,000 | |
Vacancy LossExpected loss of rent due to vacancies.
Vacancy loss:
(6%)
| 6% | -$480 | -$5,760 |
Operating IncomeGross rental income minus vacancy loss. Calculation:Gross rent - Vacancy loss
Operating income:
| $7,520 | $90,240 |
Operating Expenses
| % Rent | Monthly | Yearly | |
|---|---|---|---|
Property TaxesAnnual taxes levied by local governments on real estate properties. These taxes fund public services like schools, roads, and emergency services. Calculation:Assumes 12% of gross rental income, unless public tax records are available. | 15% | -$1,199 | -$14,383 |
InsuranceThe costs for insurance coverage to protect against financial losses due to risks like fire, natural disasters, theft, liability, or tenant-related damages. Calculation:Assumes 7% of gross rental income, unless insurance rates are specified. | 7% | -$560 | -$6,720 |
Property ManagementThe costs associated with hiring a property manager to handle the day-to-day operations of a rental property. Includes management fees, leasing fes, eviction fees, etc. Calculation:Assumes 8% of gross rental income. | 8% | -$640 | -$7,680 |
Repairs & MaintenanceOngoing costs for routine upkeep and minor fixes needed to keep a property in good working condition. Calculation:Assumes 5% of gross rental income. Varies by property age and condition. | 5% | -$400 | -$4,800 |
Capital ExpensesLarge, infrequent costs for major improvements or replacements, like a new roof, HVAC system, or appliances. Calculation:Assumes 5% of gross rental income. Varies by property age. | 5% | -$400 | -$4,800 |
HOA FeesRegular dues paid to a Homeowners Association for community maintenance, amenities, and management. Similar fees include: Condo Association Fees, Co-op Maintenance Fees, etc. Calculation:Assumes 0% gross rental income, unless specified.. | 0% | $0 | $0 |
Operating ExpensesRecurring costs required to maintain and manage a rental property, including property taxes, insurance, maintenance, repairs, utilities (if paid by the owner), property management fees, and other day-to-day expenses. Calculation:Insurance + Property Taxes + Property Management + Repairs & Maintenance + Capital Expenditures + HOA Fees | 40% | -$3,199 | -$38,383 |
Cash Flow
| Monthly | Yearly | |
|---|---|---|
Net Operating Income (NOI)The income generated from a property after deducting all operating expenses but before deducting mortgage payments, taxes, and capital expenditures. Calculation:Gross Operating Income - Operating Expenses
Net operating income:
| $4,321 | $51,852 |
Mortgage PaymentThe fixed amount a borrower pays each month to repay a loan. It typically includes principal and interest (P&I) and may also cover property taxes, insurance, HOA fees, and PMI if escrowed. | -$6,260 | -$75,120 |
Cash FlowNet Operating Income (NOI) minus mortgage payments. Calculation:NOI - Mortgage Payments | $1,939 | $23,268 |