Market Trends & Data
Market News & Data
General Info
Real Estate Strategies

Landlording & Rental Properties
Real Estate Professionals
Financial, Tax, & Legal


Real Estate Classifieds
Reviews & Feedback
Updated about 1 month ago on .

Las Vegas Appreciation and Rent Growth Rate by Zip Codes
Warning: This post contains many charts, and I did not see a way to simplify the presentation.
The zip codes in this study include: 89002, 89011, 89014, 89015, 89031, 89032, 89044, 89052, 89074, 89084, 89117, 89123, 89128, 89129, 89131, 89134, 89135, 89138, 89139, 89141, 89143, 89145, 89147, 89148, 89149, 89178, and 89183. See the map below for where these zip codes are located.
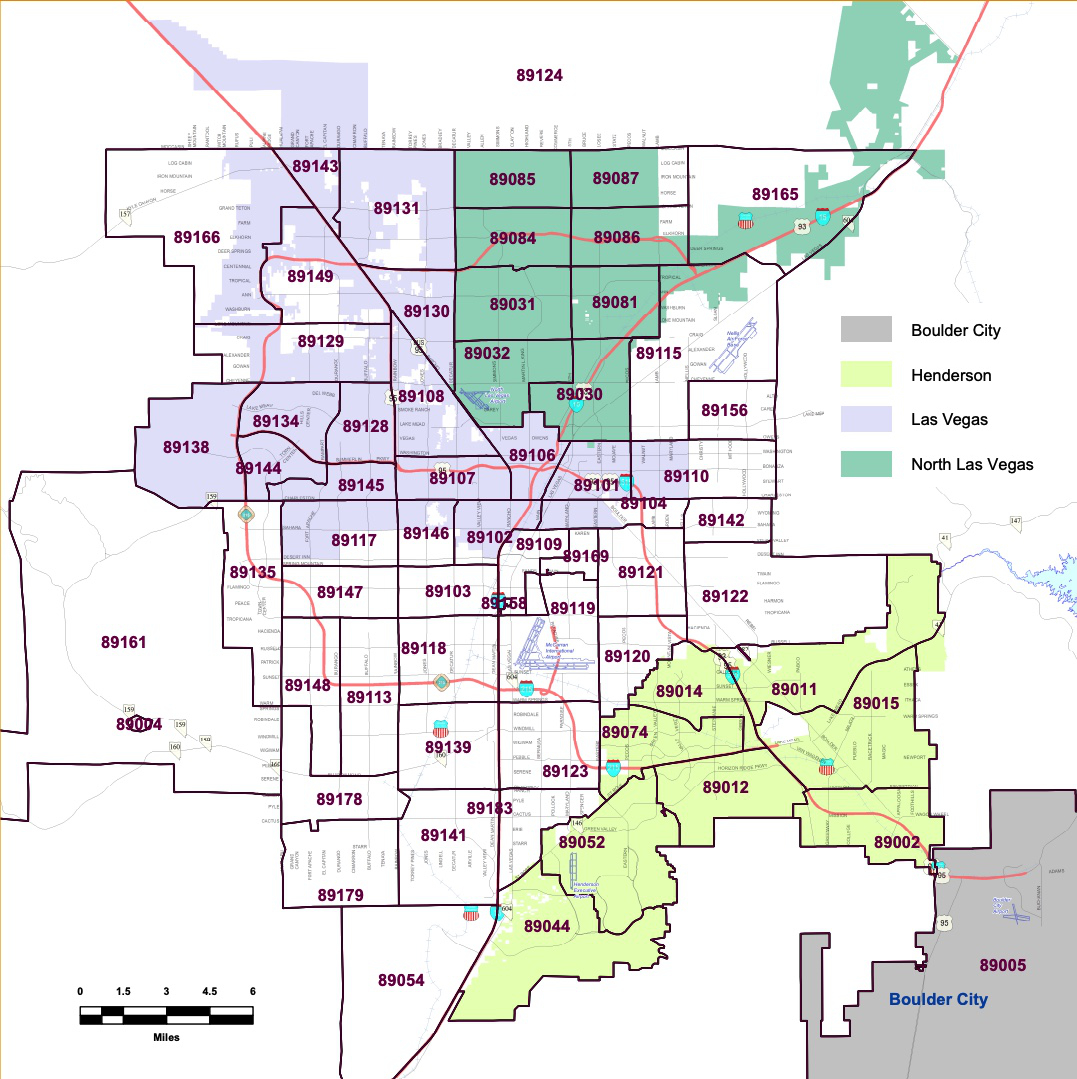
Note: The following charts only include properties in the above zip codes that generally match our property profile: single-family homes featuring 3-4 bedrooms, 2-3 bathrooms, 2-3 car garages, 1,100 to 2,400 square feet of living space, 1 or 2 stories, and lot sizes ranging from 3,000 to 6,000 square feet, built on or after 1985.
Appreciation
10-Year $/SF by Zip Code 2015-01-01 to 2024-12-31
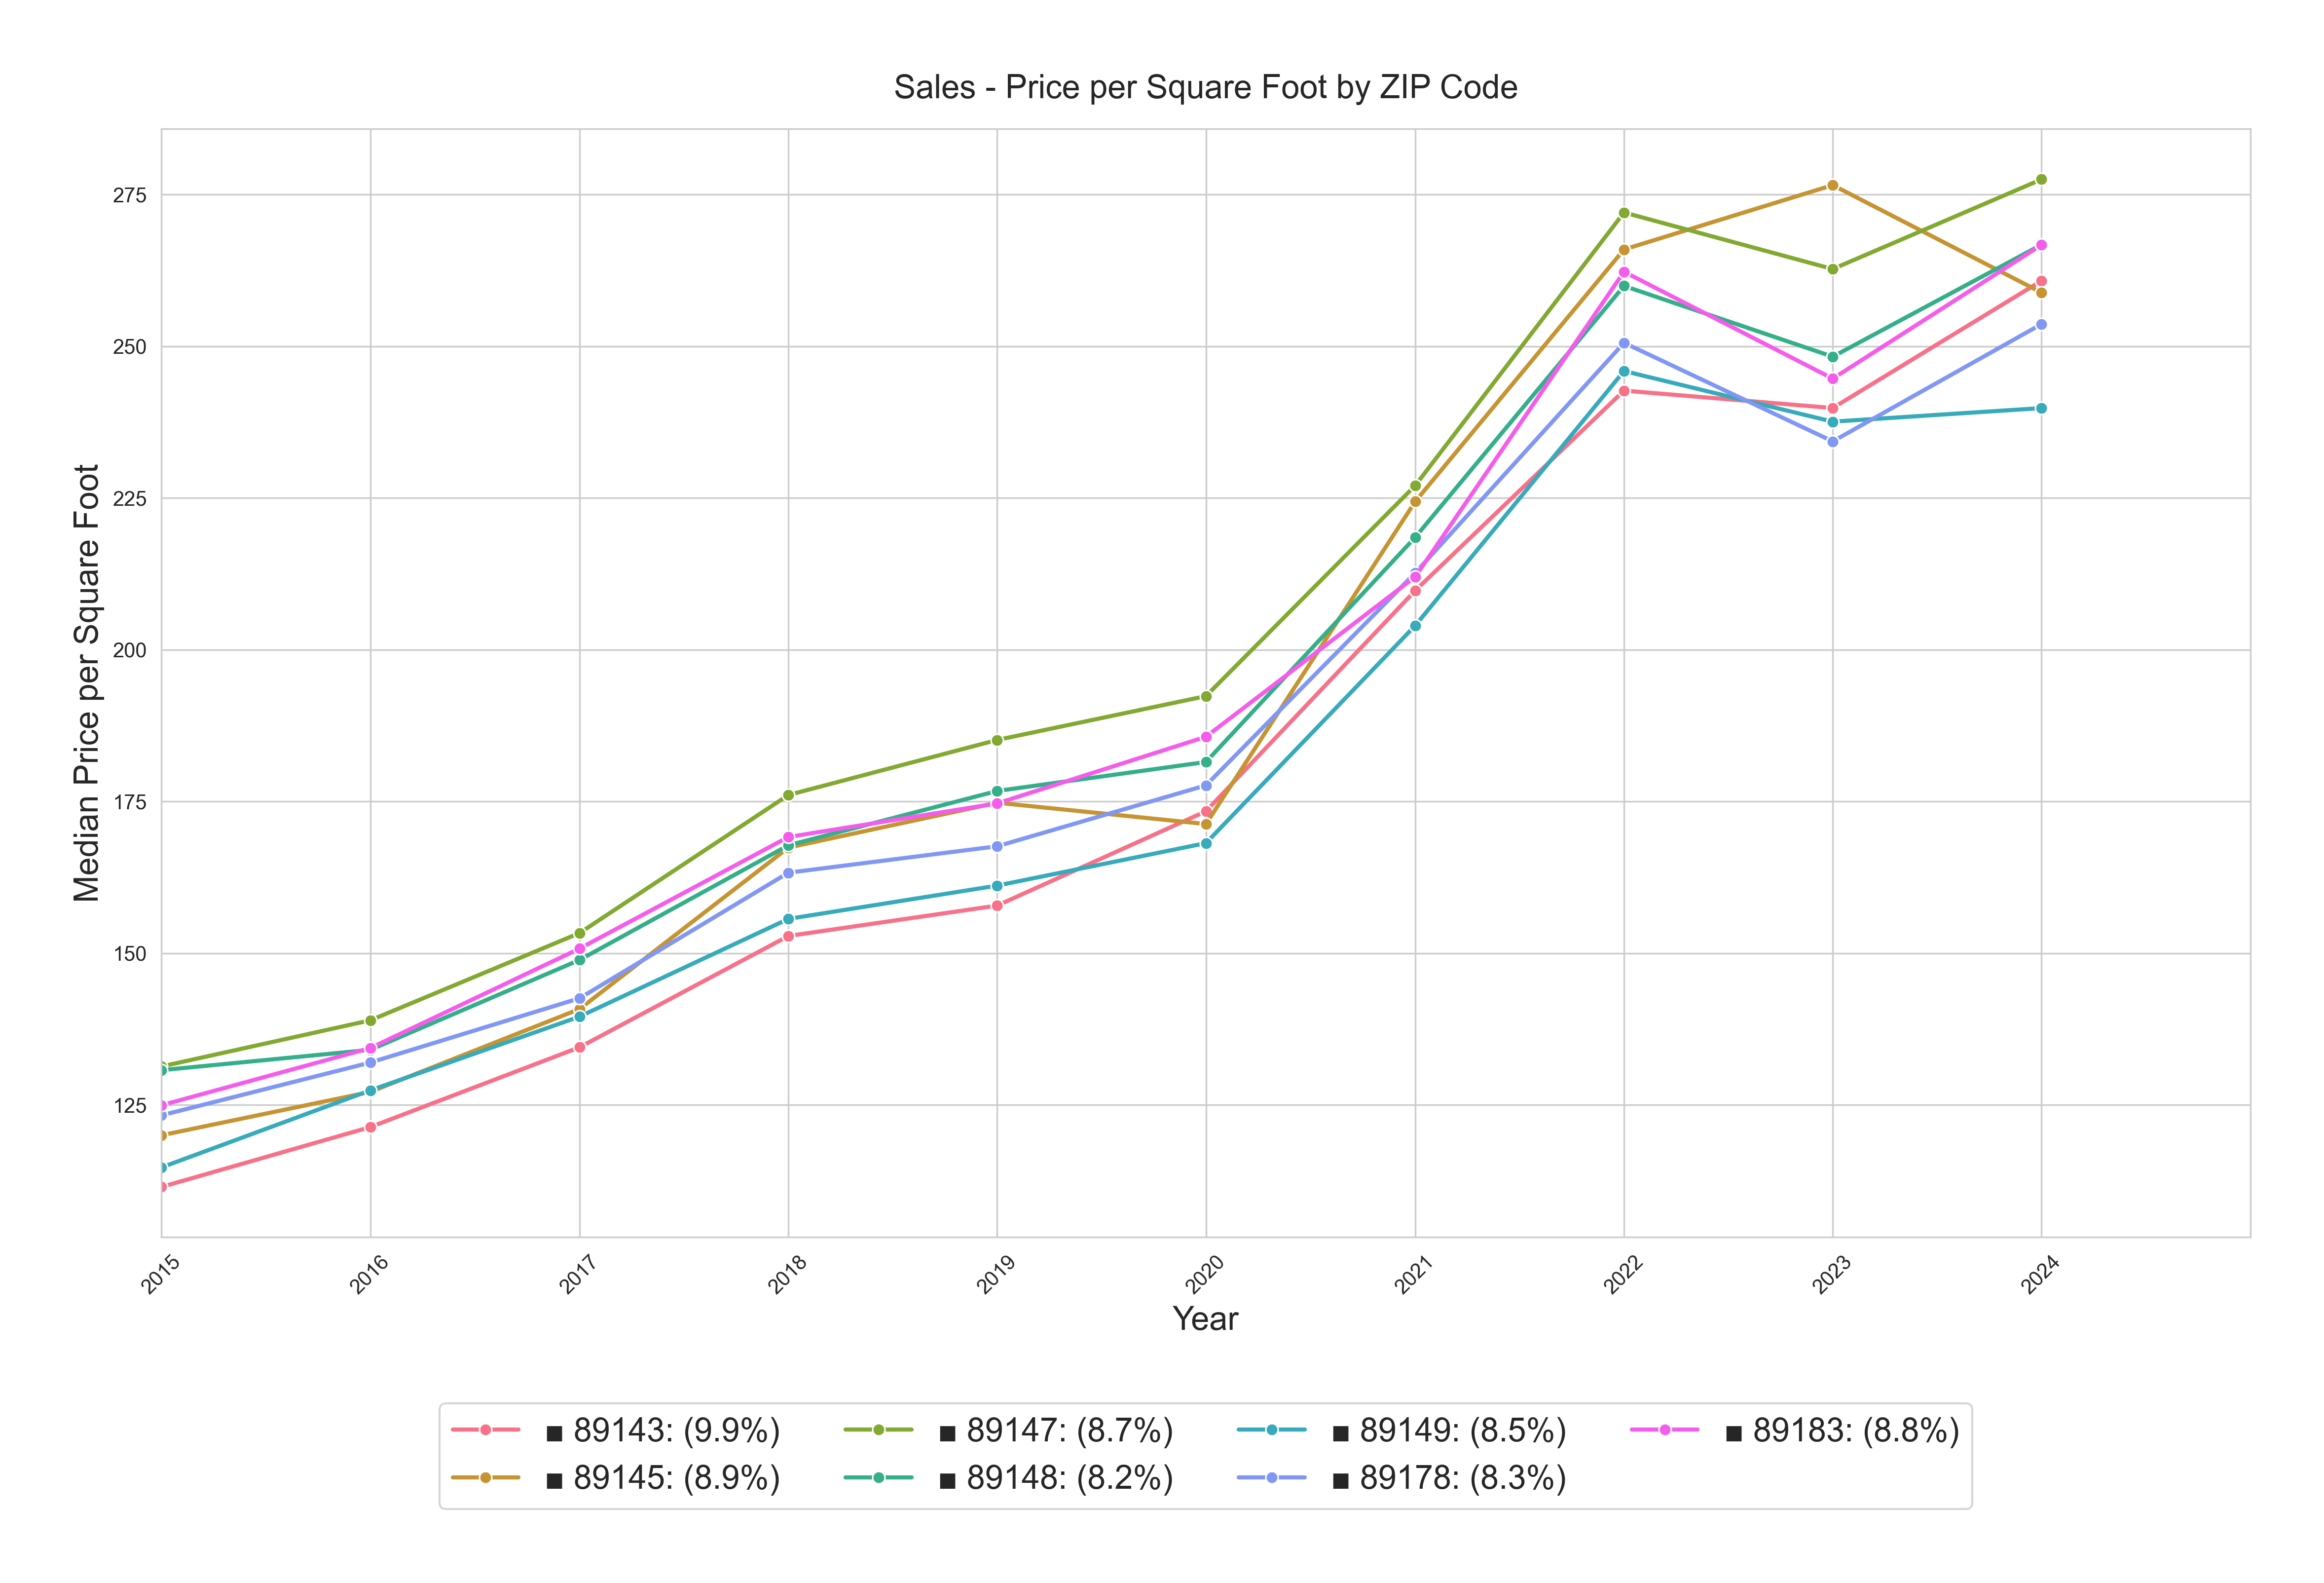
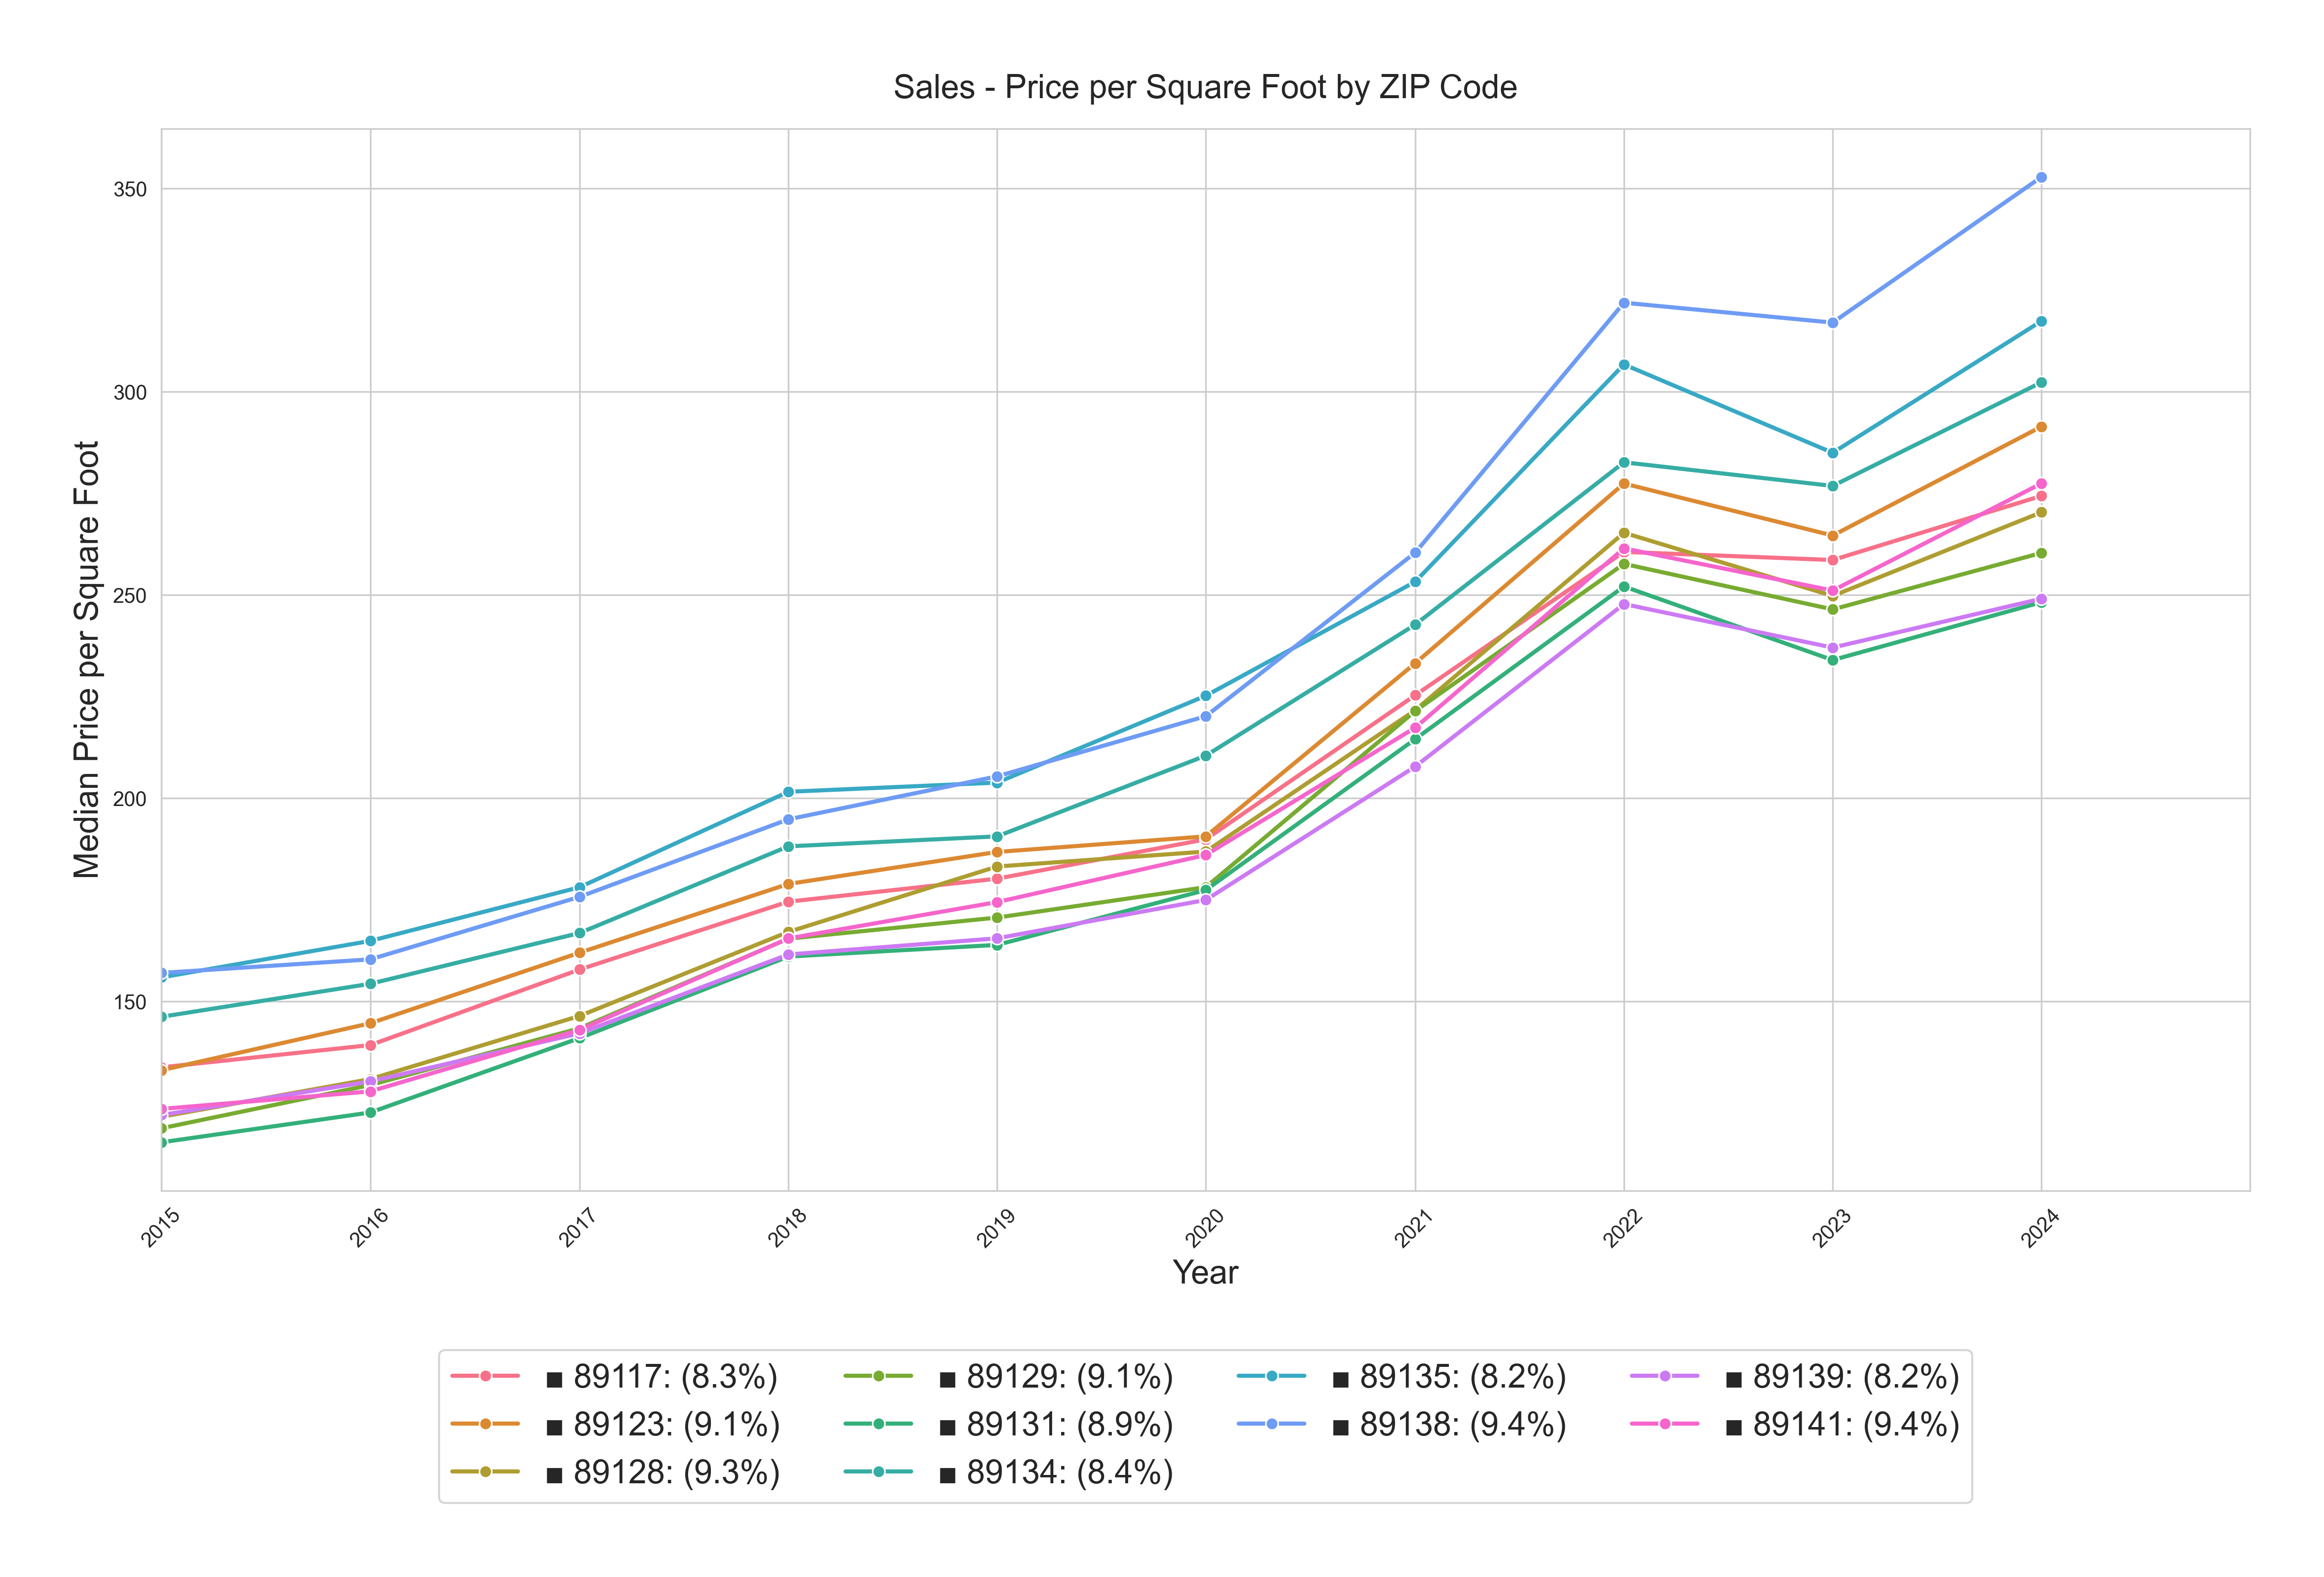
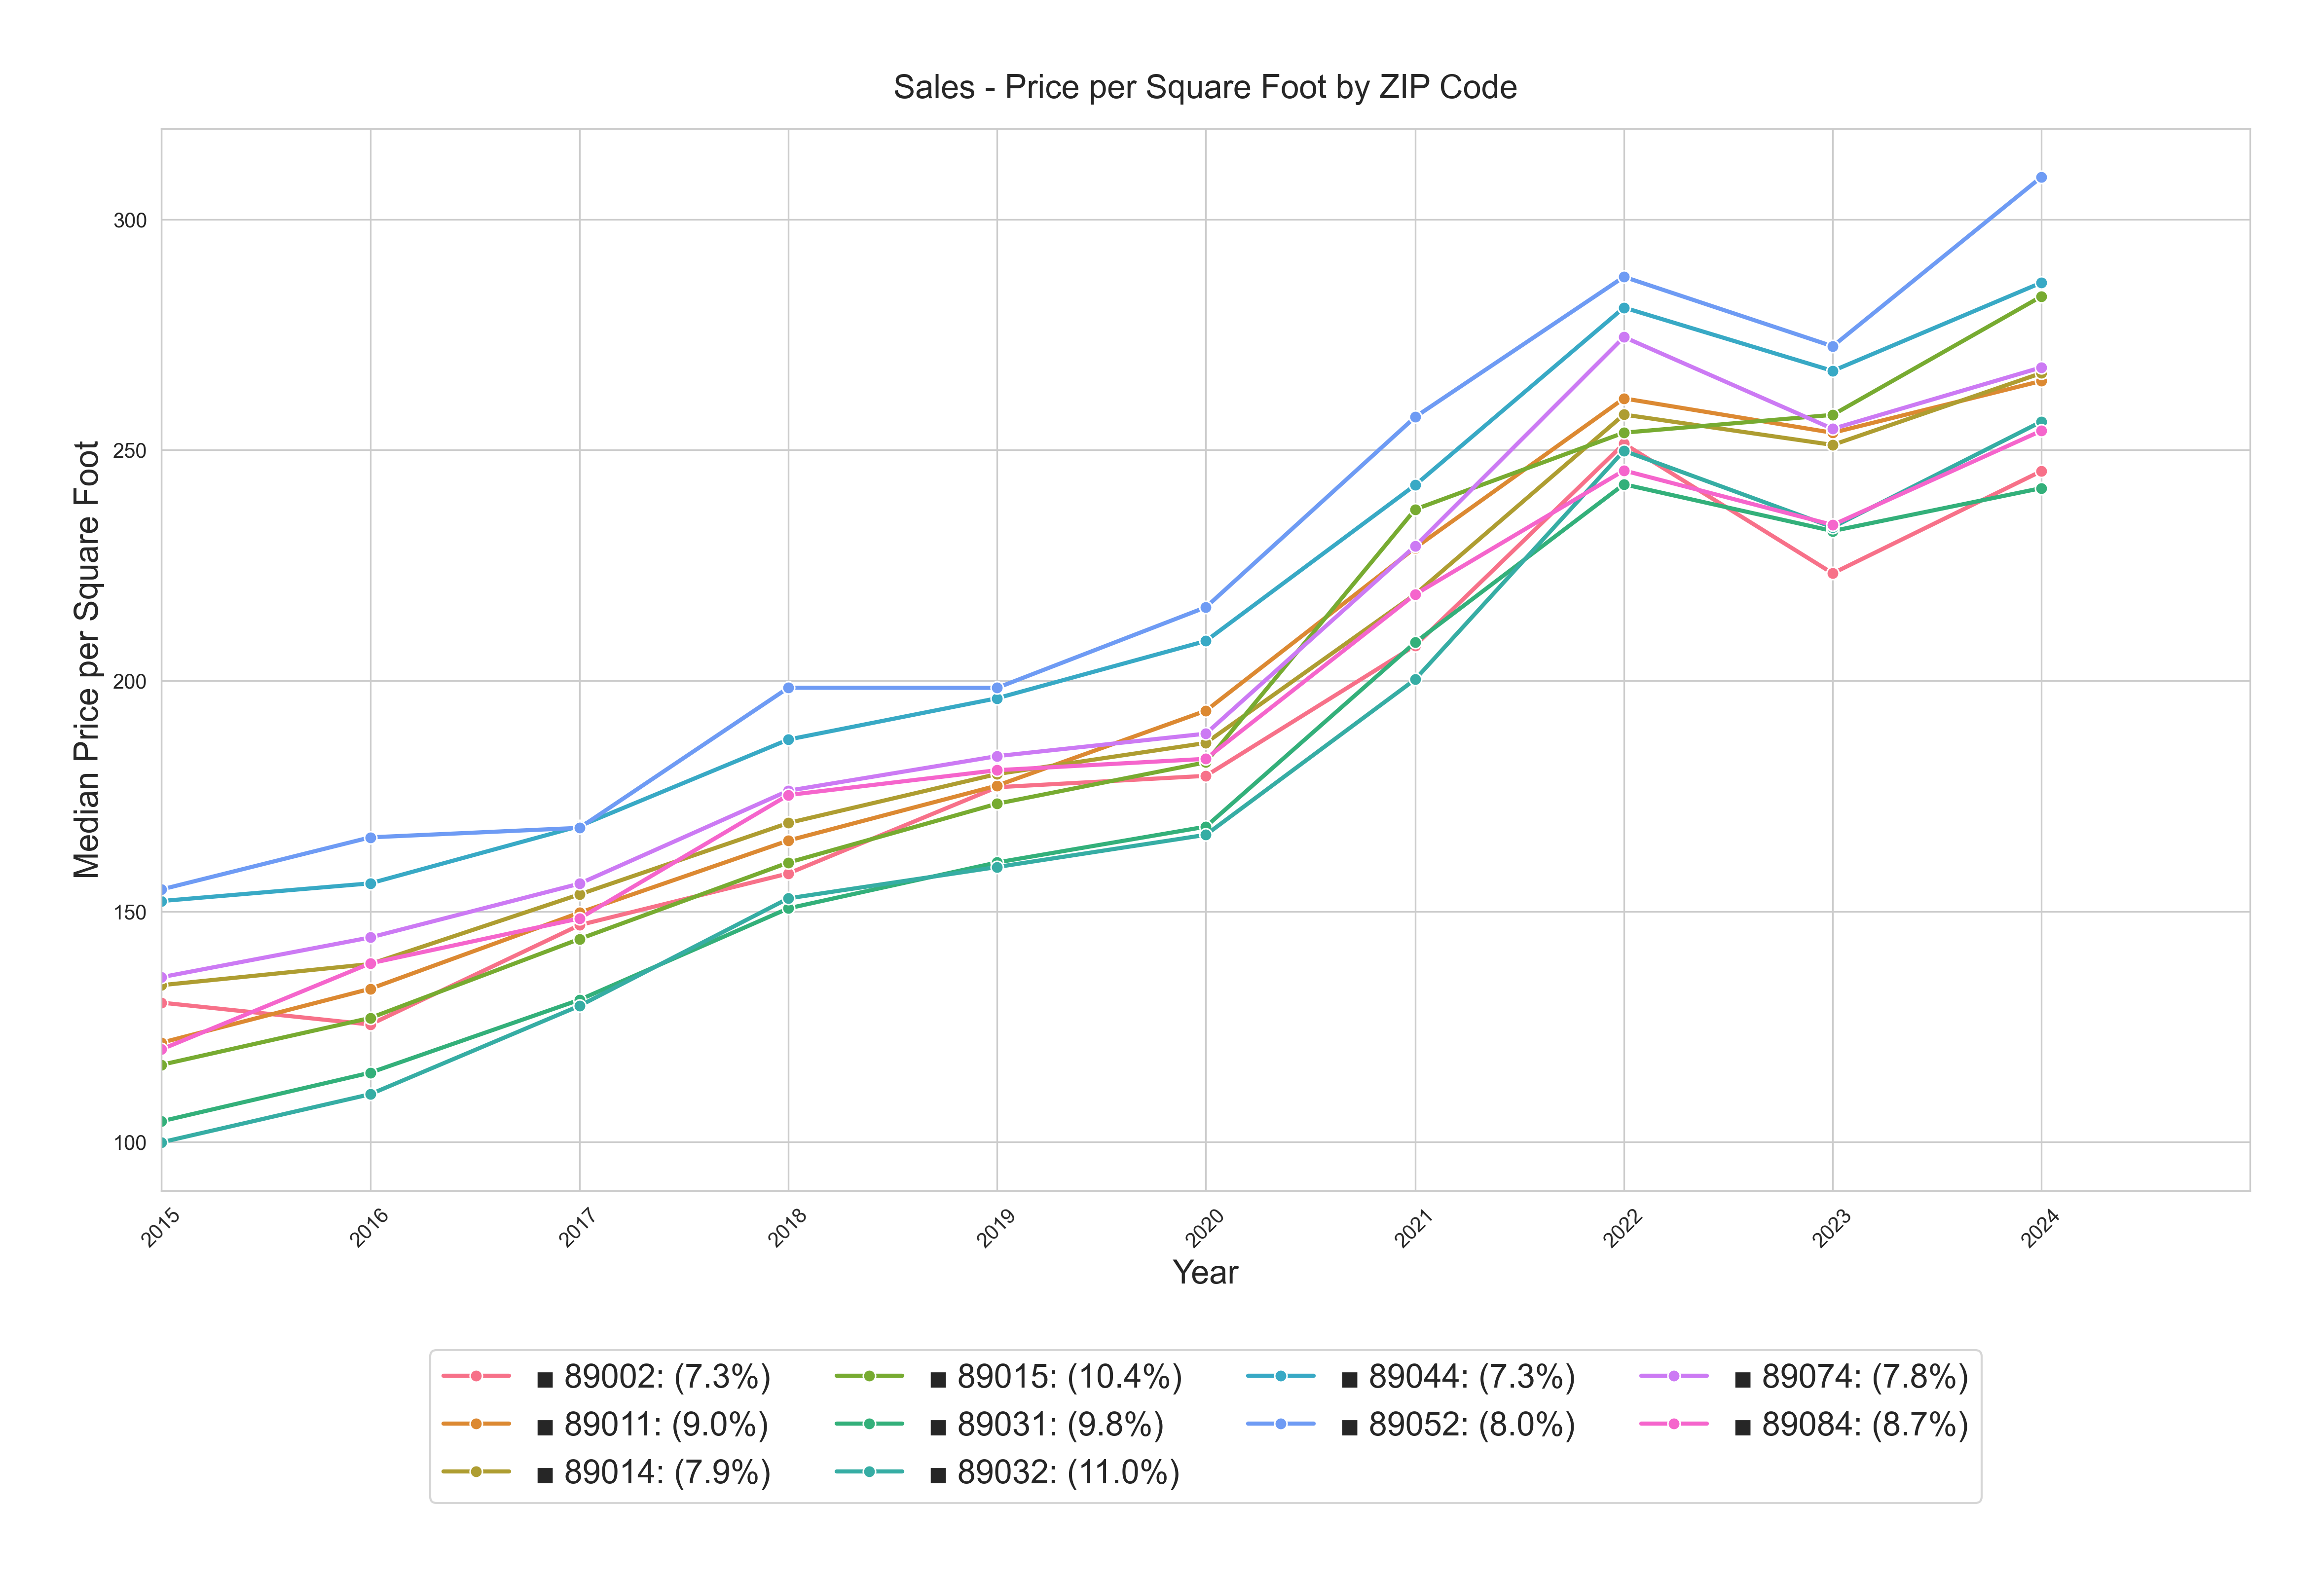
From the above charts, these zip codes appear to appreciate the fastest among our target areas (based on annualized growth rate)
- 89032 (North Las Vegas), 11.0%
- 89015 (Henderson), 10.4%
- 89143 (Centennial Hills), 9.9%
- 89031 (North Las Vegas), 9.8%
- 89138 (Summerlin), 9.4%
- 89141 (Blue Diamond, Southern Highlands), 9.4%
- 89128 (Summerlin), 9.3%
- 89123 (Silverado Ranch), 9.1%
- 89129 (Northwest), 9.1%
5-Year Pre-COVID $/SF by Zip Code 2015-01-01 to 2020-03-01
The COVID market frenzy and the subsequent dramatic rate hikes significantly distorted price and rent trends. To better project growth rates for the next five years, we should examine the pre-COVID period from 2015-01-01 to 2020-03-01. The charts below show the median price trend during this more stable period.
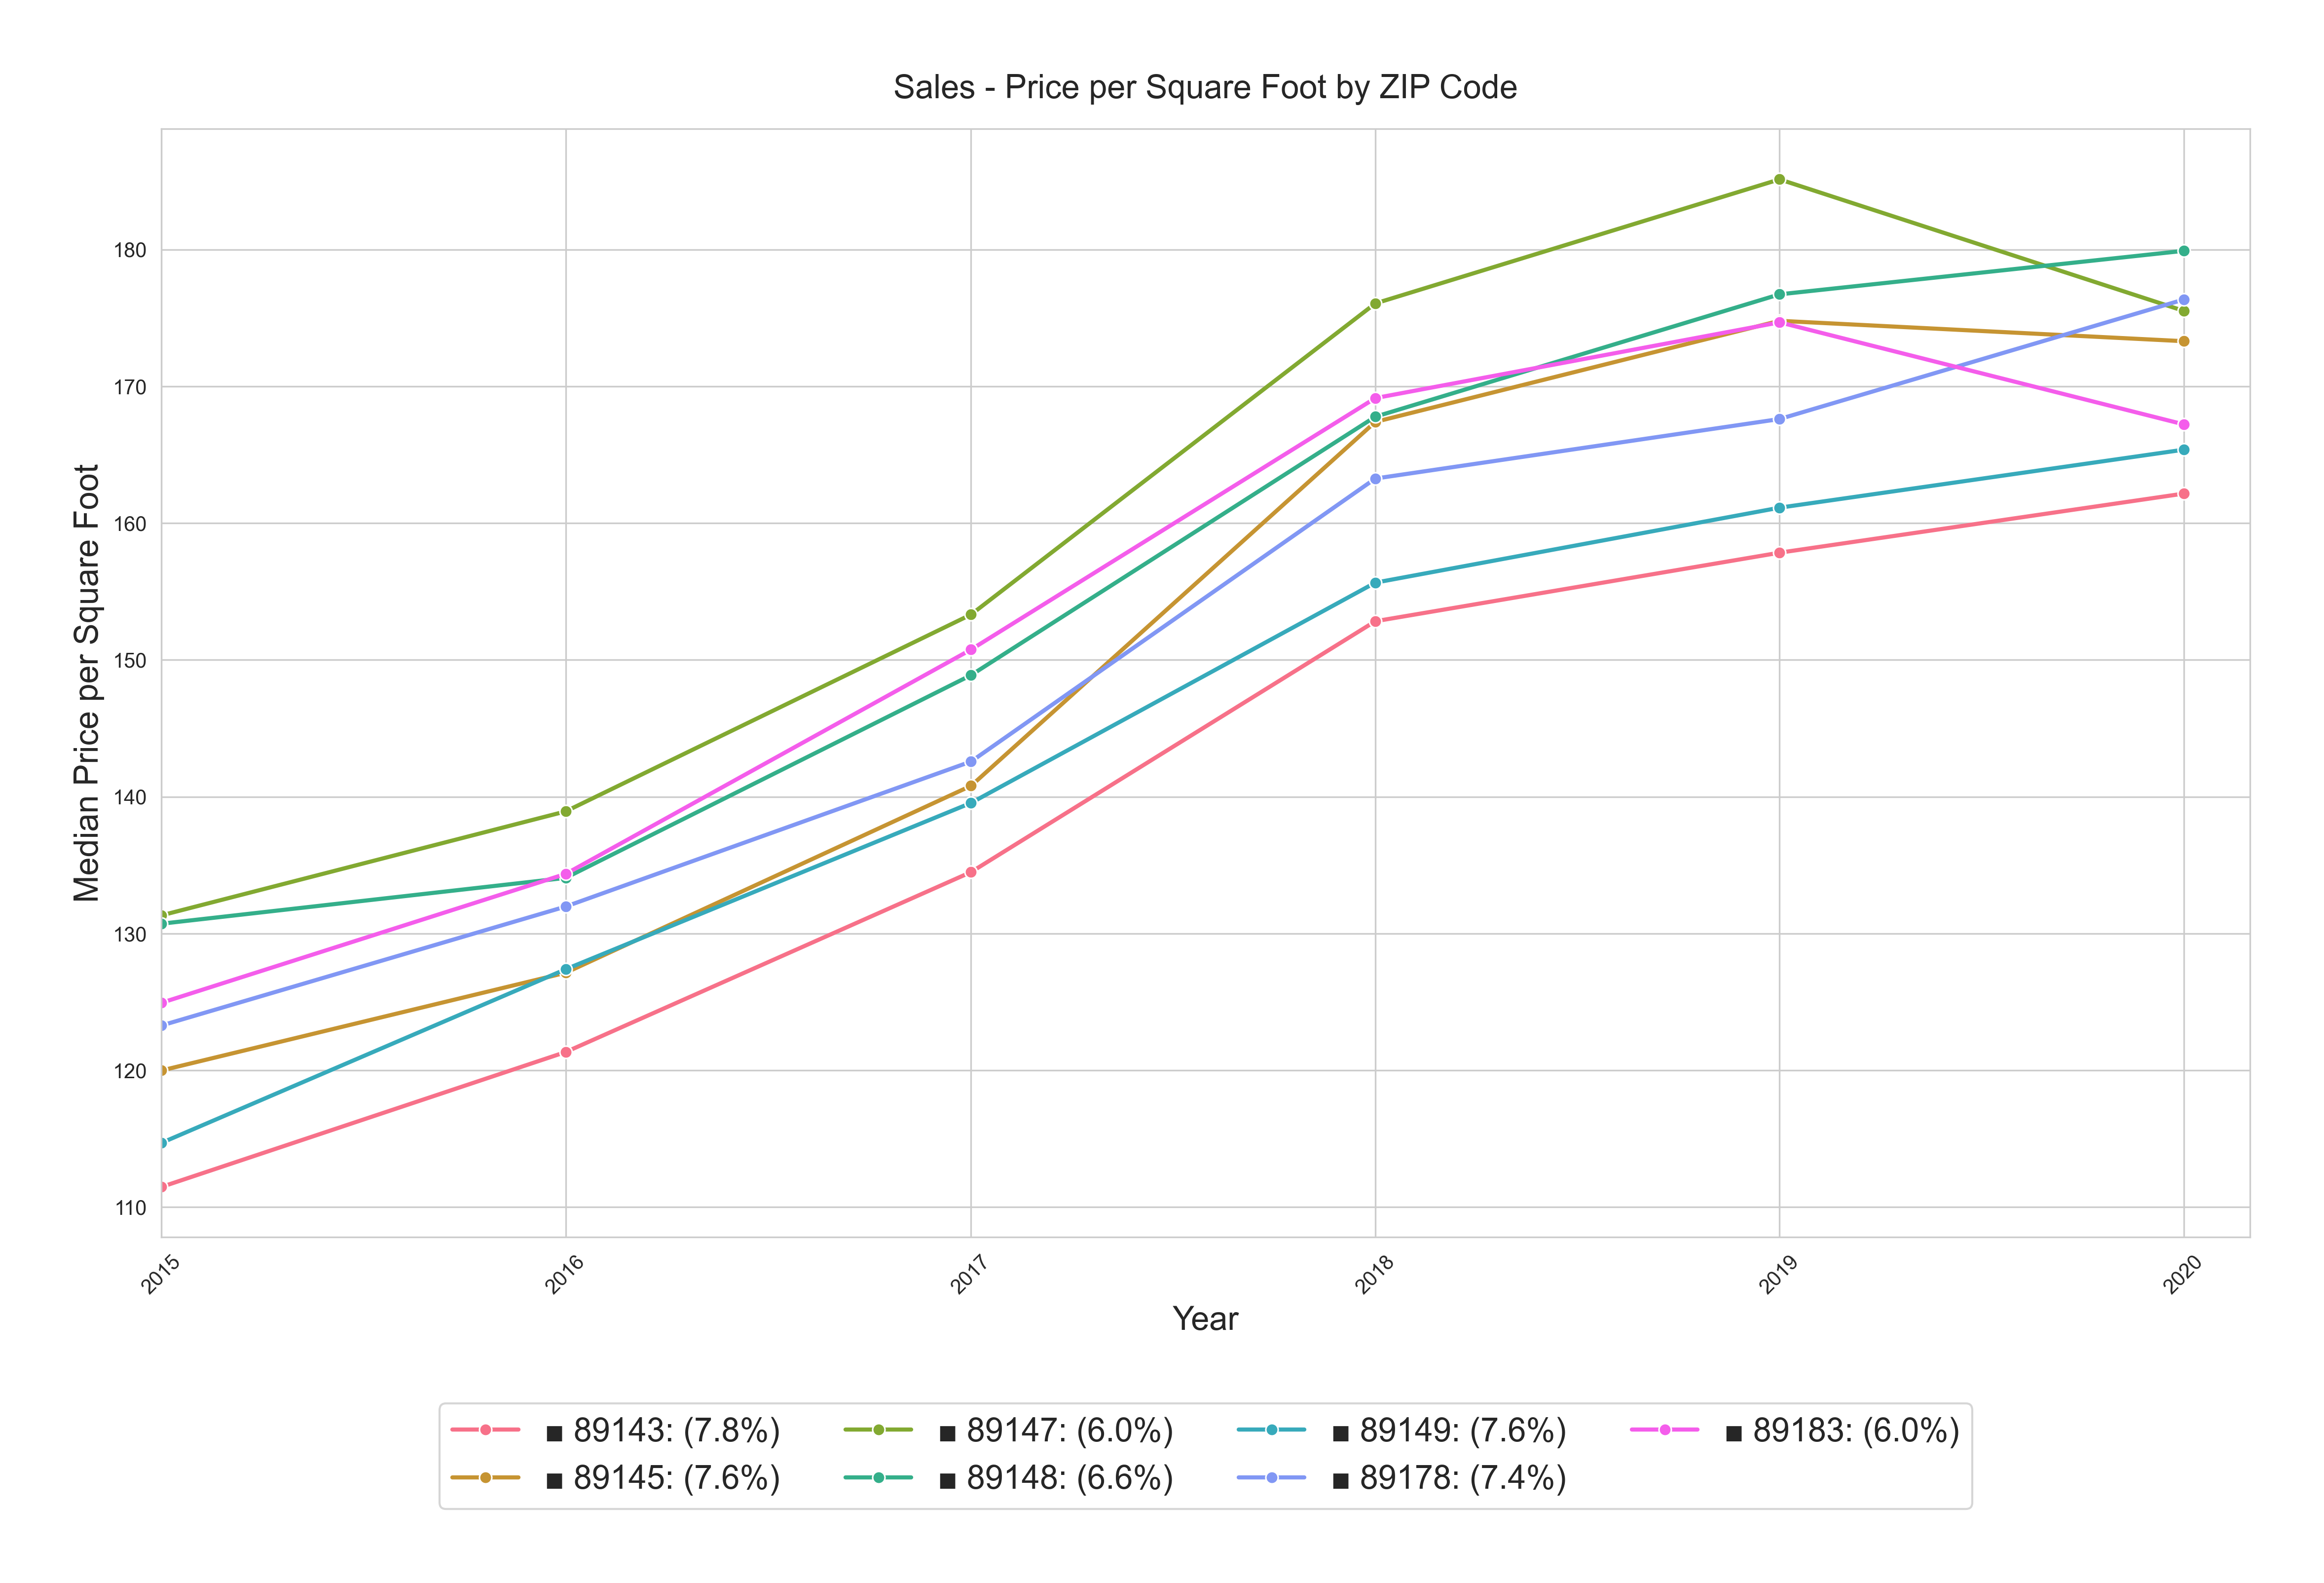
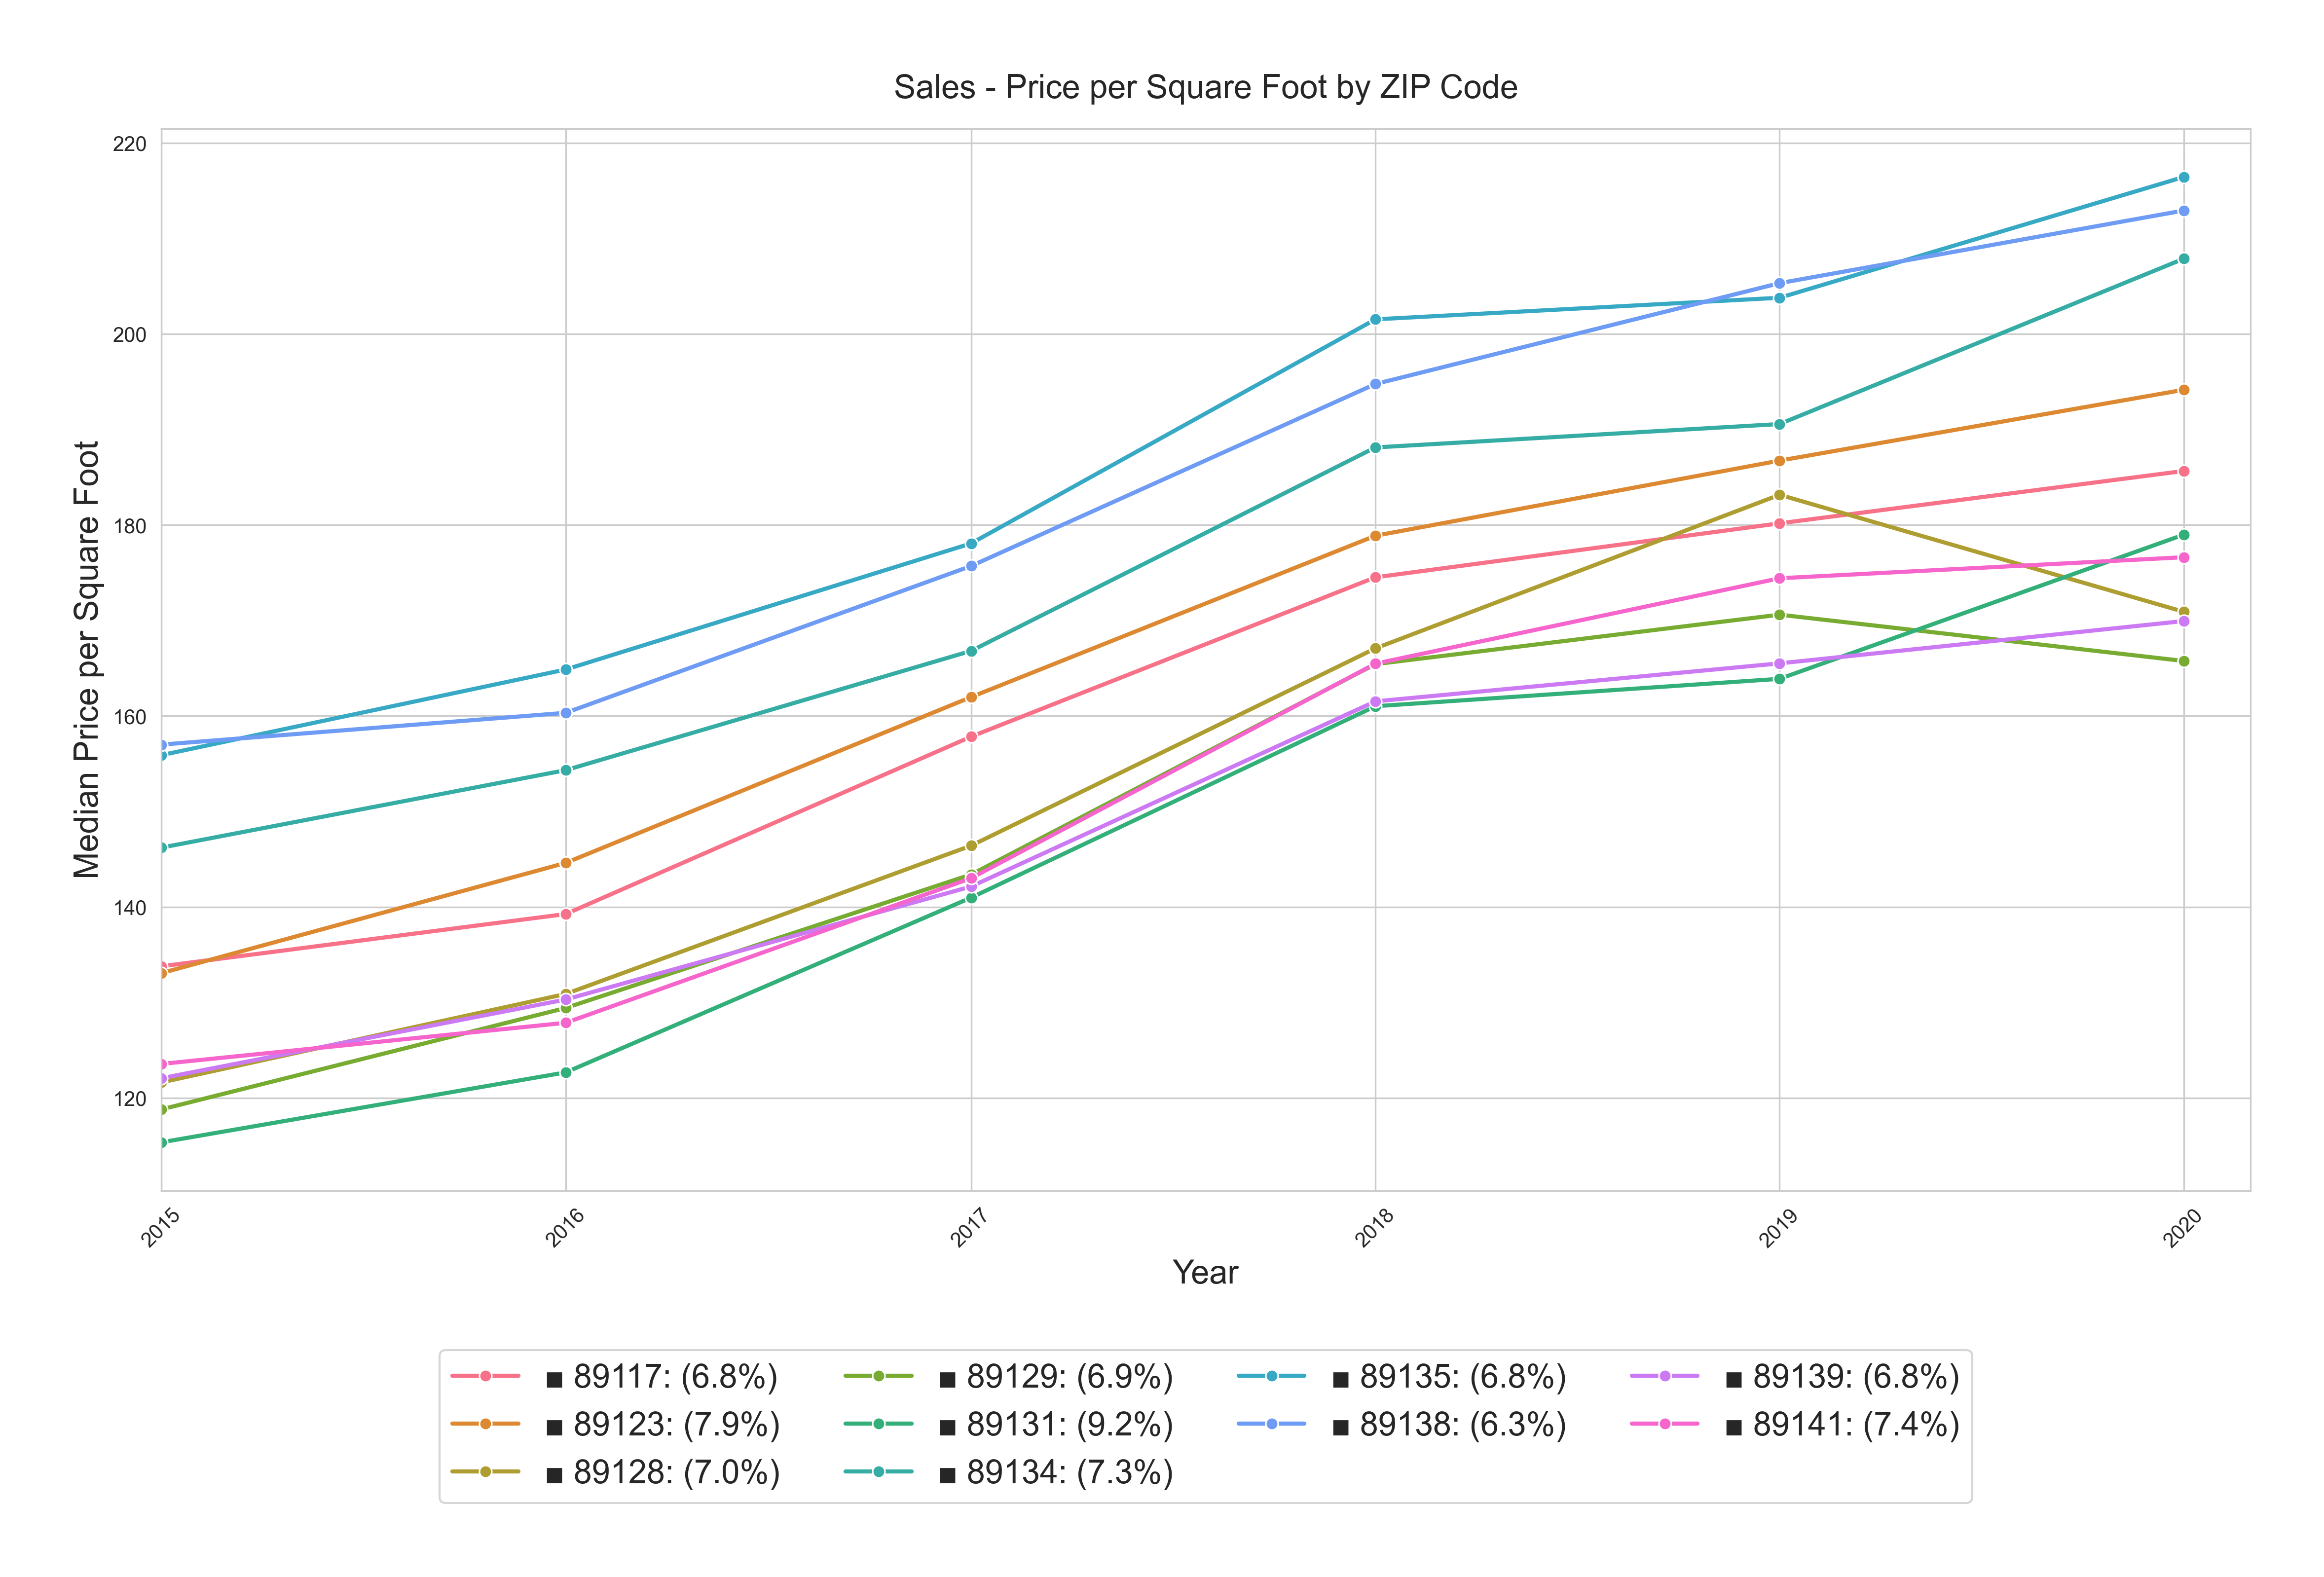

The higher appreciating zip codes during the 5-year pre-Covid period appear to be:
- 89032 (North Las Vegas), 10.2%
- 89015 (Henderson), 9.7%
- 89131 (Centennial Hills), 9.2%
- 89031 (North Las Vegas), 9.2%
- 89084 (Aliante), 8.5%
- 89011 (Henderson), 8.1%
- 89123 (Silverado Ranch), 7.9%
- 89141 (Blue Diamond, Southern Highlands), 7.4%
- 89134 (Summerlin), 7.3%
Rent Growth
10-Year Rents $/SF by Zip Code 2015-01-01 to 2024-12-31
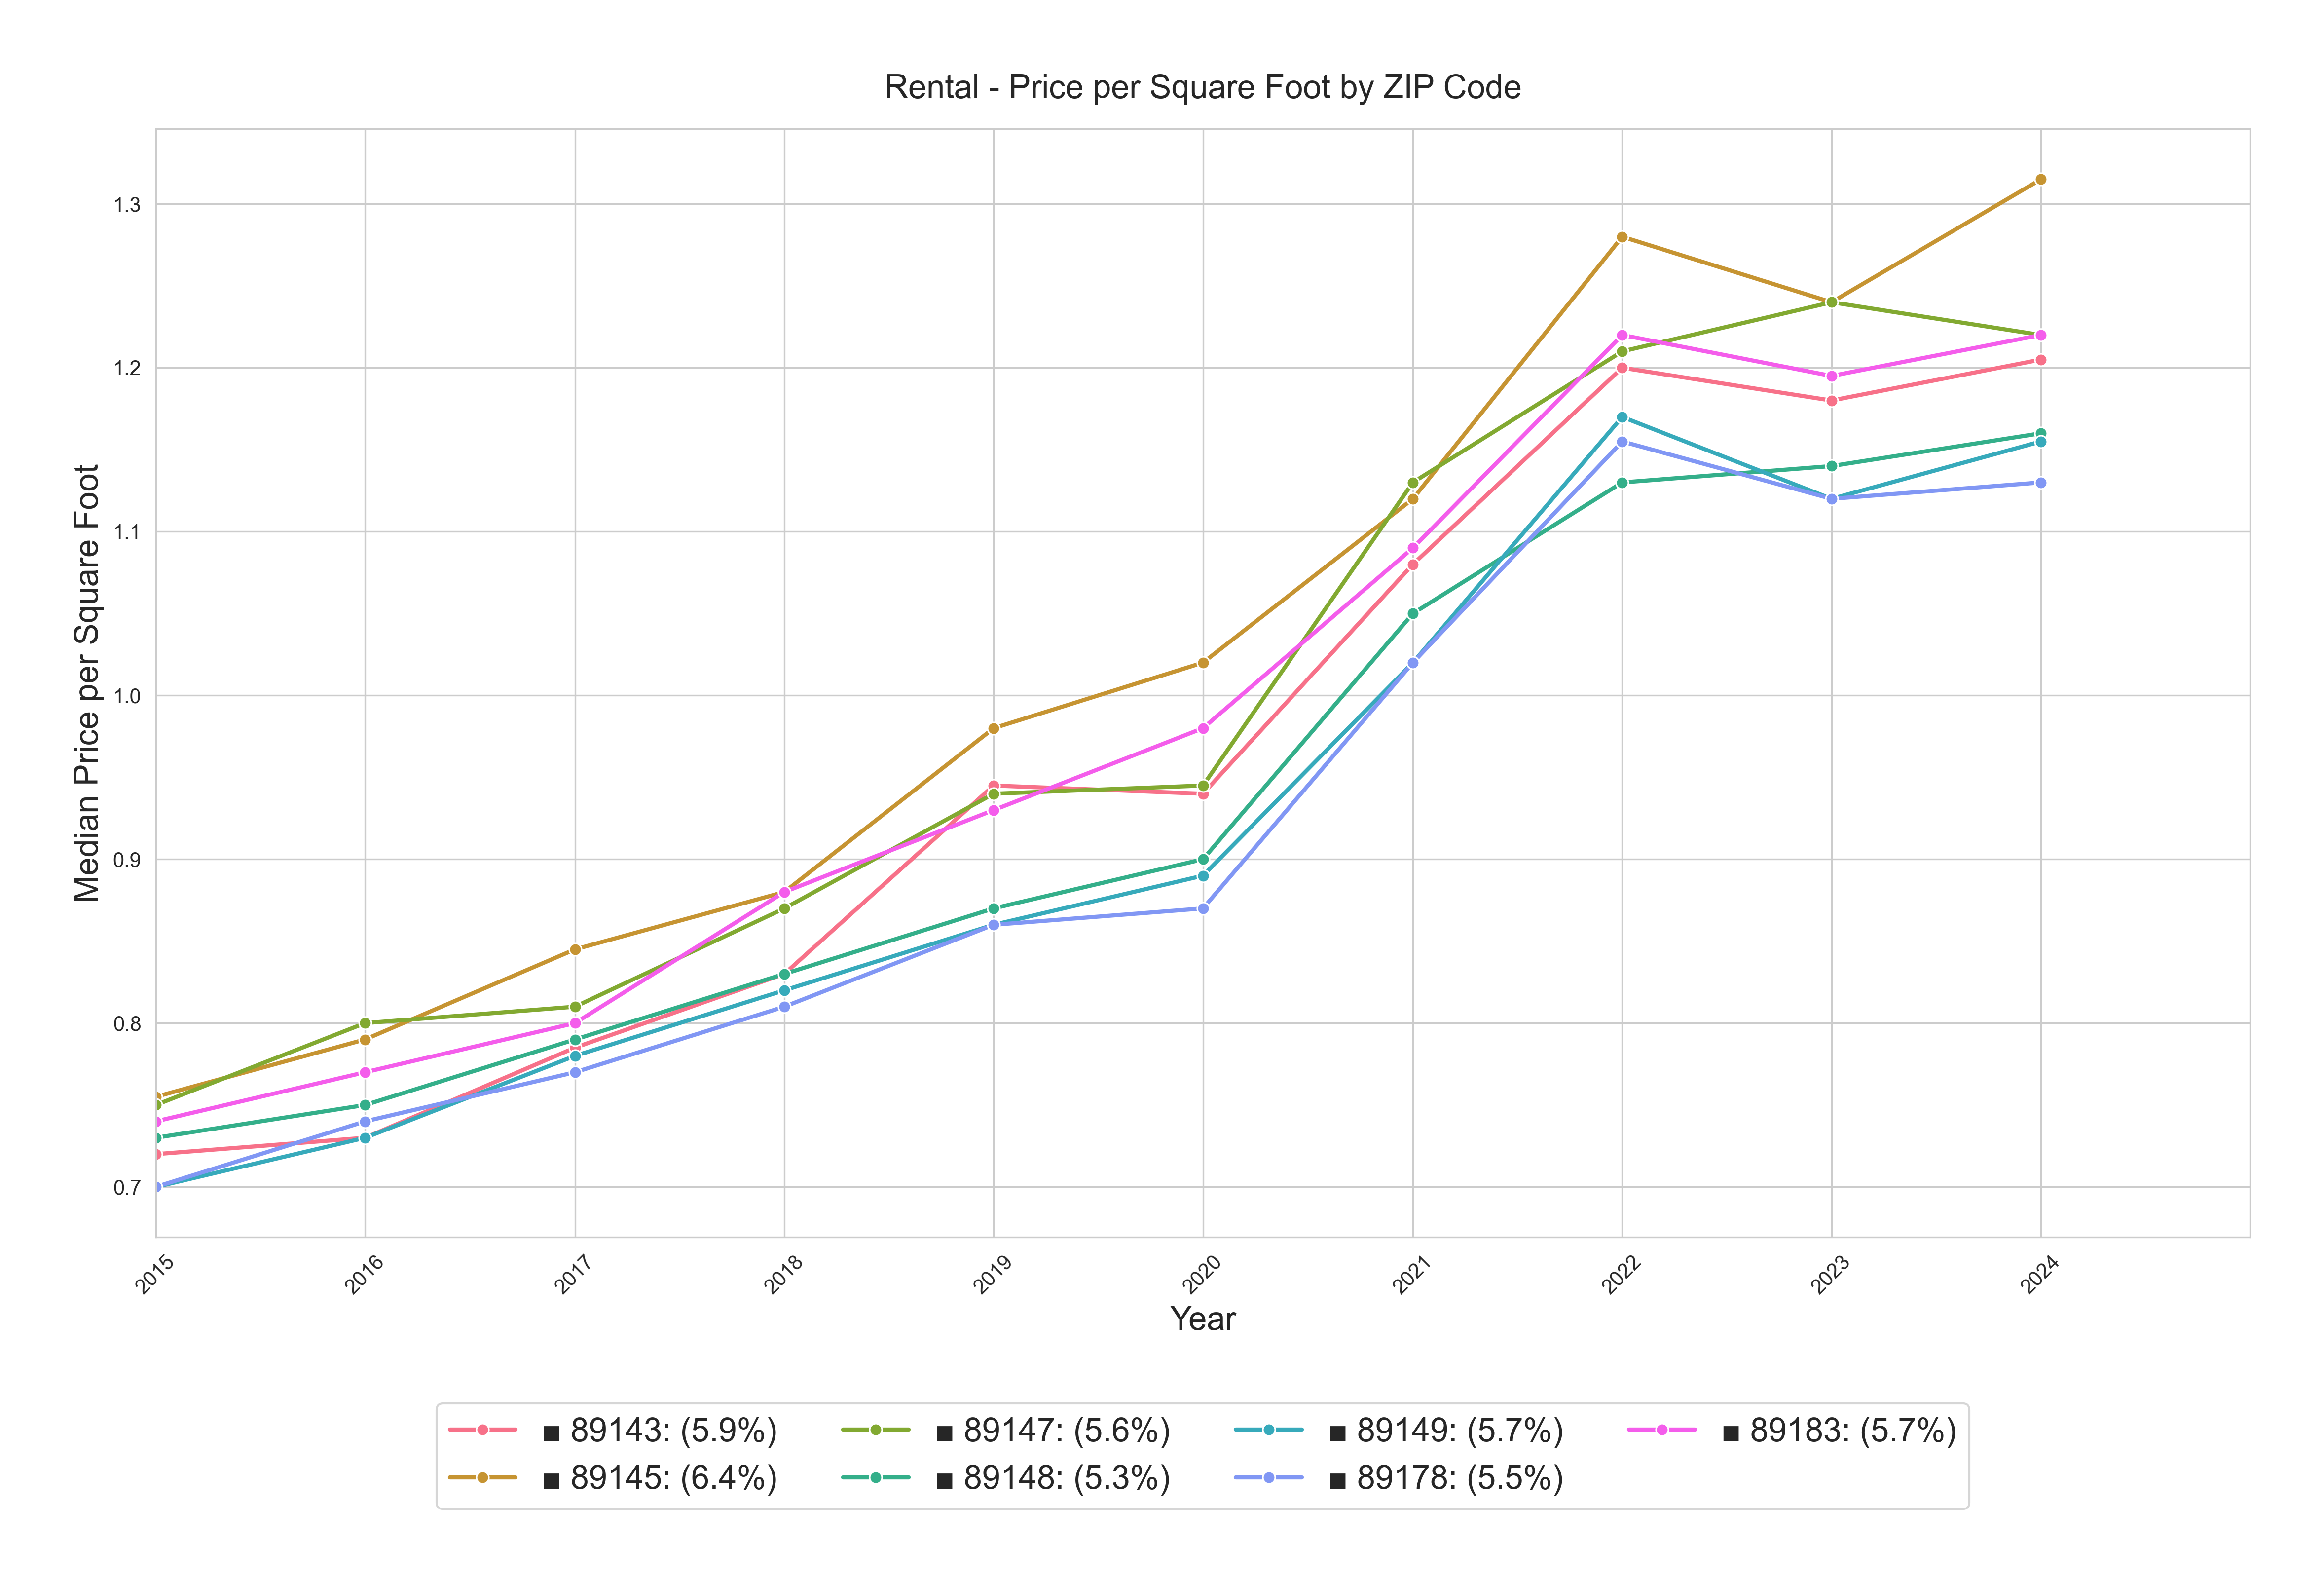
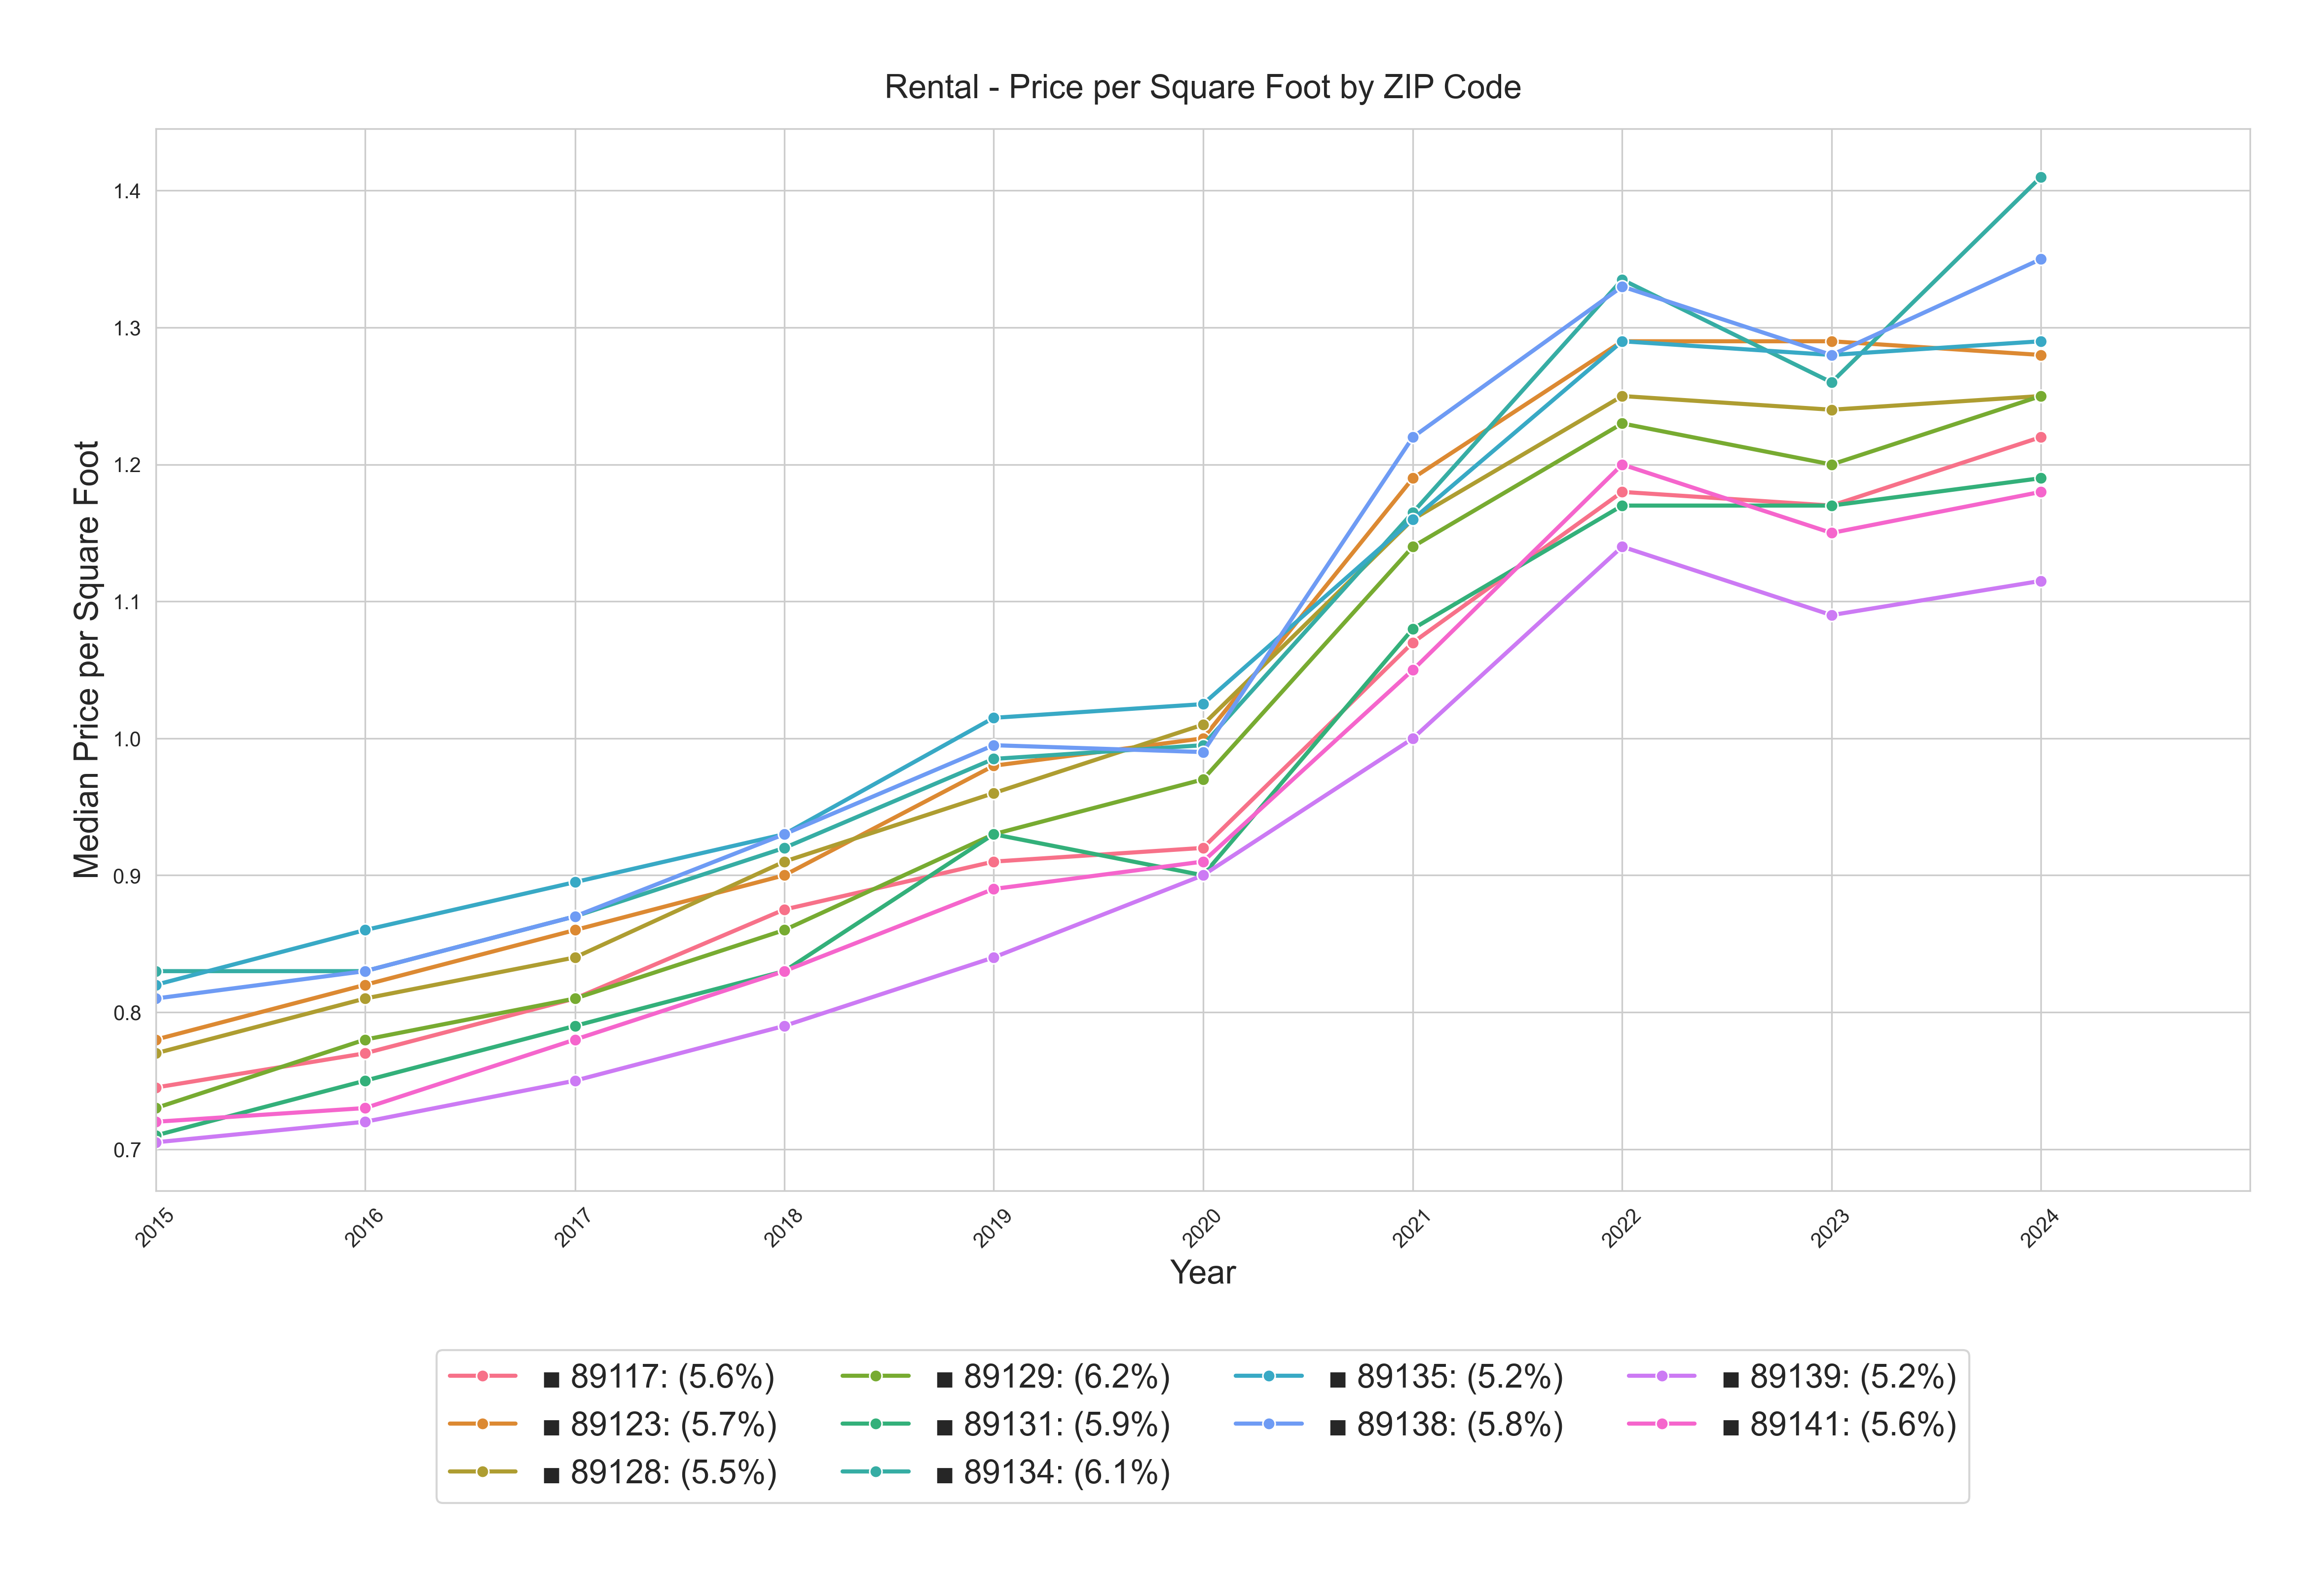
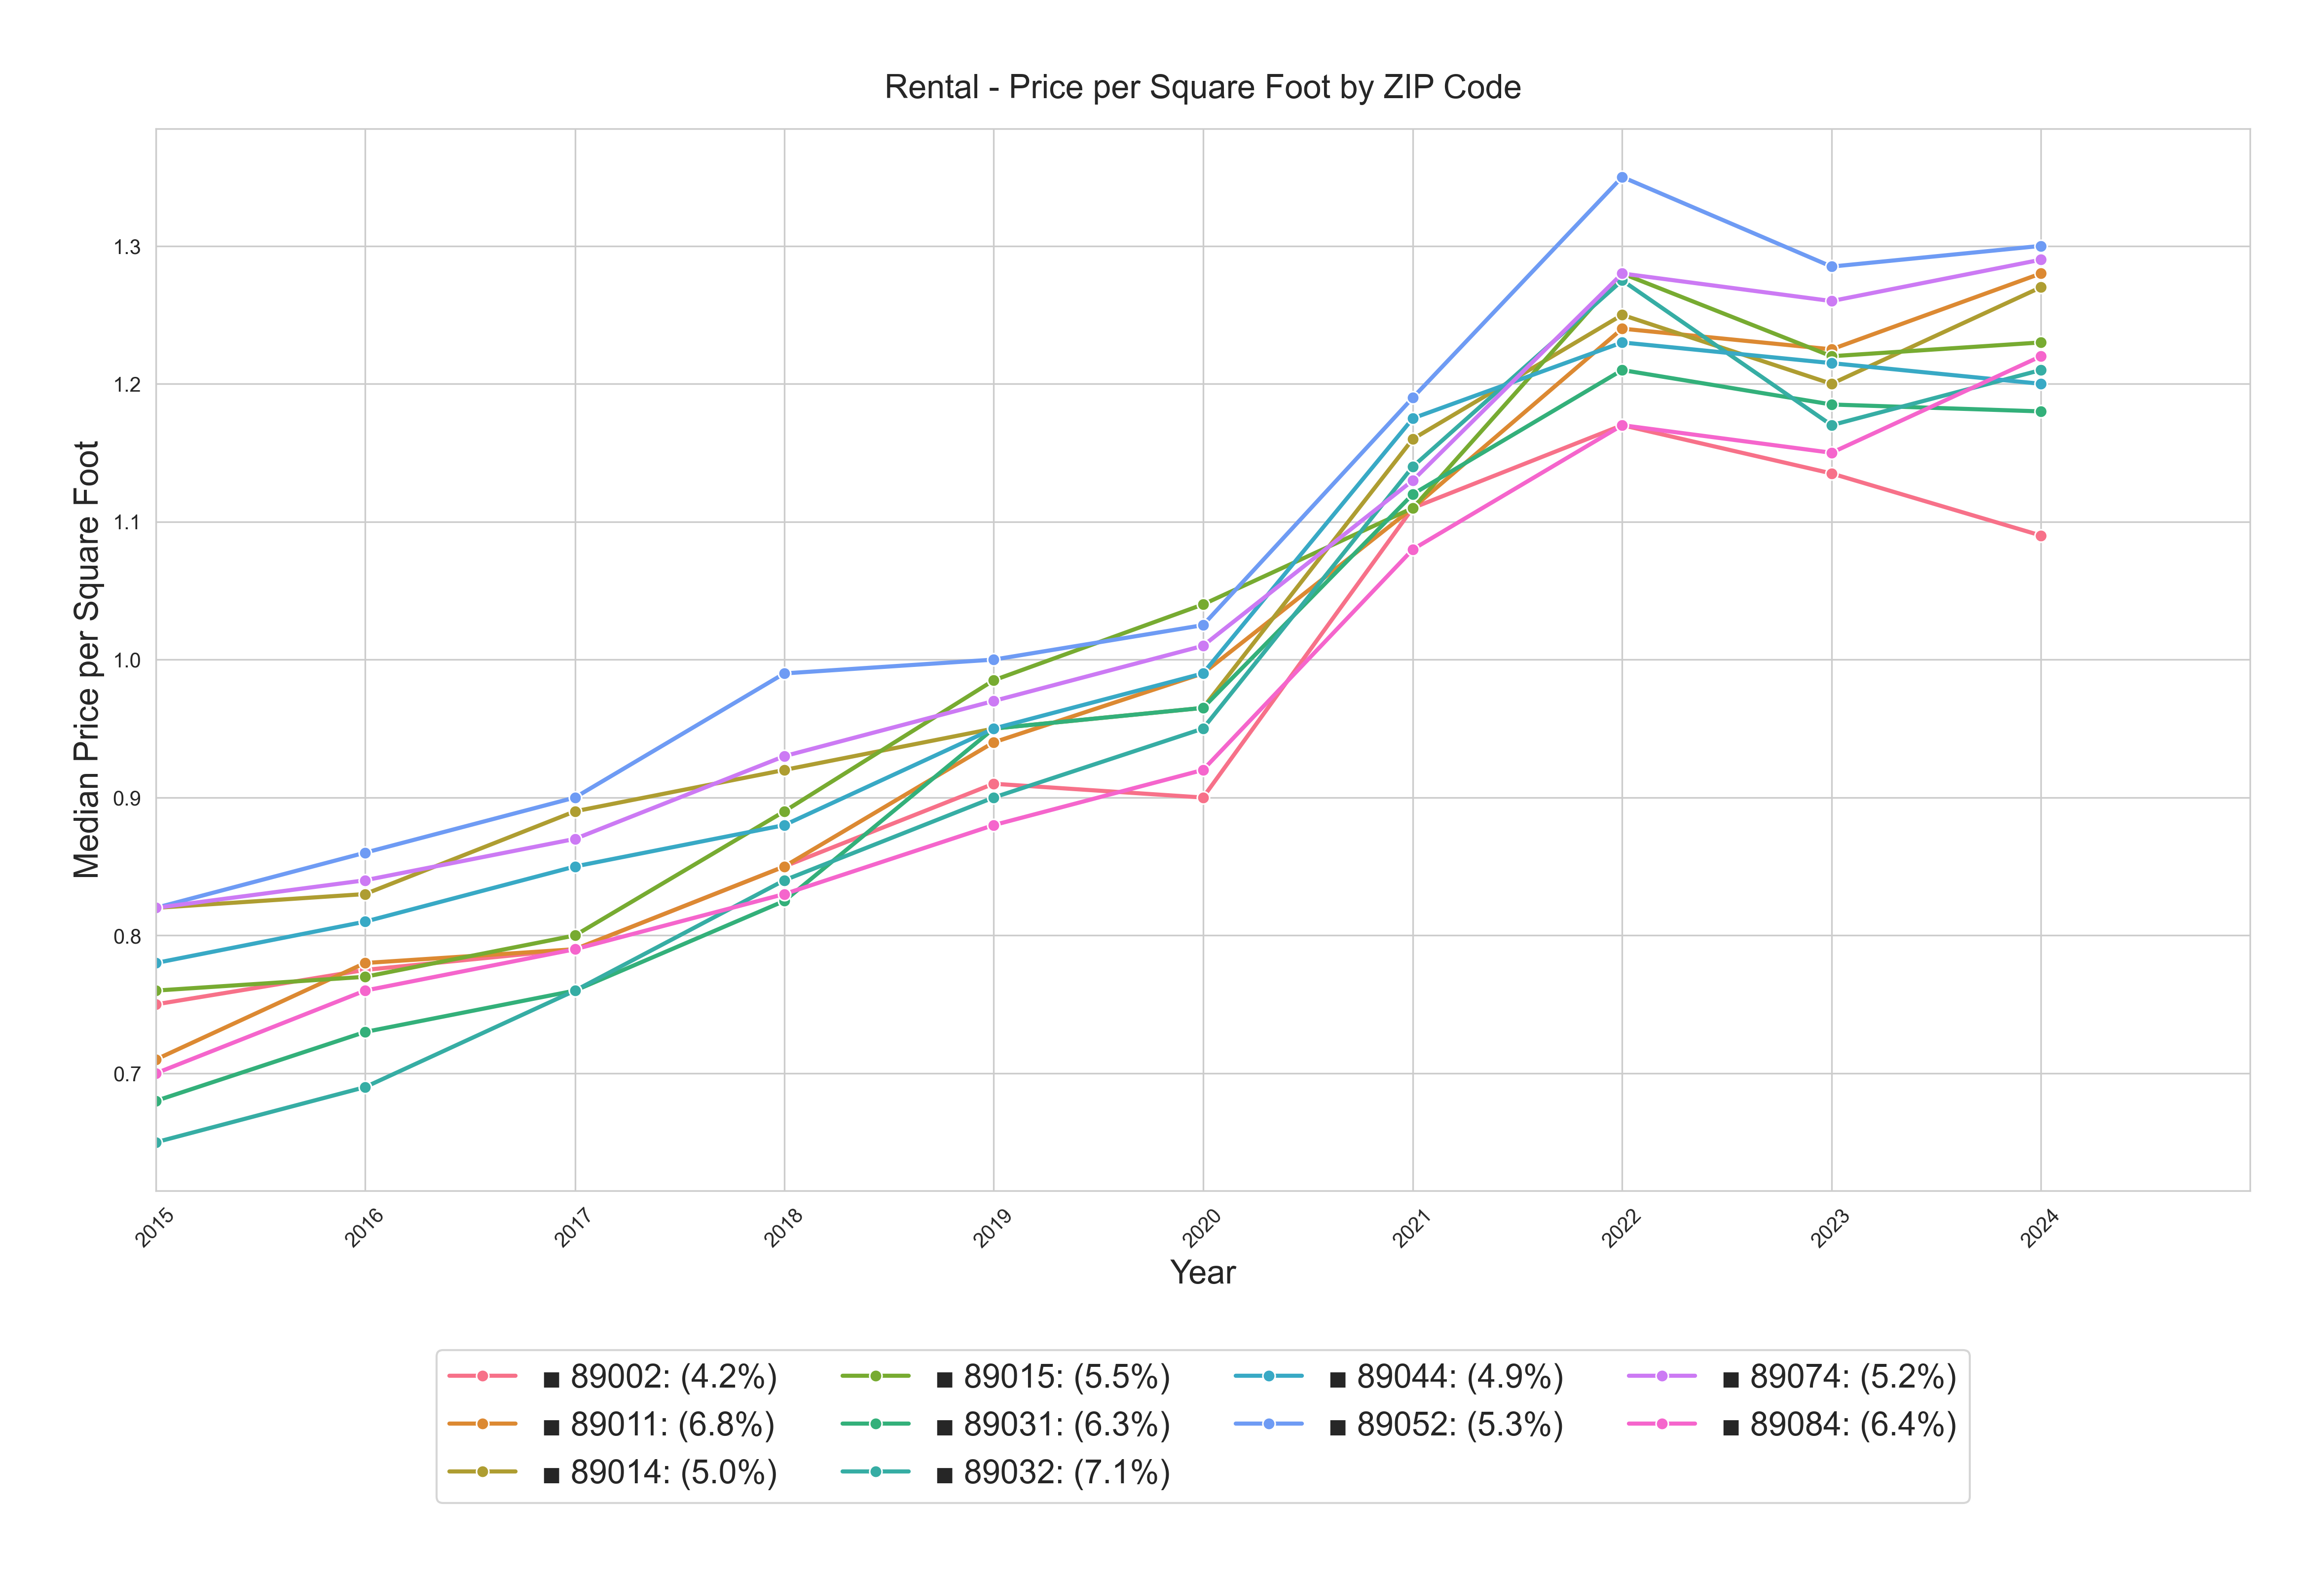
The higher rent growth zip codes for the last 10 years appear to be:
- 89032 (North Las Vegas), 7.1%
- 89011 (Henderson), 6.8%
- 89084 (Aliante), 6.4%
- 89145 (Summerlin adjacent), 6.4%
- 89031 (North Las Vegas), 6.3%
- 89134 (Summerlin), 6.1%
5-Year Pre-Covid Rents Trend $/SF by Zip Code 2015-01-01 to 2020-03-01
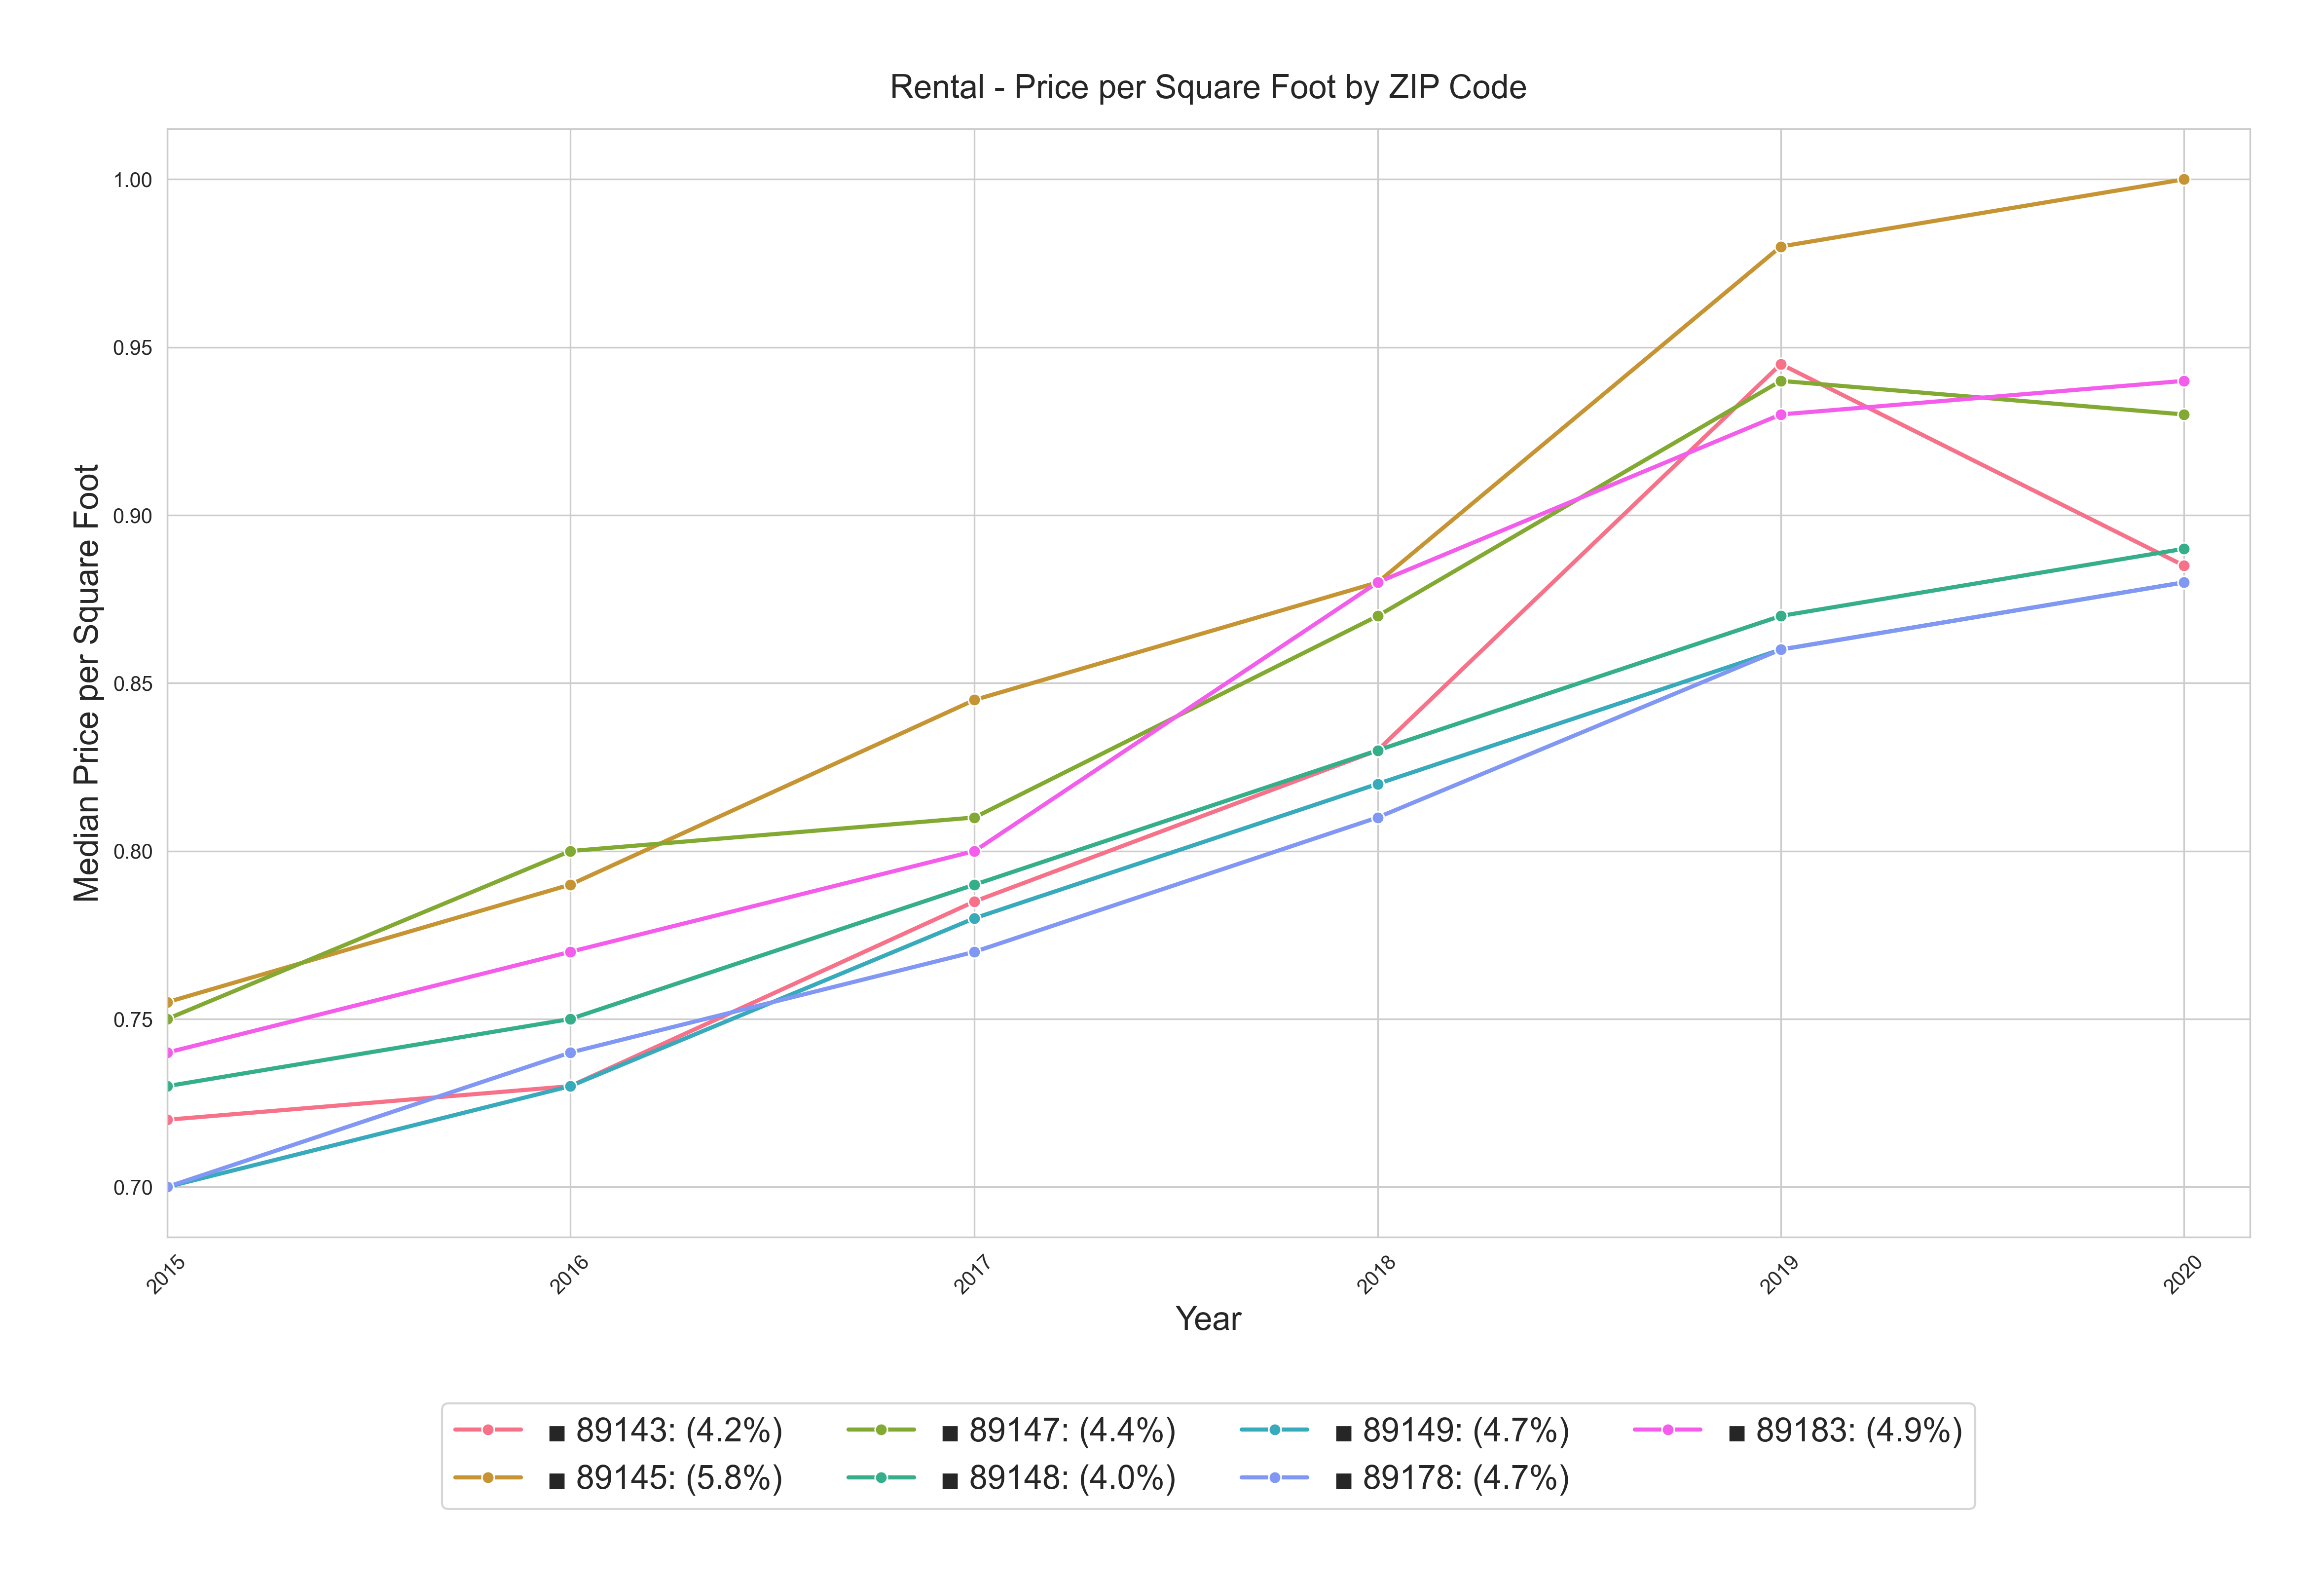
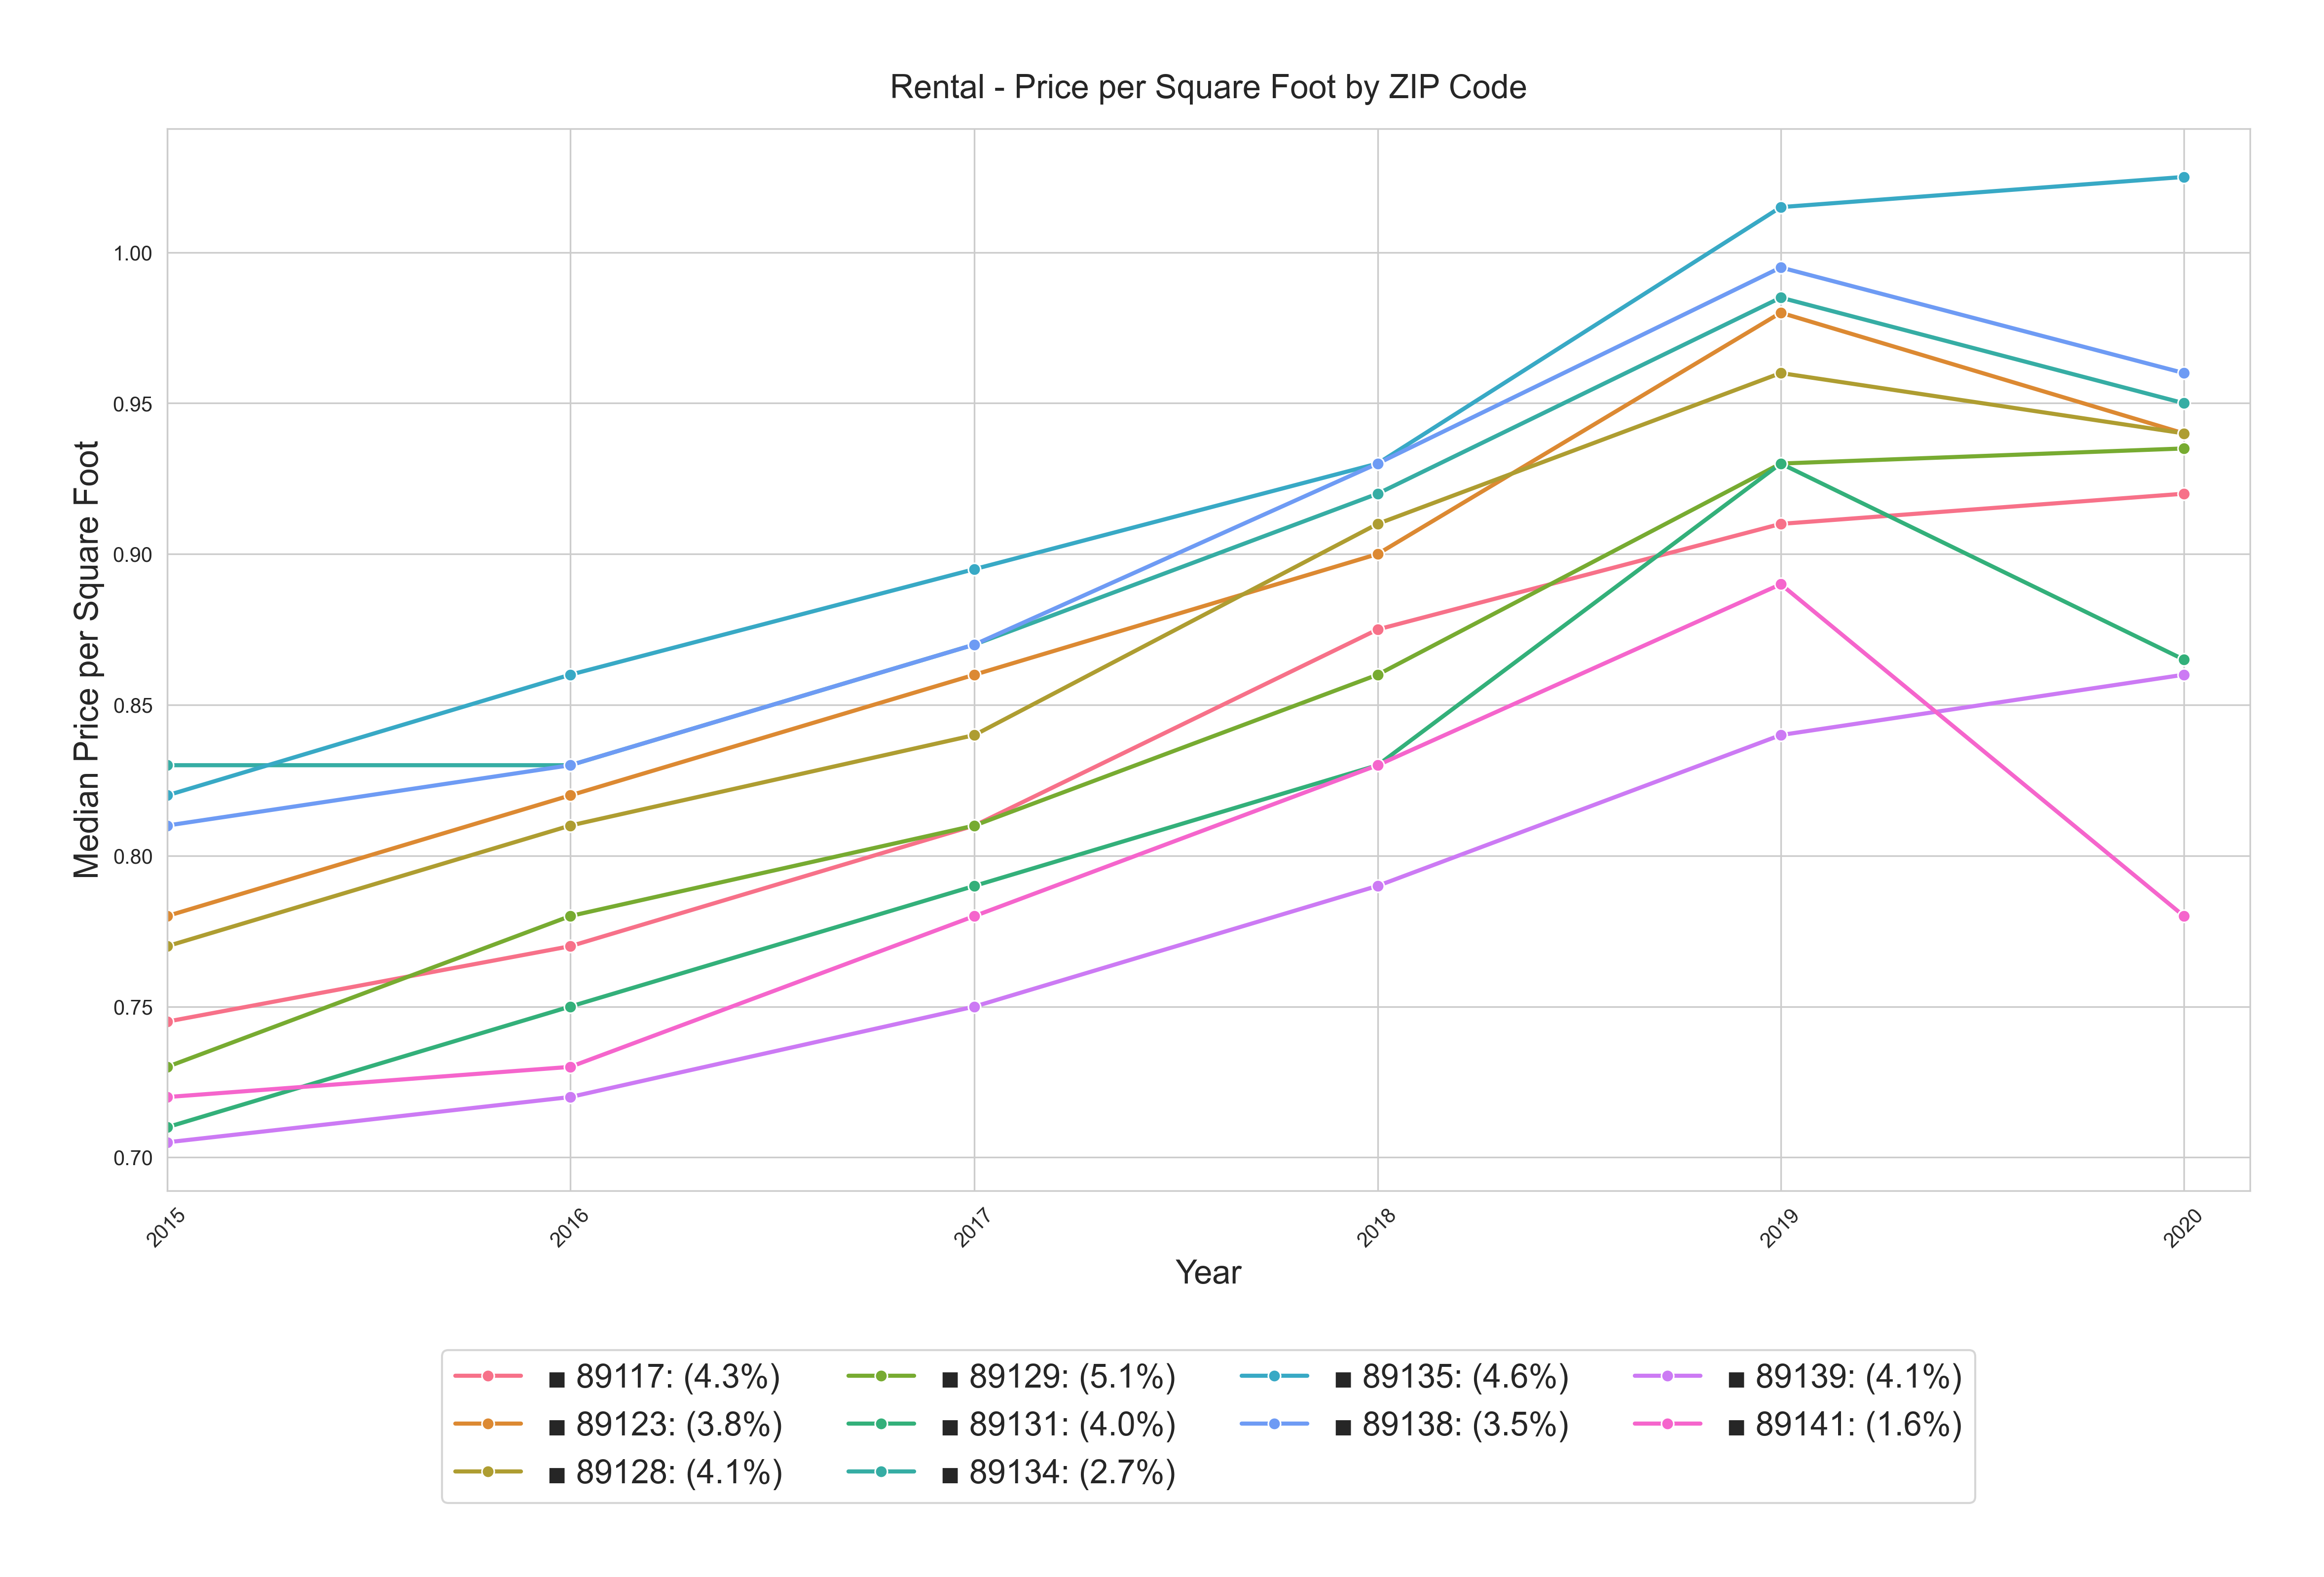
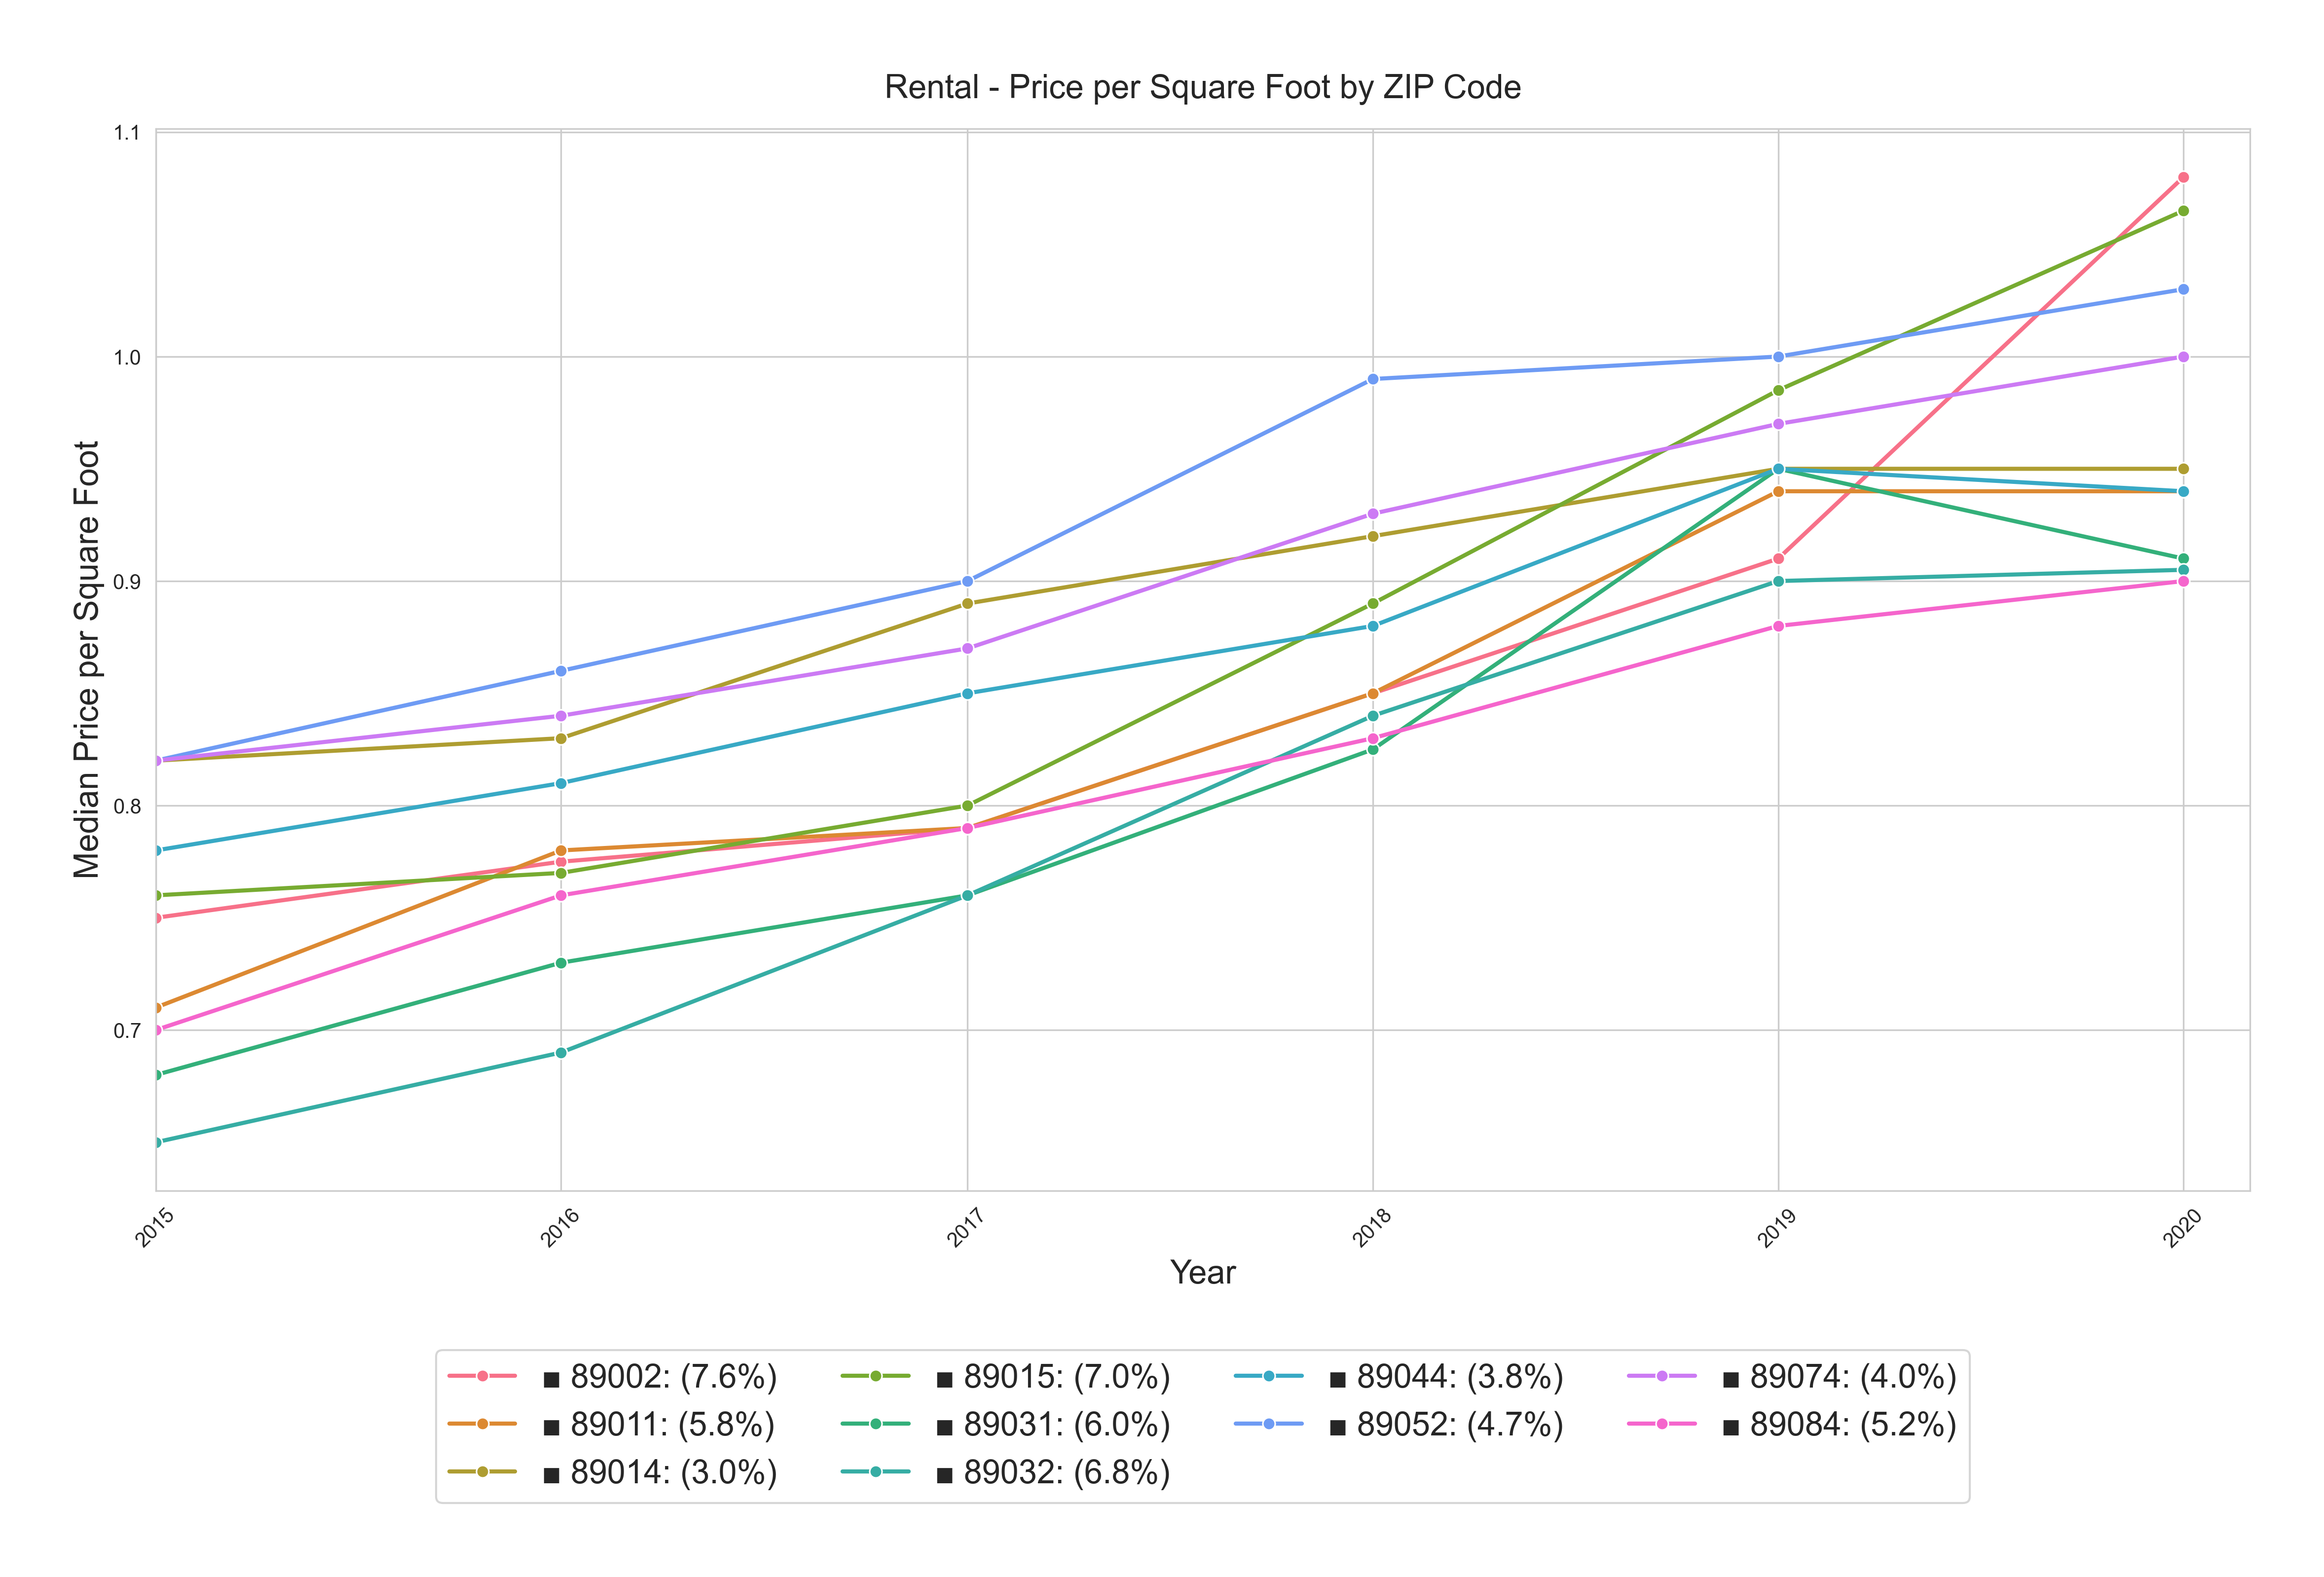
The faster rent growth zip codes during the 5-year pre-Covid period appear to be:
- 89002 (Henderson), 7.6%
- 89015 (Henderson), 7.0%
- 89032 (North Las Vegas), 6.8%
- 89031 (North Las Vegas), 6.0%
- 89011 (Henderson), 5.8%
- 89145 (Summerlin adjacent), 5.8%
Concluding Thoughts
If past performance is any indication of future performance, the data shows that properties in certain parts of North Las Vegas, Henderson, Centennial Hills, Silverado Ranch, and certain Summerlin areas may appreciate faster than the other areas of our target area. Properties in Henderson, certain parts of North Las Vegas, and adjacent to Summerlin may provide faster rent growth.
However, we recommend not using this data for your property search criteria. A zip code average of an area does not represent an individual property’s characteristics. Each property should be evaluated based on its characteristics and overall quality as an investment.
- Eric Fernwood
- [email protected]
- 702-358-8884
