Market Trends & Data
Market News & Data
General Info
Real Estate Strategies

Landlording & Rental Properties
Real Estate Professionals
Financial, Tax, & Legal


Real Estate Classifieds
Reviews & Feedback
Updated 10 months ago on . Most recent reply
- Real Estate Broker
- Greater Charlotte NC and Charleston, SC areas
- 58
- Votes |
- 105
- Posts
Are interest rate cuts finally on the horizon? See the latest national housing stats!
Friday July 12, 2024 - by Scott Brixley
Real Estate News in Brief
Rate cuts are definitely coming. Fed Chairman Jerome Powell sounded a bit more dovish in his testimony to Congress, and then the CPI inflation report for June came in lower than expected. It is very nice to see 30-yr mortgage rates moving below 7%!
Inventory keeps rising. For the week ended June 29, the nationwide inventory of homes for sale was up 38% year-over-year, with new listings rising 11% YoY.
‘Jobs week’ delivered conflicting trends
First, the JOLTs survey (Job Openings and Labor Turnover) showed that job openings rose to 8.1 million in May. But the month-over-month increase was only the result of a large downward revision (-140,000 jobs) to the April job openings data. The hires and quits rate was basically unchanged. [Bureau of Labor Statistics]
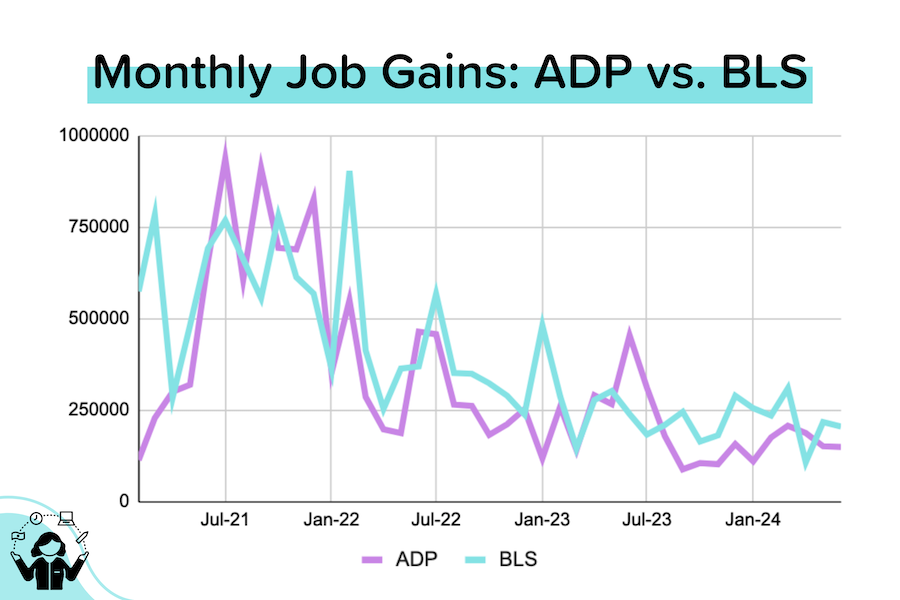
Next came ADP’s employment report, where private (non-government) jobs growth slowed for the third straight month to +150,000 in June. That was slightly below expectations. 40% of the job gains came from the leisure & hospitality industry. [ADP]
Finally we got the big BLS jobs report. The Establishment Survey (businesses + gov’t) showed that the US added 206,000 jobs in June, slightly above expectations. But the job gains reported for May and April were revised down by a combined 111,000. That’s big. How big? The initial estimate for job gains in April was 175,000. The final number is 108,000. [BLS]
Additionally, the separate Household Survey (individuals) saw the unemployment rate (“UR”) rising to 4.1%. A year ago, the UR was at 3.6%. That may not seem like a big jump, but a 50 basis points (0.5%) increase in the UR has historically been a very reliable recession indicator. [BLS]
Home price growth slows, but stays robust. On CoreLogic’s numbers, home prices rose 0.6% month-over-month in May (was +1.1% MoM in April). The data giant is now predicting 3% price growth over the next 12 months. [CoreLogic]
Jerome Powell’s testimony to Congress. While the Fed Chairman remained balanced in his comments, he did sound a bit more dovish: “Reducing policy restraint too late or too little could unduly weaken economic activity and employment.” [Federal Reserve]
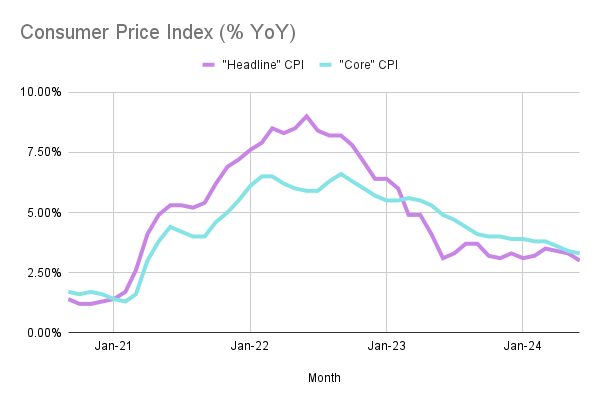
Great news on CPI. The “headline” CPI (Consumer Price Index = inflation) for June declined 0.1% month-over-month, and the “core” CPI (excluding food & fuel) rose only 0.1% MoM. Both were better (that is, lower) than expected, meaning that annual “headline” inflation dropped to 3.0% YoY and annual “core” inflation eased to 3.3% YoY. [Source: BLS]
 Where Are We Now?
So many numbers are thrown around in the media that it’s not always easy to understand what’s happening in a historical context. Hopefully, this provides perspective.
Keep in mind
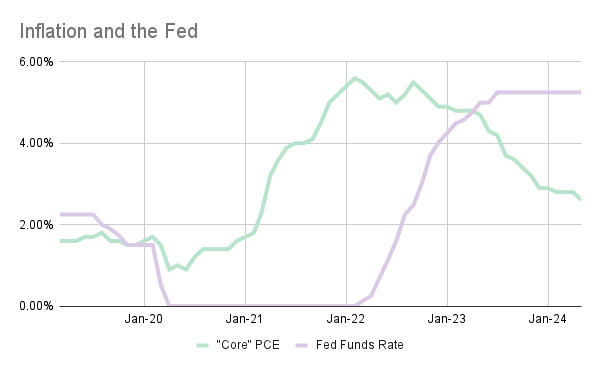
- The Fed started hiking rates in March 2022, and only stopped tightening in July 2023, having lifted short-term interest rates by 525 basis points or 5.25%.
- Average 30-yr mortgage rates started moving aggressively upward a bit earlier (in January 2022) and only peaked (at just over 8%) in October 2023.
- “Core” PCE (the Fed’s favorite inflation gauge) peaked at 5.6% in February 2022, and had dropped to 2.6% by May 2024.
I: Inventory
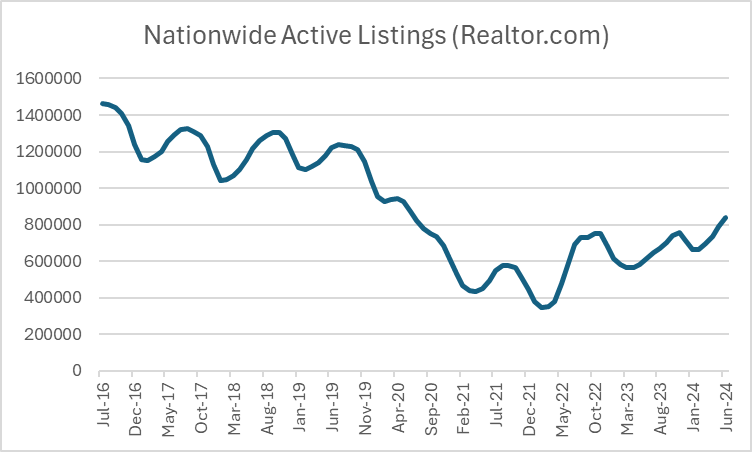
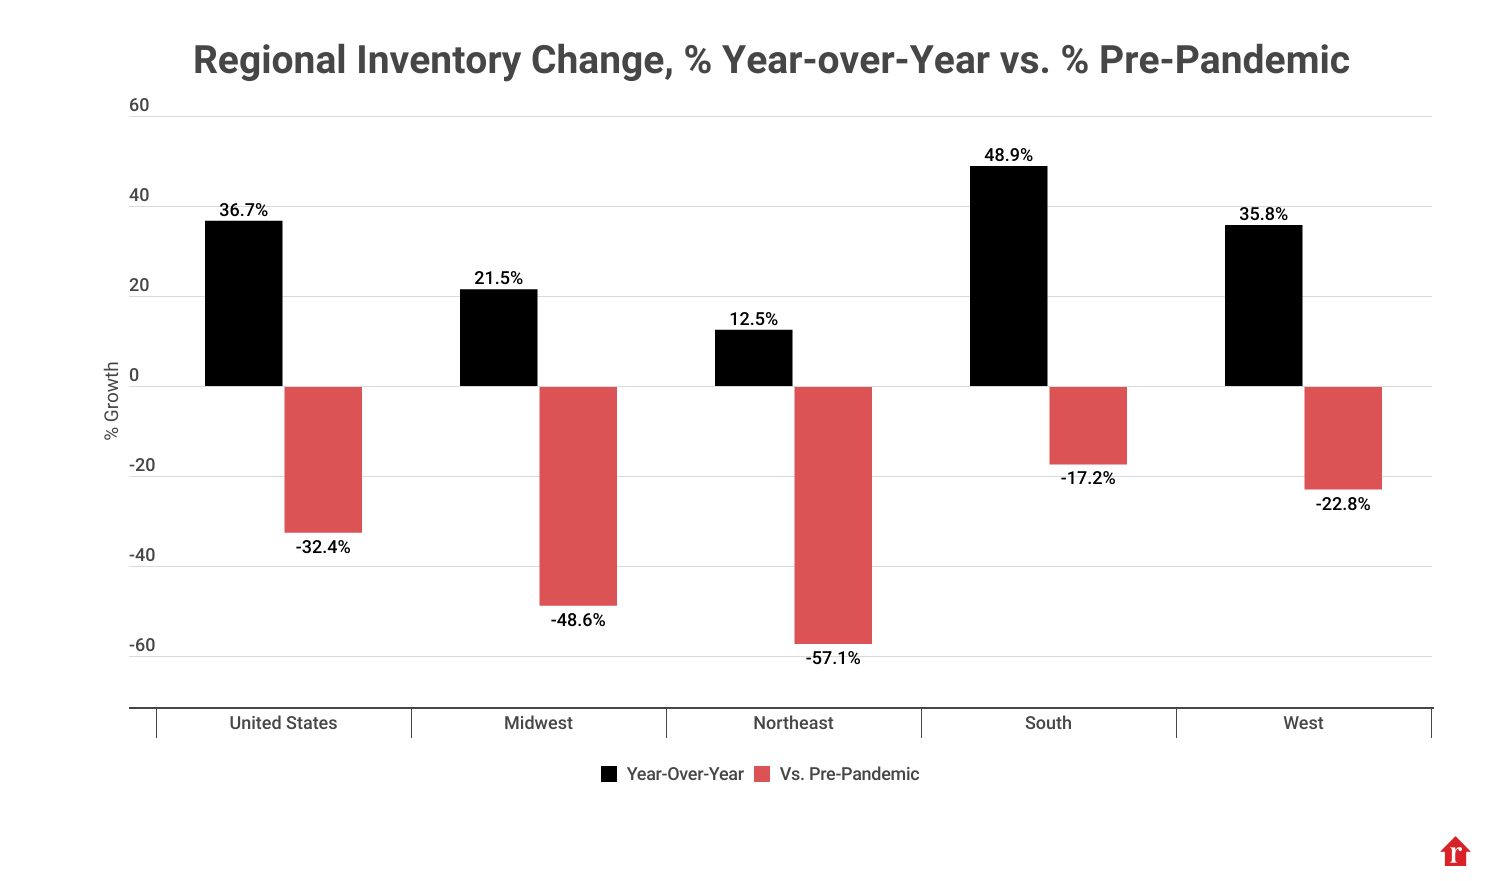
The active inventory of homes for sale (excluding homes under contract) was up 37% year-over-year in June 2024 (yay!), but it was still down ~32% compared to pre-pandemic (boo!). So is the inventory situation good or bad? I’d say ‘improving from a low level.’
Recognizing the seasonality of inventory levels, let’s just look at June. Keep in mind that the huge inventory drawdown happened during the first year of the pandemic (March 2020-March 2021). At 840K units of active inventory, we’re basically back to June 2020 levels, but still 30% below June 2019 and June 2018 levels.
Active Inventory (Realtor.com)
June 2024: 840K
June 2023: 614K
June 2022: 574K
June 2021: 492K
June 2020: 871K
June 2019: 1.2 Million
June 2018: 1.2 Million
However, as I’ve written about in previous issues of Talking Points, most of the inventory recovery has come from a few states — chiefly Florida and Texas. How much? In June 2024, 30% of nationwide active inventory came from those two states! Florida’s active inventory in June 2024 was about 0.4% above its June 2019 levels. Texas’ active inventory in June 2024 was about 4.6% above its June 2019 levels.
That means, of course, that the inventory situation in much of the rest of the country is still quite tight. How tight? Look at the bar chart below. Active inventory in the Midwest region is still 49% below pre-pandemic levels, and active inventory in the Northeast is still 57% below pre-pandemic levels.
II: Home Prices
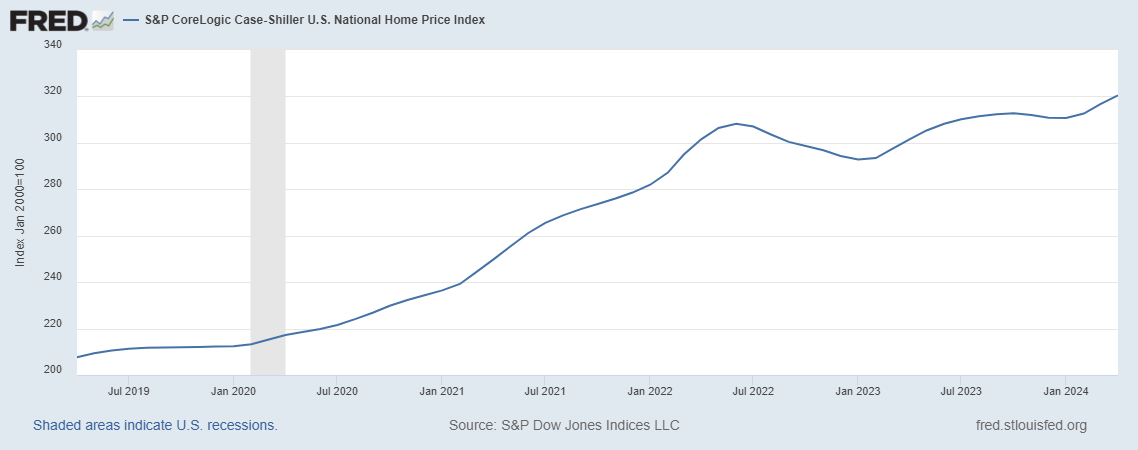
Since the end of 2019 (pre-pandemic), national home prices have risen 51% according to the Case-Shiller index. Between June 2022 and January 2023, they dropped 5%. But the index was back to setting new highs by June 2023. Since that January 2023 mini-trough, home prices have risen 9%.
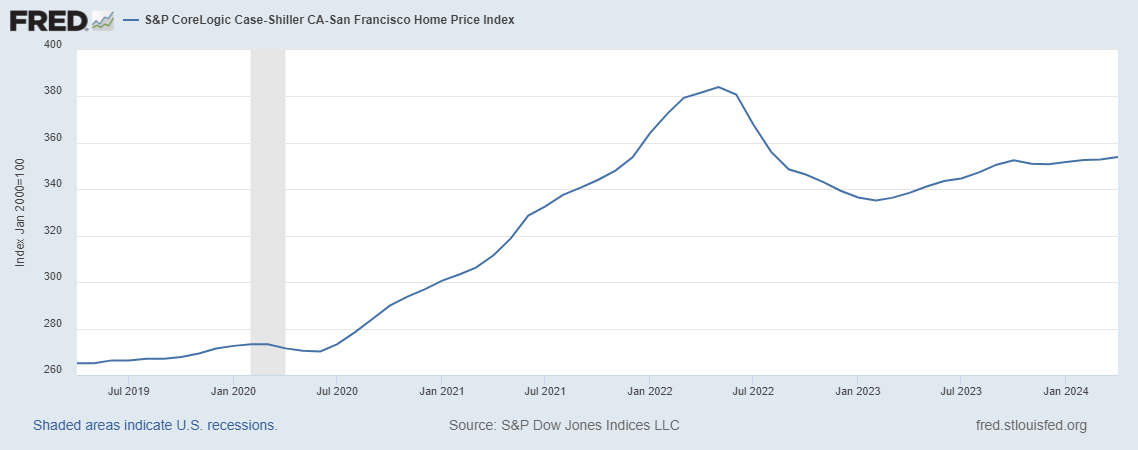
It’s worth noting, however, that not all cities have fully recovered from the late 2022 home price correction. Two years later, San Francisco’s home price index is still 7.8% below its mid-2022 peak. The same goes for Seattle (-5.9%), Portland (-3.8%), Denver (-3.6%), Phoenix (-3.6%), Dallas (-1.9%) and Las Vegas (-1.1%).
S&P CoreLogic Case-Shiller National Home Price Index
S&P CoreLogic Case-Shiller San Francisco Home Price Index
And there are some cities where prices are falling today. Can you guess where? Mostly in the South (which includes Florida and Texas), where prices soared during the pandemic and inventory levels have already recovered to well above pre-pandemic levels.
III: Existing Home Sales
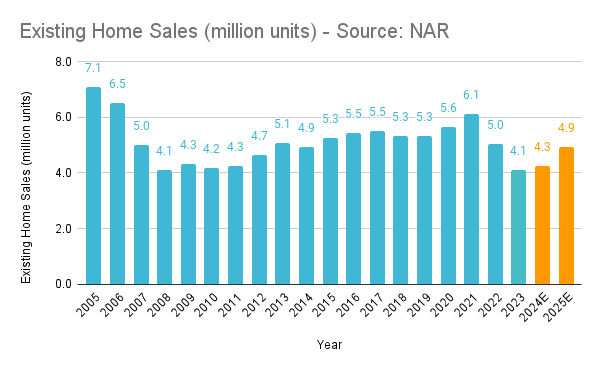
Most forecasters (including me) expected more of a rebound in existing home sales in 2024. In 2023, 4.1 million existing homes changed hands, a level not seen since 2008 (which was effectively the trough after the housing crisis). At the beginning of the year, the NAR forecasted 4.5 million existing home sales in 2024. That was recently lowered to 4.26 million, and even achieving that could be a struggle if mortgage rates don't move sharply lower.
The positive spin to all this is that every year we have existing home sales below 5 million units is just “compressing the spring” further. Eventually, we’re going to have a big snapback. That’s why I’d welcome lower home prices, not just lower mortgage rates. Affordability must be addressed before transaction volumes can normalize.
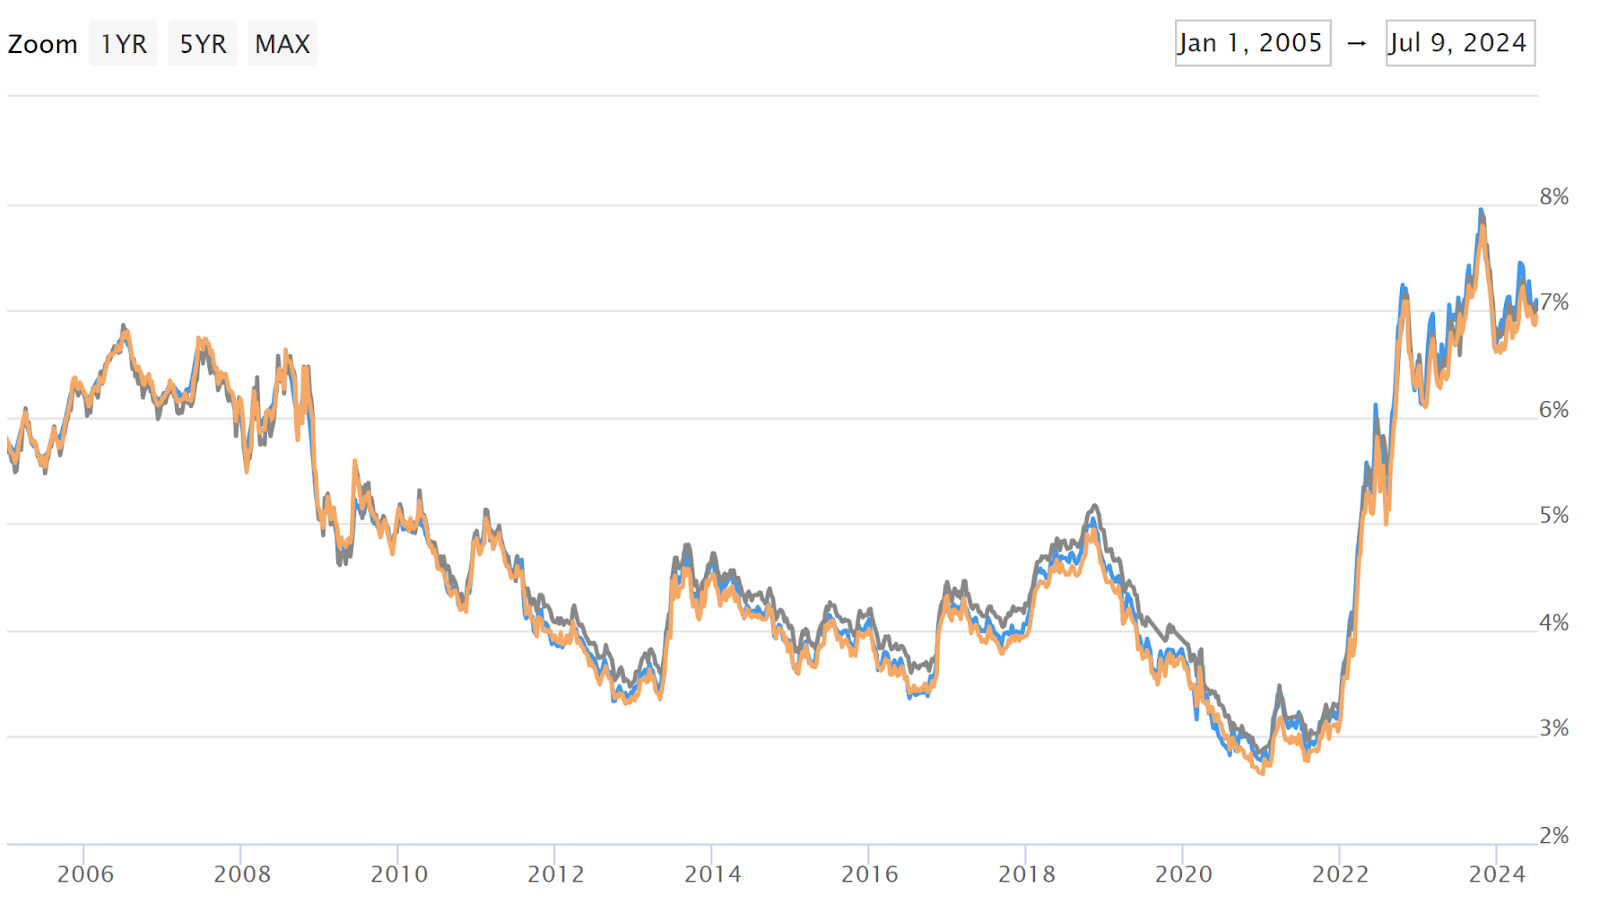
Average 30-yr mortgage rates (Mortgage News Daily)
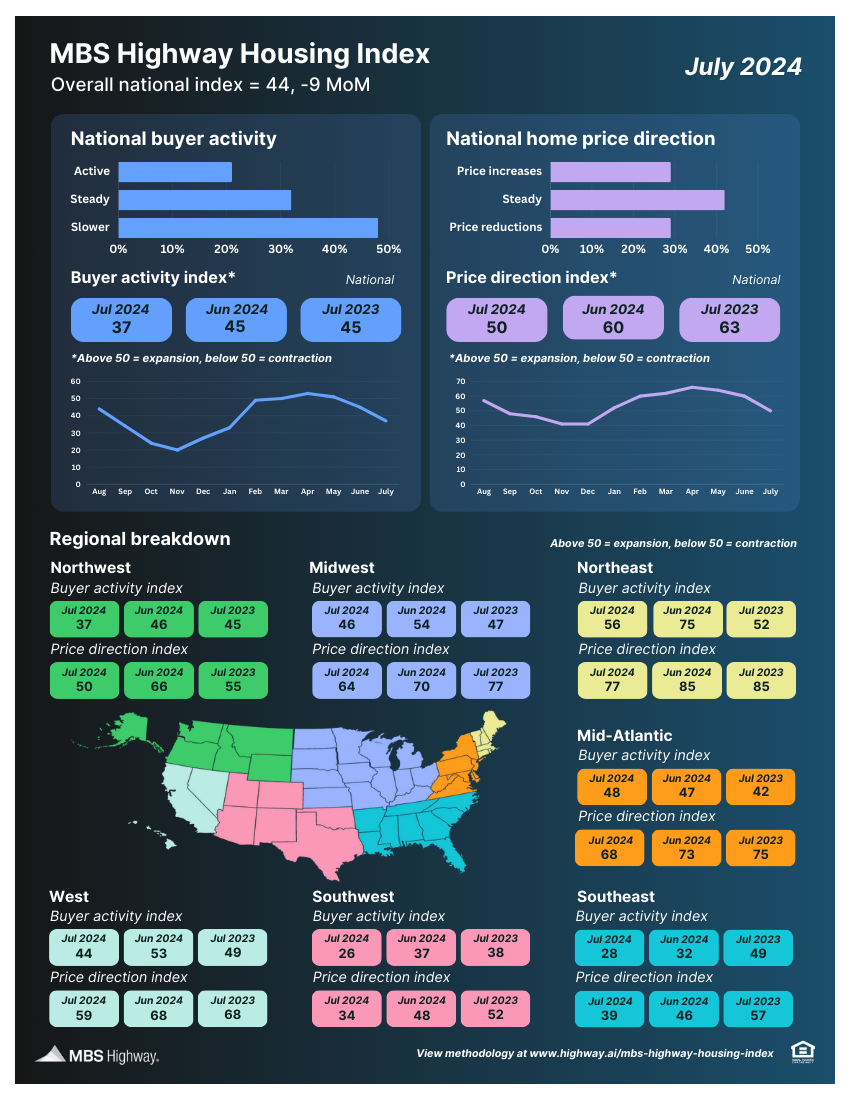
 MBS Highway Housing Survey for July 2024
The MBS Highway National Housing Index dropped 9 points in July 2024 to 44, as buyer activity levels fell across the nation. We’re well into summer, but 7% mortgage rates and still-rising home prices have put a winter chill on transaction volumes.
- The national Buyer Activity sub-index dropped 8 points to 37 in July 2024, after having dropped 6 points to 45 in June 2024. In July 2023, the Buyer Activity sub-index was at 45.
- Buyer Activity levels declined in six of the seven regions, with only the Northeast (56) managing to stay above the 50 breakeven point. The least active regions were the Southeast (28) and Southwest (26).
- The national Price Direction sub-index fell 10 points to 50 — right at the breakeven point. This means that the percentage of respondents seeing price increases (29%) exactly matched those seeing price reductions. In July 2023, the national Price Direction sub-index was at 63.
- All seven regions saw their Price Direction sub-indexes move lower, but five out of the seven remained at or above 50. The strongest home price momentum was in the Northeast (77) and Mid-Atlantic (68). The weakest was in the Southeast (39) and Southwest (34).
 Mortgage Market
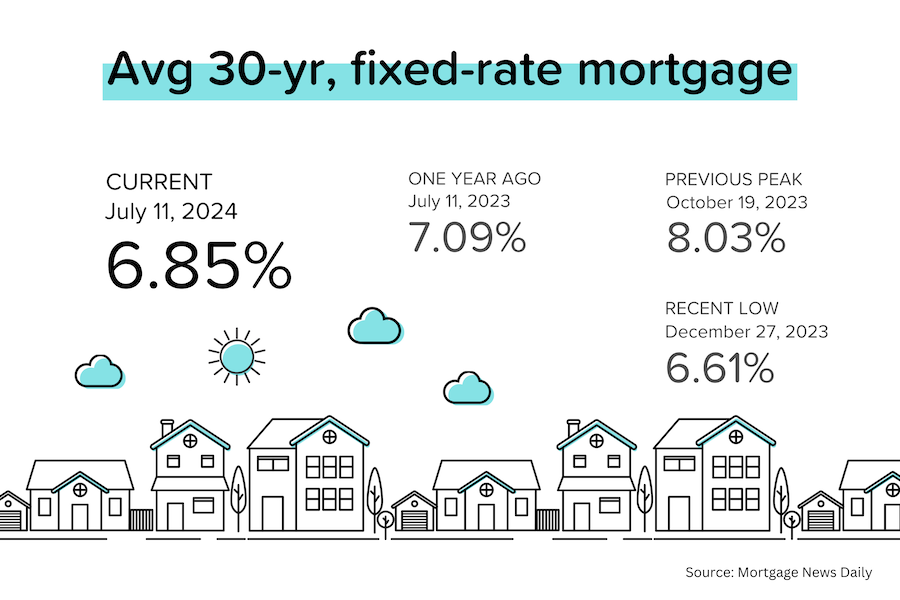
Average 30-year mortgage rates have ranged between 7.00–7.15% for the last few weeks. While the May PCE report (flat headline inflation, +0.1% “core” growth) was very positive for the bond markets and mortgage rates, ‘jobs week’ delivered mixed messages.
Current odds on Fed rate cuts at upcoming FOMC meetings below. Keep in mind that the US Presidential election is on November 5.
- July 31: 9% (down from 10% two weeks ago)
- Sept 18: 93% (up from 62% two weeks ago)
- Nov 7: 97% (up from 75% two weeks ago)
- Dec 18: 99% (was 93% two weeks ago)
 They Said It
“Buyers are balking at 7% mortgage rates and record home prices (in many markets). The Fed holds the key that could unlock both buyers and sellers — rate cuts — but it remains focused on lagging and flawed measures of inflation and employment.” — Barry Habib, MBS Highway’s Founder and CEO.
“Persistently stronger home price gains this spring continue in markets where inventory is well below pre-pandemic levels, such as those in the Northeast. Also, markets that are relatively more affordable, such as those in the Midwest, have seen healthy price growth this spring. On the other hand, markets with notable inventory increases, including those in Florida and Texas, continue to see annual deceleration that is pulling prices below numbers recorded last year.” — Dr. Selma Hepp, CoreLogic’s Chief Economist
- Kristen Haynes
