Market Trends & Data
Market News & Data
General Info
Real Estate Strategies

Landlording & Rental Properties
Real Estate Professionals
Financial, Tax, & Legal


Real Estate Classifieds
Reviews & Feedback
Updated almost 2 years ago on . Most recent reply

April Las Vegas Rental Market Update
It’s April, and time for another Las Vegas update. For a more in-depth view of the Las Vegas investment market, DM me for our 2023 Las Vegas Investor Outlook.
Before I continue, note that the charts only include properties that match the following profile, unless otherwise noted.
- Type: Single-family
- Configuration: 1,000 SF to 3,000 SF, 2+ bedrooms, 2+ baths, 2+ garage, minimum lot size is 3,000 SF.
- Price range: $320,000 to $475,000
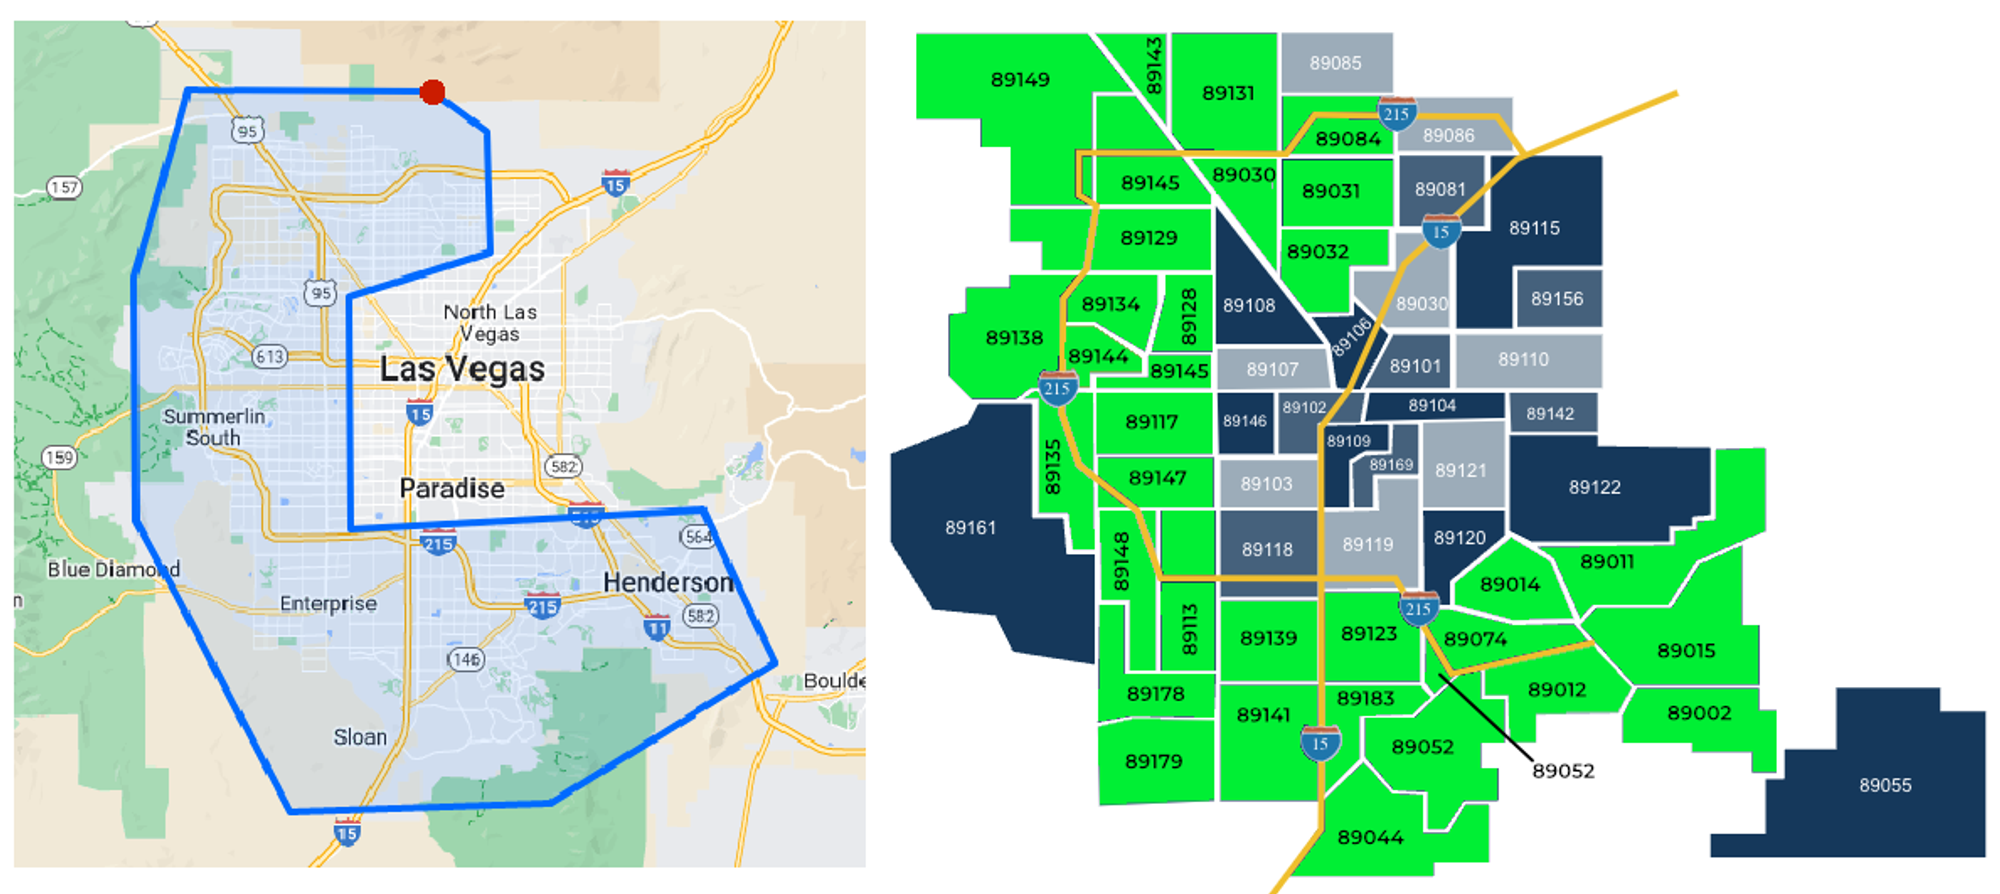
- Location: All zip codes marked in green above have one or more of our client’s investment properties.
What we are seeing:
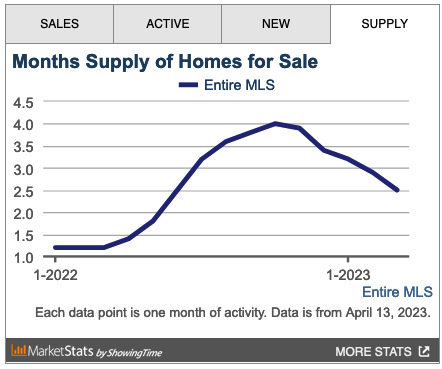
Overall inventory is falling in Las Vegas. The chart below is from the MLS and includes all property types and price ranges.
The Charts
The charts below are only for the property profile we target.
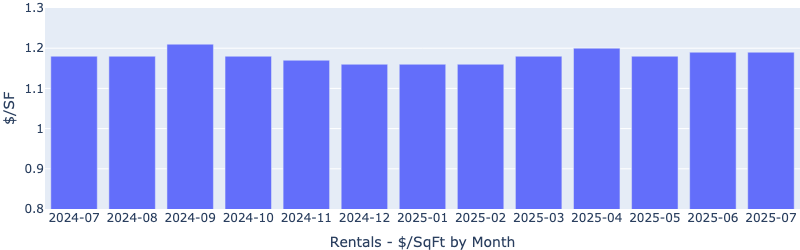
Rentals - Median $/SF by Month
As expected, the rents started increasing. This is due to increasing demand and decreasing supply, as shown in the charts below.
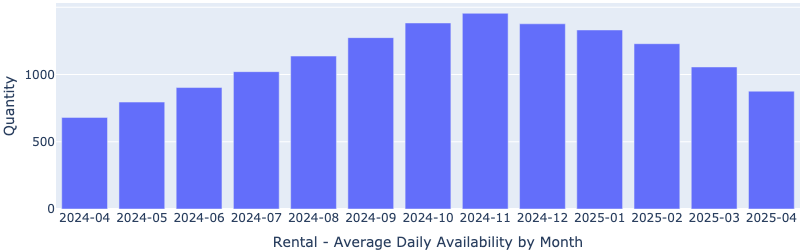
Rentals - Availability by Month
The number of homes for rent dropped rapidly in the last three months, showing decreasing supply.
Rentals - Median Time to Rent
Median time to rent dropped significantly since February, indicating increasing demand.

Rentals - Months of Supply
Just one month of supply for our target rental property profile. Demand is greater than supply. This will push up the rent.

We saw a similar drastic drop in sales supply as well.
Sales - Months of Supply

What is driving long term demand for rental properties in Las Vegas?
Las Vegas Fundamentals
Unlike financial markets, real estate prices and rents are driven by supply and demand. What is the supply and demand situation in Las Vegas?
Supply
Las Vegas is unique in that it is a tiny island of privately owned land in an ocean of federal land. See the 2020 aerial view below.
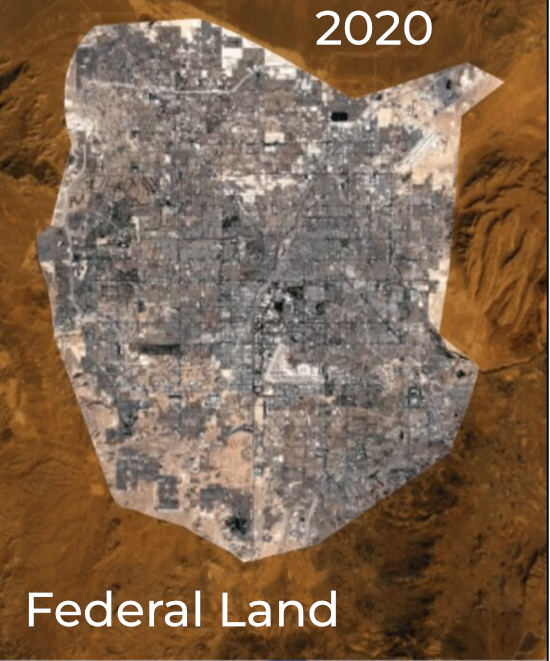
There is very little undeveloped private land remaining, and any available land in desirable areas costs more than $1 million per acre. Due to the high cost of land, new homes in our targeted locations start at $550,000. The homes that appeal to our target tenant segment are priced between $320,000 and $475,000. Therefore, no matter how many new homes are built, the housing stock we target remains almost constant. This is different from metropolitan areas with unlimited expansion potential, where the construction of new homes limits the growth of rent and home prices of existing properties.
Demand
The driver for housing demand is population growth. The average Las Vegas annual population growth is between 2% and 3%. What attracts most people to Las Vegas (and other metros) is jobs.
In a study I did in January, I looked at two major job sites (Monster and Glass Door) for the number of open jobs in Las Vegas. According to these sites, there are between 26,000 and 31,000 open jobs in Las Vegas.
The number of available jobs will increase in the future. Depending on which study you read, there is between $18B and $26B of new construction under development. As these come online, they will create even more jobs attracting more people to Las Vegas.
Of the people who will move to Las Vegas, a significant portion matches the tenant segment we've targeted since 2005. So, the demand for conforming properties priced between $320,000 and $475,000 will increase over time.
Summary
Due to the unique combination of a fixed supply and increasing demand, I believe Las Vegas fundamentals will continue to drive up prices and rents for the foreseeable future.
Let me know if you want more sales or rental data, and I will post additional charts.
- Eric Fernwood
- [email protected]
- 702-358-8884
