Market Trends & Data
Market News & Data
General Info
Real Estate Strategies

Landlording & Rental Properties
Real Estate Professionals
Financial, Tax, & Legal


Real Estate Classifieds
Reviews & Feedback
Updated almost 2 years ago on . Most recent reply
Monthly Las Vegas Rental Market Update
Publicly available rental information is limited and too general to be useful. I developed software to extract rental data from the MLS for our specific property profile and target areas. I thought it would be helpful to share some of the results here.
The property profile we target is summarized as follows:
- Type: Single-family
- Configuration: 1,000 SF to 2,500 SF, 2+ bedrooms, 2+ baths, 2+ garages, minimum lot size is +3,000 SF.
- Price range: $300,000 to $475,000
- Location: All zip codes marked in green below have one or more of our clients' investment properties.

The Charts
Rentals - Median $/SF by Month
December rents were up from November. We will see if this trend continues in 2023. YoY rents are up 4.5%.

Rentals - Median Time to Rent
Median time to rent increased to above 30 days for December. A longer time to rent is expected for the slowest time of the year.

Rentals - Months of Supply
Rental supply has been below 1.5 months for our target rental property profile. Demand is still greater than supply. This will push up the rent.

Some comments on the prices.
I am frequently asked about whether Las Vegas prices are overheated. The chart below compares $/SF vs. peak 2006/2007 prices. The blue line shows $/SF without correcting for inflation. The green line is uncorrected 2006/2007 $/SF. The red line is inflation-corrected 2006/2007 $/SF. As you can see, the current $/SF is still below the inflation-corrected peak prices of 2006 and 2007. So, I do not believe prices are overheated.

Will prices decrease significantly in Las Vegas? In my opinion, no. Inventories are dropping, as you can see in the charts below. Declining inventory and declining prices do not go together.

Please let me know if you want more sales or rental data, and I will post additional charts.
- Eric Fernwood
- [email protected]
- 702-358-8884
Most Popular Reply
Hello @Joe Fermin,
I only study the Las Vegas metro area and have no data regarding Pahrump or Boulder City. I believe, however, that the markets there differ fundamentally from metro Las Vegas. Here are my thoughts.
Pahrump
- Has almost no limitation to expansion, so I do not see any upward price pressure due to the expansion limitations.
- The population is increasing (an average of 1.79% annually) and is currently approximately 47,228.
- There are no major employers. Below is a subset of Pharump employers from: https://nevadaworkforce.com/_docs/Top-Employers/20211/Top-20-Employers---Nye-County
Boulder City
- There are few major employers. Below are the two largest that I found.
- Boulder City Hospital - 400 employees
- Bureau of Reclamation - 1,000 employees (including those working at the Hoover Dam and related facilities)
- Boulder City is a relatively small city, with a population of just over 15,000 people.
- I believe they have restrictive building codes to limit growth.
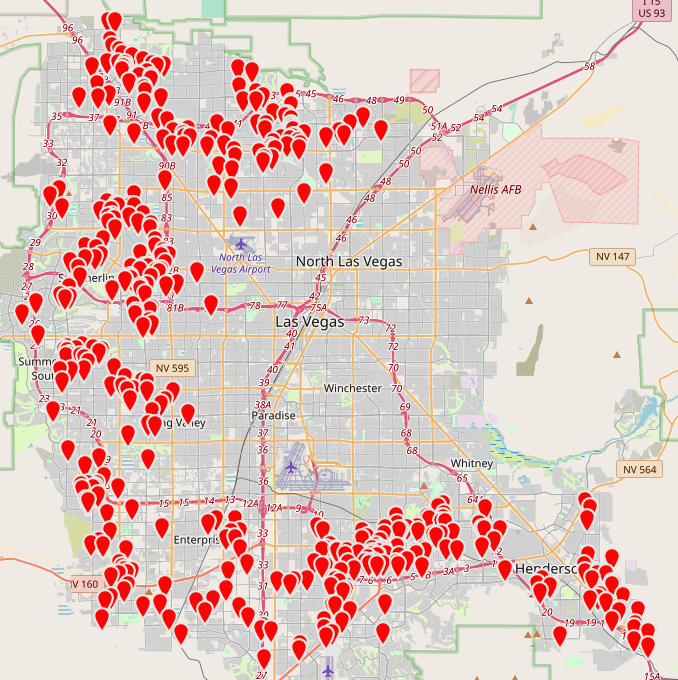
- Many people live in southeast Henderson and commute to Boulder City. Below is a map showing the location of our clients’ properties. As you can see, we have a few properties in the southeast, and most of the tenants work in Boulder City.

Based on a quick review, neither Pahrump or Boulder City have much in common with Las Vegas. So, the statistics we generate are not relevant to either city.
Joe, sorry I do not have more information to offer.
- Eric Fernwood
- [email protected]
- 702-358-8884
