
Rent-to-Value Ratio: "Tinder Filter for Rental Real Estate"

When I am looking at potential investment properties the rent-to-value ratio is the very first metric I look at with evaluating an investment. To calculate this metric you take the monthly rent divided by the purchase price/value. For example a home that rents for $1000/month that costs $100,000 has a rent to value ratio of 1% (1,000/100,000=1%). The higher the better. I typically look at a huge list of properties so using excel to make this calculation is the best practice. It’s sort of like using the dating app Tinder… but with a filter.... I’ll stop there… you get the point, a lot of options, how do you best narrow them down. In the spreadsheet if you are so inclined to use conditional formatting or spark charts to flag the best ratio values… well, no wonder you are bored at your day job. If you create a bunch of Macros to do this, wake up! You are seriously being underutilized in this world.
I actually don’t care about how many bedrooms, square footage, if it's Victorian era, made out of bricks, in a hurricane zone, or if Heath Ledger grew up there. I’m not interested in any of it yet because I am just checking out if it hits the numbers first. Dummy Alert: Just because it meets the 1% threshold does not mean you have a winner. For example, I can find homes all day that is $50k and rent for $800. You’re probably thinking “Wow, that’s so rad it has an (800/50k) 1.6%+ Rent to value ratio”. But in reality, those homes typically have lower quality tenants who screw up the property and have more vacancy. In some places, you might have to carry a gun to pick up the rent. I personally like to find properties that are right in that 1% zone but are also the most expensive (highest class), e.g. a $145k property that rents for $1400/month.
There are similar metrics such as the Cap Rate or Gross Rent Multiplier, but these are typically not used in the non-commercial realm of Single Family Rentals. Using such vernacular can tip you off to an agent that you are either inexperienced or European… not that anything is wrong with being European except they do things ass-backwards. ‘Merica! This is also an indicator for you that you are working with an inexperienced agent or one that is coming from the commercial world trying to “get rid of a few SFHs” as a side-gig. I am no one’s side-gig!
Home ValueRent/MonthClass40K600D60K800C+70K875B-90K1000B110K1100B+130K1150A-160K1200AFigure: General Rent to Value Ratios w/ Classes in top Cashflow Markets
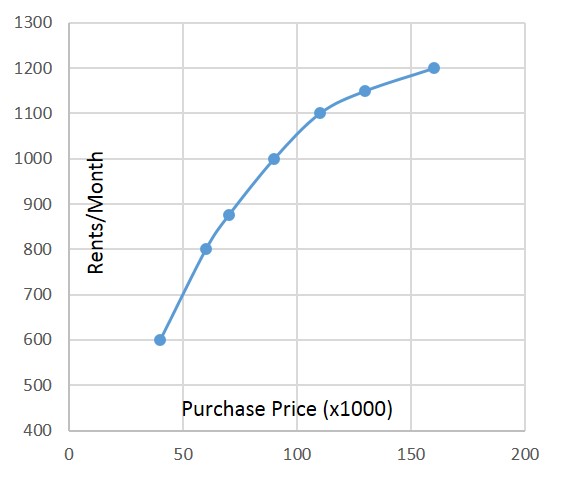
Note: Monthly Rents on vertical, Home Value on horizontal: Varies by market, this is simply to illustrate that this line is not straight
Nuances to recognize:
- The value and rent relationship would not be linear (straight line); instead it would be a curved line (see graph above) where you have aggressive returns in higher ratio rents in the beginning (lower class properties) and lower ratio rents in the end (higher class properties)
- As properties get more expensive the rent to value ratio typically decreases - see the graph above as the home value gets over 100k it gets flatter (horizontal).
- Just know that the rents per month in this chart are Proforma rents, which mean subject to real life – and if it’s coming from a sales agent – yup straight up BS. If you are totally understanding the graph above, note that the curve will flatten out (less bendy, straighter) as you transition to actual real life performance. Or in other words, you will have to pay a lot more expenses per income in the lower classes than higher classes because lower class tenants tend to be harder on the home. What the graph does not depict is your mental currency that you have to expend on “pain in the ass” (PITA) tenants. I personally try to minimize the PITA potential in all levels of my investing because I am lazy and my best and highest use is at my day job. I like real estate but I don’t love it enough to make it my full-time job. Remember - this is the investment that’s supposed to allow me to quit my job or free up my time for other things.
- If you want my input on my preferred class of properties (especially when starting out), I like to stay in the “sweet spot,” which occurs right before your rent to value numbers flat line – this is typical of the B to B+ range. You have to make your own judgment call here for your own strategy. Also, there is something to be said about being diversified in several classes. For example in Houston where blue collar jobs (C & B rentals) are suffering because of bad oil trends, it would also be good to have some higher class properties (B+ & A- rentals) with jobs tied to white-collar jobs despite the lower returns. Lots of things going on here and that is why real estate investing, although simple, is not for dummies. And now that you are confused and you don’t know what to think… someone told me that the 80% of the median home price (not average – which is typically skewed higher and a figure that is easily found online) is a key price point to try to be around because that is where most of your renting population will be. For example, if the median home in Birmingham is 120k (80% x 120K = 96K) the magic price point is 96K - hey that’s right above a B class property how lucky is that. Hey, it’s my blog so I pick the examples.
- There are many well-written articles on this subject and here is one of them:
http://affordanything.com/2016/04/28/one-percent-rule-gross-rent-multiplier/
If you like this post there is even cooler stuff and personal numbers on my website.


Comments (1)
Great post
Ken S., over 8 years ago