

Days on Market The Great Equalizer (Local, not National)
AUGUST 7, 2019 / LAND ACADEMY / BLOG
By S. Jack Butala
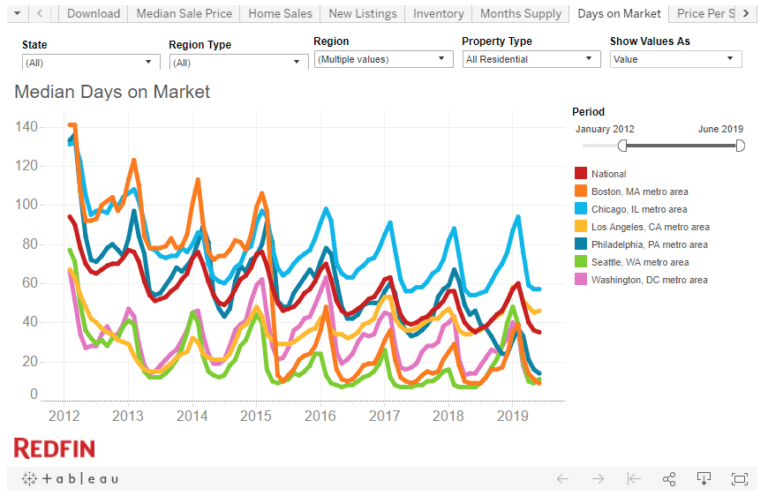
Days on Market (DOM) continue to trend down or hold steady, in general, for most or all types of real estate.
JUNE 2019: National = 35, Boston = 9, Chicago = 57, Los Angeles = 46, Philadelphia = 14, Seattle = 9.
This statistic over all others, is an indicator that real estate sales will likely continue along a downward or steady trend (no recession this month).
Each morning its part of our daily routine to check DOM for the zip codes in which we are buying property (both Land and Houses). I look for any material changes.
National Statistics are not enough. We only look in markets where we are operating. National, regional, and MSA figures can be misleading. Zip code stats get us the information we need.
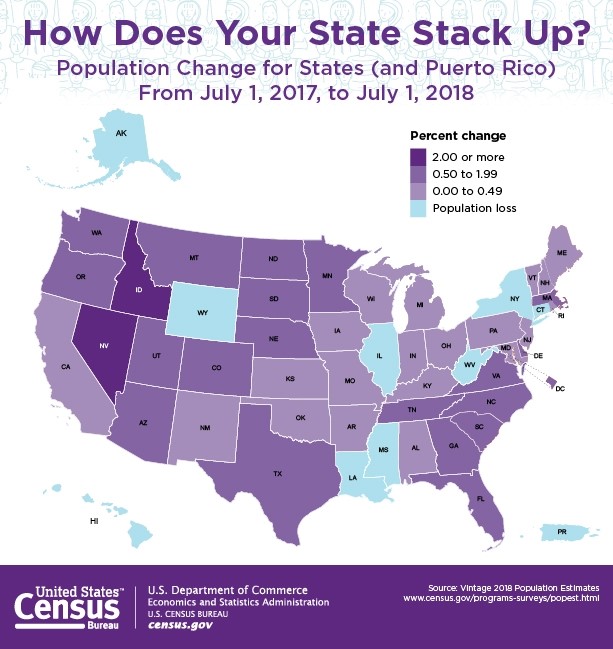
In this chart, you can guess which states have better DOM’s based on population growth;
In this chart, you can guess which counties have better DOM’s based on population growth;
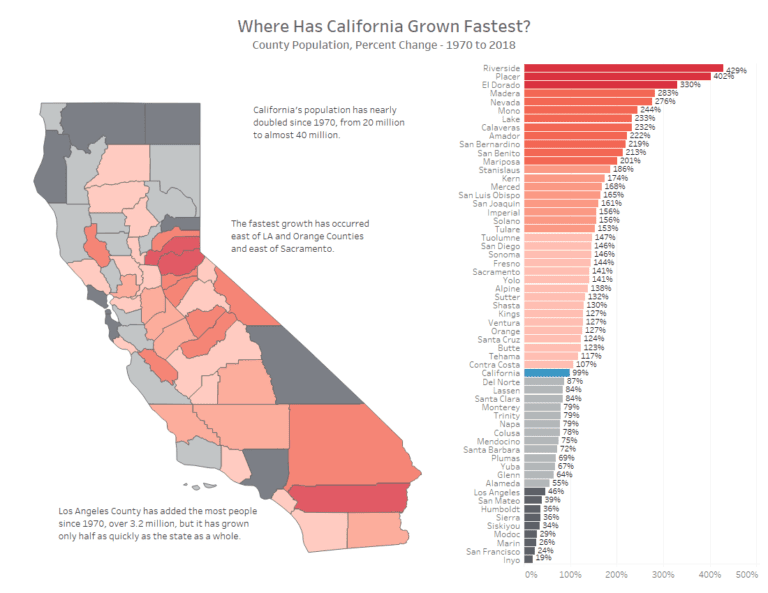
Buy why guess? Own data collection effort reveals which zip codes within a municipality are best for blind offer campaigns (which properties will likely sell the fastest once you purchase them below current resale value;



Comments