Market Trends & Data
Market News & Data
General Info
Real Estate Strategies

Landlording & Rental Properties
Real Estate Professionals
Financial, Tax, & Legal
Real Estate Classifieds
Reviews & Feedback
Updated 26 days ago, 11/05/2024
Will the Election Result Impact the Housing Market?
As Election Day nears, many individuals halt their major financial activities because they feel the uncertainty of the election results may have adverse effects if they act now. In this post, I will explore the historical impact of the election results on the housing market, if any, and share my view of the current election impact.
Historically, U.S. investors have seen similar annual stock market returns regardless of which political party is in power. Major economic downturns, such as the Great Depression and the 2008 Financial Crisis, occurred under both parties and were driven by factors unrelated to the party in office.
The following table shows the DJIA's performance during each presidential administration.
DJIA Percent Change (%)
| President | Date of Inauguration | Last Day in Office | Percent Change (%) | Annualized Return (%) |
|---|---|---|---|---|
| Johnson | 11/22/63 | 1/20/1969 | 30.9 | 5.3 |
| Nixon | 1/20/69 | 8/9/1974 | -16.5 | -3.2 |
| Ford | 8/9/74 | 1/20/1977 | 23.4 | 8.9 |
| Carter | 1/20/77 | 1/20/1981 | -0.9 | -0.2 |
| Reagan | 1/20/81 | 1/20/1989 | 135.1 | 11.3 |
| Bush I | 1/20/89 | 1/20/1993 | 45.0 | 9.7 |
| Clinton | 1/20/93 | 1/20/2001 | 226.6 | 15.9 |
| Bush II | 1/20/01 | 1/20/2009 | -24.9 | -3.5 |
| Obama | 1/20/09 | 1/20/2017 | 149.4 | 12.1 |
| Trump | 1/20/17 | 1/20/2021 | 57.3 | 12.0 |
| Biden | 1/20/21 | 1/20/2025 | 26.4 | 7.7 |
| Median | 26.4% | 7.7% |
|---|---|---|
| Median Republican | 22.5% | 7.9% |
| Median Democratic | 30.9% | 7.7% |
Since the Great Depression, 78% of four-year presidential terms have seen positive S&P 500 results, with an average return of 33% per term—regardless of which party holds office.
| Election Year | Election Winner | % Since Previous Election | % YTD on Election Day |
|---|---|---|---|
| 1964 | Johnson | 54.56 | 13.54 |
| 1968 | Nixon | 21.04 | 6.87 |
| 1972 | Nixon | 10.55 | 11.65 |
| 1976 | Carter | -9.55 | 14.31 |
| 1980 | Reagan | 25.16 | 19.55 |
| 1984 | Reagan | 32.06 | 3.32 |
| 1988 | Bush | 61.46 | 11.36 |
| 1992 | Clinton | 52.61 | 0.68 |
| 1996 | Clinton | 70.07 | 15.94 |
| 2000 | W. Bush | 100.5 | -2.54 |
| 2004 | W. Bush | -21.04 | 1.67 |
| 2008 | Obama | -11.04 | -31.51 |
| 2012 | Obama | 42.02 | 13.58 |
| 2016 | Trump | 49.79 | 4.68 |
| 2020 | Biden | 57.47 | 4.28 |
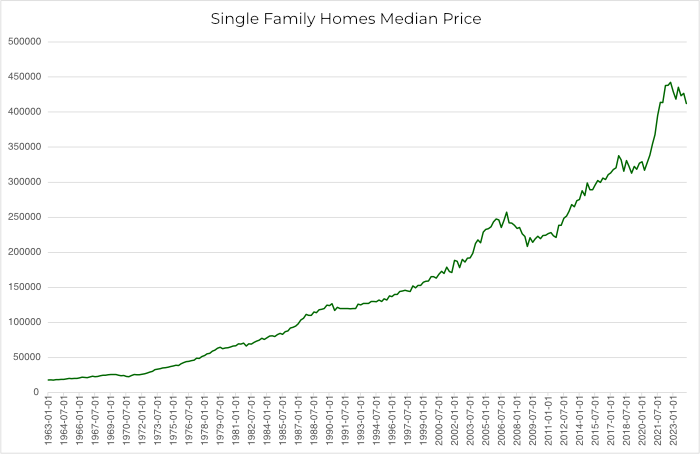
Median sales prices of houses sold since 1963-1-1 (the earliest data I could find).
[Source: Federal Reserve Bank of St. Louis]
Below is a breakdown of SFR price change for each presidential term.
| End of Term | President | SFR Home Price Increase | Party |
|---|---|---|---|
| 1968 | Johnson | 29% | Democrat |
| 1972 | Nixon | 17% | Republican |
| 1976 | Nixon | 37% | Republican |
| 1980 | Carter | 36% | Democrat |
| 1984 | Regan | 15% | Republican |
| 1988 | Regan | 35% | Republican |
| 1992 | Bush | 6% | Republican |
| 1996 | Clinton | 13% | Democrat |
| 2000 | Clinton | 19% | Democrat |
| 2004 | W. Bush | 28% | Republican |
| 2008 | W. Bush | -5% | Republican |
| 2012 | Obama | 14% | Democrat |
| 2016 | Obama | 16% | Democrat |
| 2020 | Trump | 6% | Republican |
| 2024 | Biden | 12% | Democrat |
Historical data reveals no correlation between the presidential party in office and housing price growth or stock market performance.
The stock market is driven by emotions in the short term and by corporate performance in the long term. Single-family home prices and rents are primarily driven by supply and demand dynamics, with interest rates playing a crucial role.
Supply:
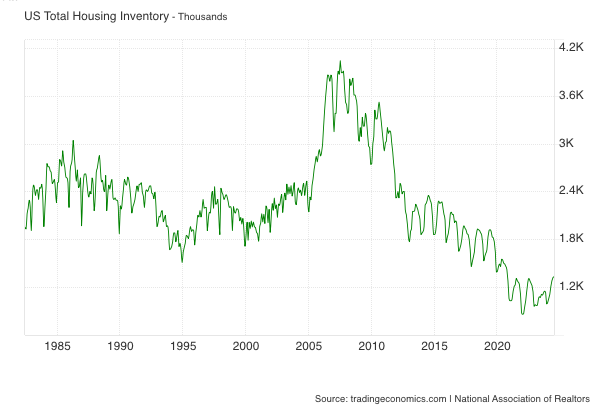
Existing homes for sale have hit a near 30-year low.
[Source: TradingEconomics.com]
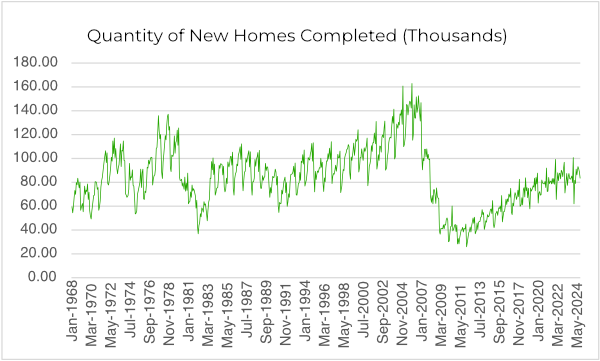
The number of new homes built for the last 10+ years has been chronically lower than the previous decades.
[Source: Federal Reserve Bank of St. Louis]
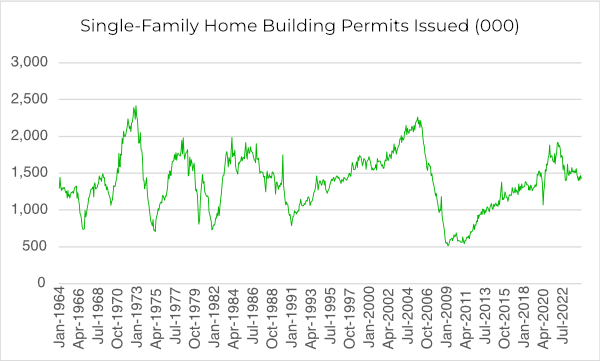
Single-family home building permits serve as a leading indicator of future housing supply trends. And it is not trending up.
[Source: National Association of Home Builders]
Demand:
The chart below illustrates the steady increase in household formation, a key driver of housing demand. The U.S. is forming more households than ever, and that trajectory will likely remain the same due to population growth.
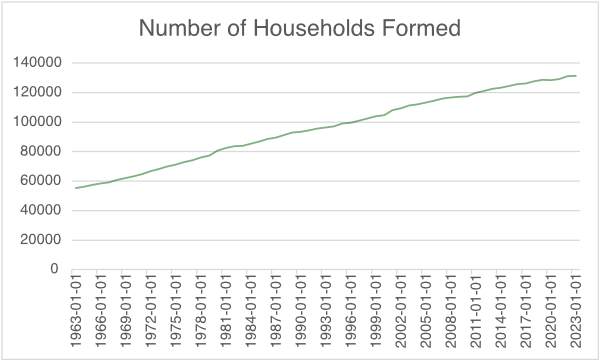
[Source: Federal Reserve Bank of St. Louis]
A comparison between household formation and new home construction shows a significant housing shortage. Below are estimates of the housing shortage by different institutions:
- The National Association of Home Builders (NAHB) estimates a shortage of 1.5 million units (2021 data).
- Freddie Mac’s estimate is a 3.8 million unit shortfall (Q2 2020 data).
- A report commissioned by the National Association of Realtors (NAR) (2021 - Rosen Consulting Group) suggests a 5.5 million unit housing shortage.
No matter which data source you choose, there is a massive shortage. And, regardless of which party takes the White House, the housing shortage will not change.
The only way to boost supply is for builders to significantly increase home construction. However, this seems unlikely given the current high interest rates.
I don't anticipate significant interest rate fluctuations for the next 6 to 9 months. Here's a summary of the reasons: With inflation now in the 2% range, the Fed needs to lower interest rates from their current "restrictive level" (Powell's words) to prevent a recession. However, there's a floor for interest rates due to fears of inflation resurgence, particularly in housing prices. These factors are independent of any presidential candidate's policy promises.
It's worth noting, however, that in the long term, housing markets with abundant vacant land can significantly increase their inventory if policies and economic conditions favor builders.
In markets like Las Vegas, where undeveloped land is limited, and population growth is strong and steady, housing inventory will continue to tighten. This scarcity will drive both property prices and rents upward.
Housing supply and demand dynamics are more determined by interest rates and state/local economics than by the president and Congress.
Summary
Waiting for the election outcome won't give you an advantage. In fact, now may be the best time of the year to buy properties due to reduced buyer competition and seller motivation (those selling now are probably committed.) Prices and rents are driven by supply and demand, which does not change with who is elected, at least in the short term.
- Eric Fernwood
