Wilmington, NC Investment Properties for Sale
Browse homes for sale and investment properties in Wilmington, NC. Refine your search by price, property type, or more.
Best cash flowing properties in Wilmington, NC

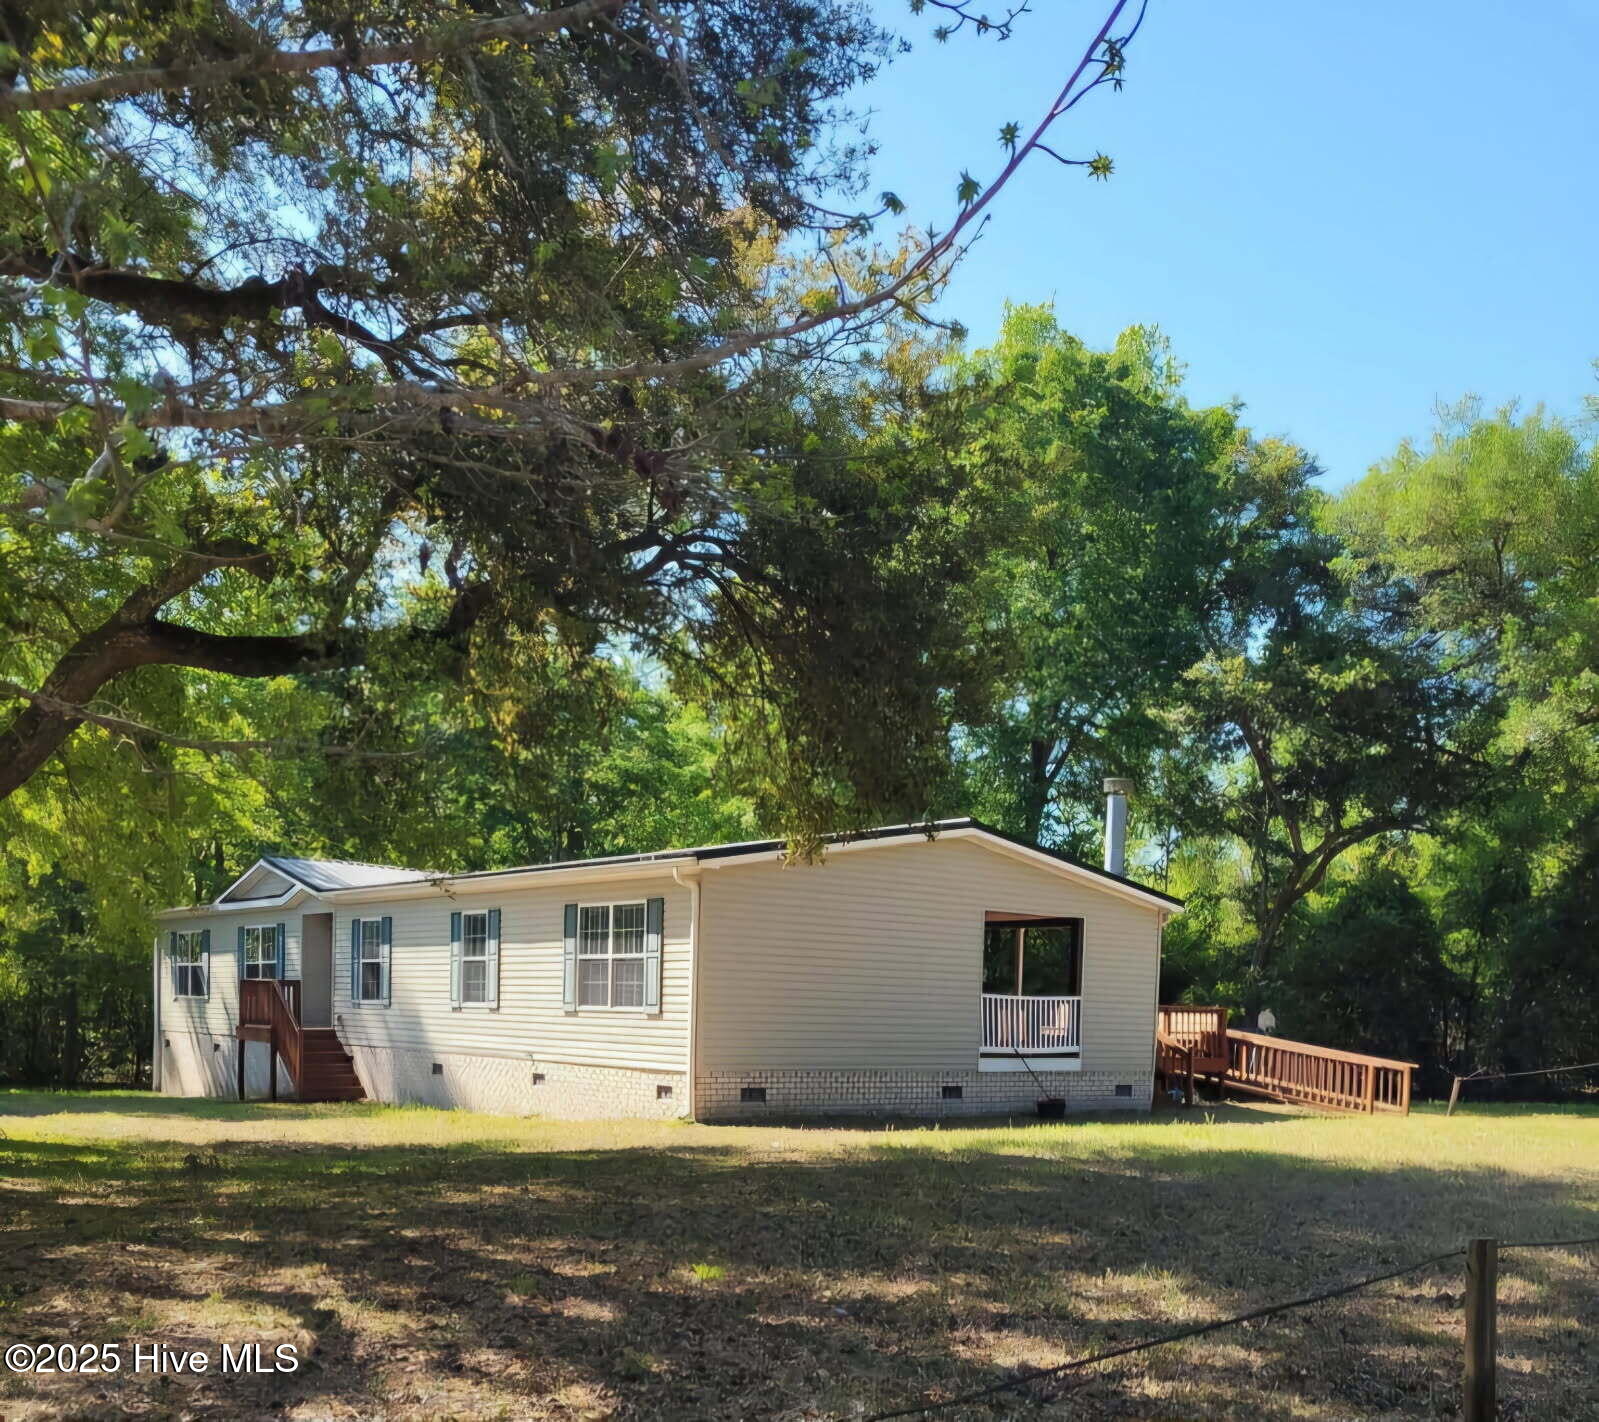
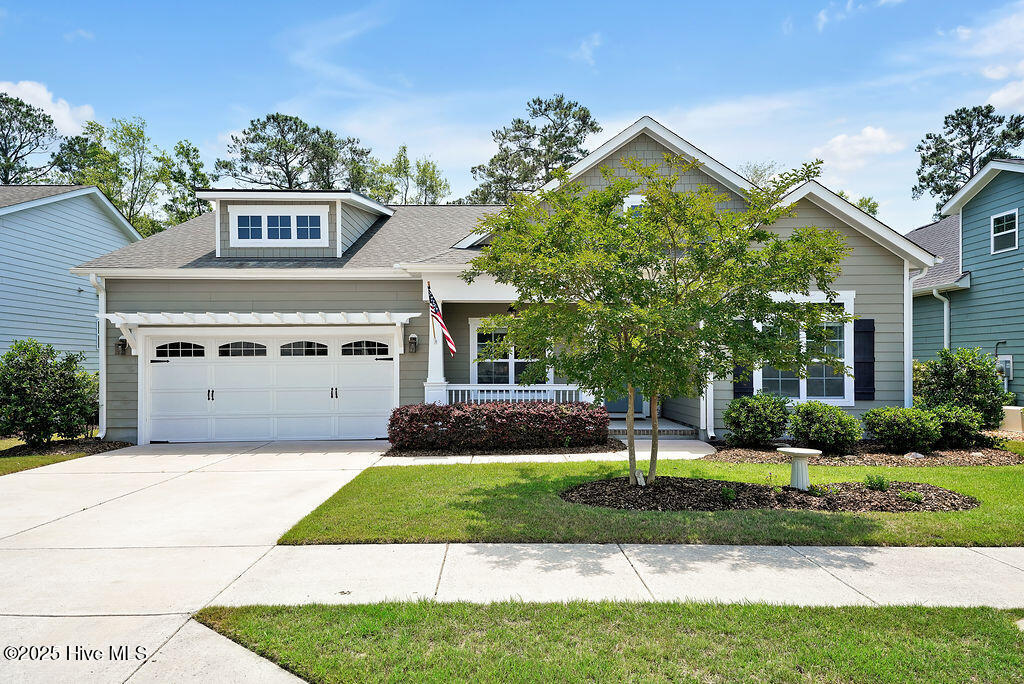
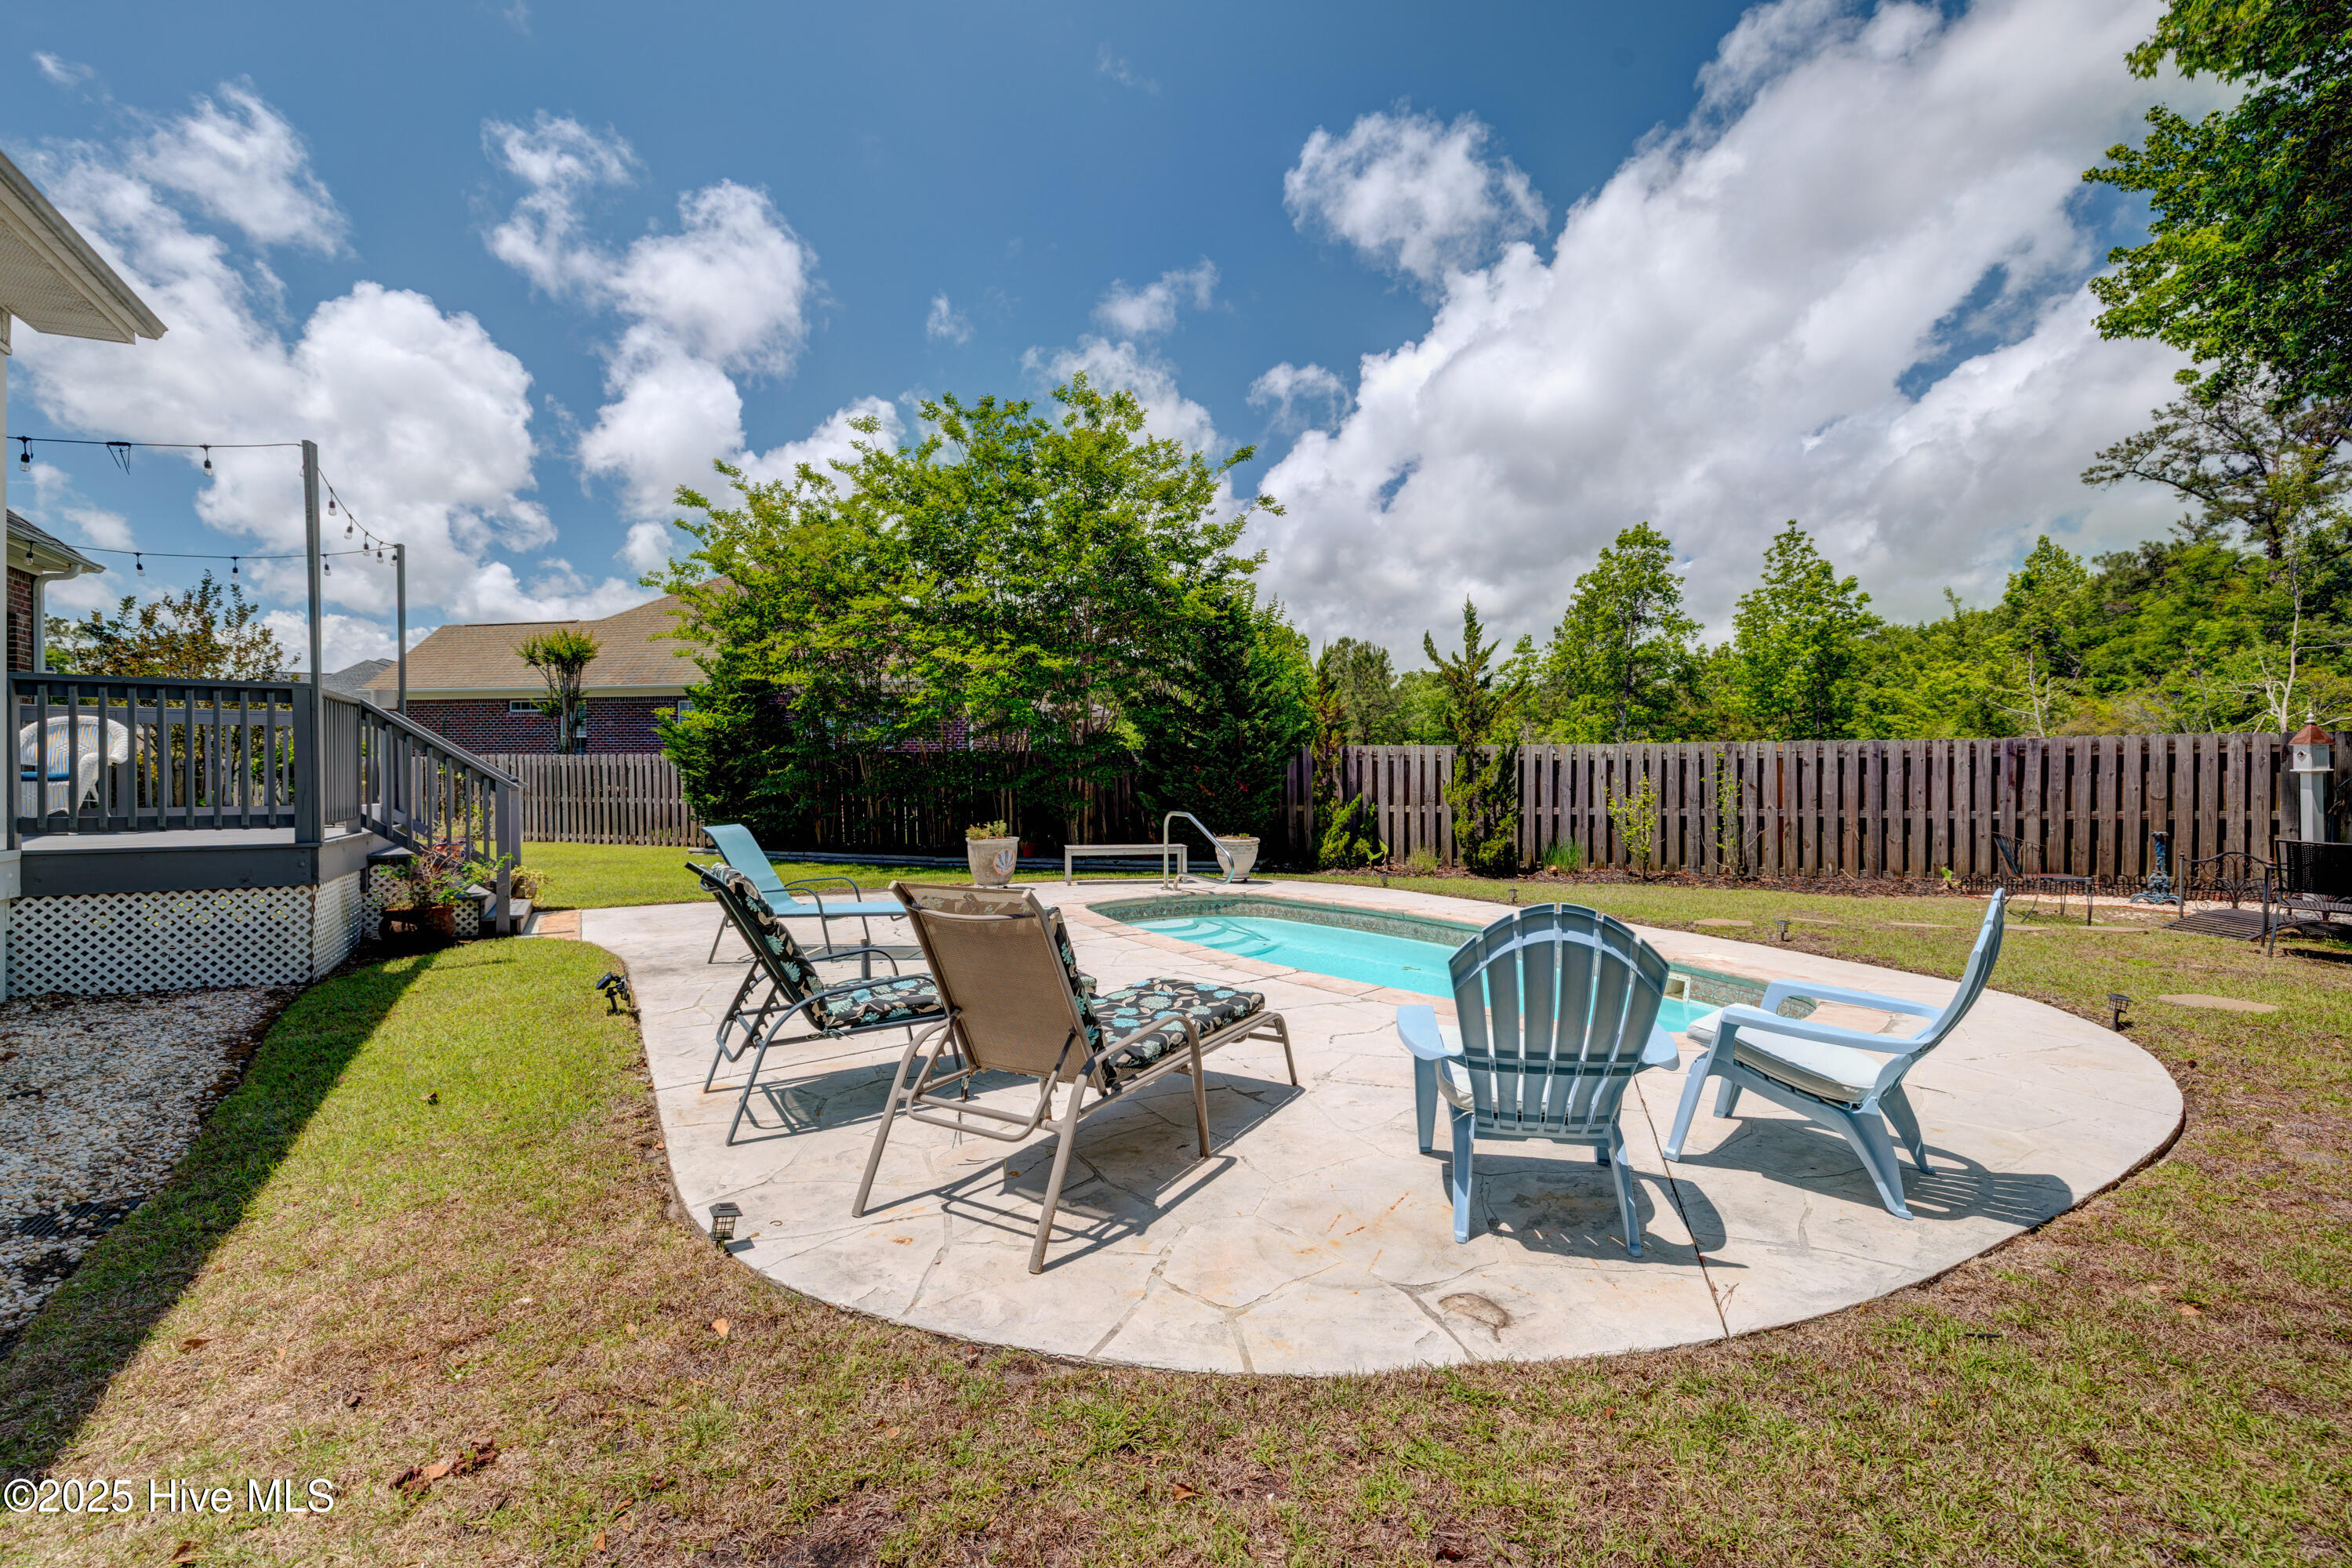
$267,000
3
bds
|
2
ba
|
1,688
sqft
|
built
1973
125 Hampton Rd N, Wilmington, NC 28409
$485
Cash flow
9.5%
Cash-on-Cash Return
7.9%
Cap rate
1.0%
Rent to Value Ratio
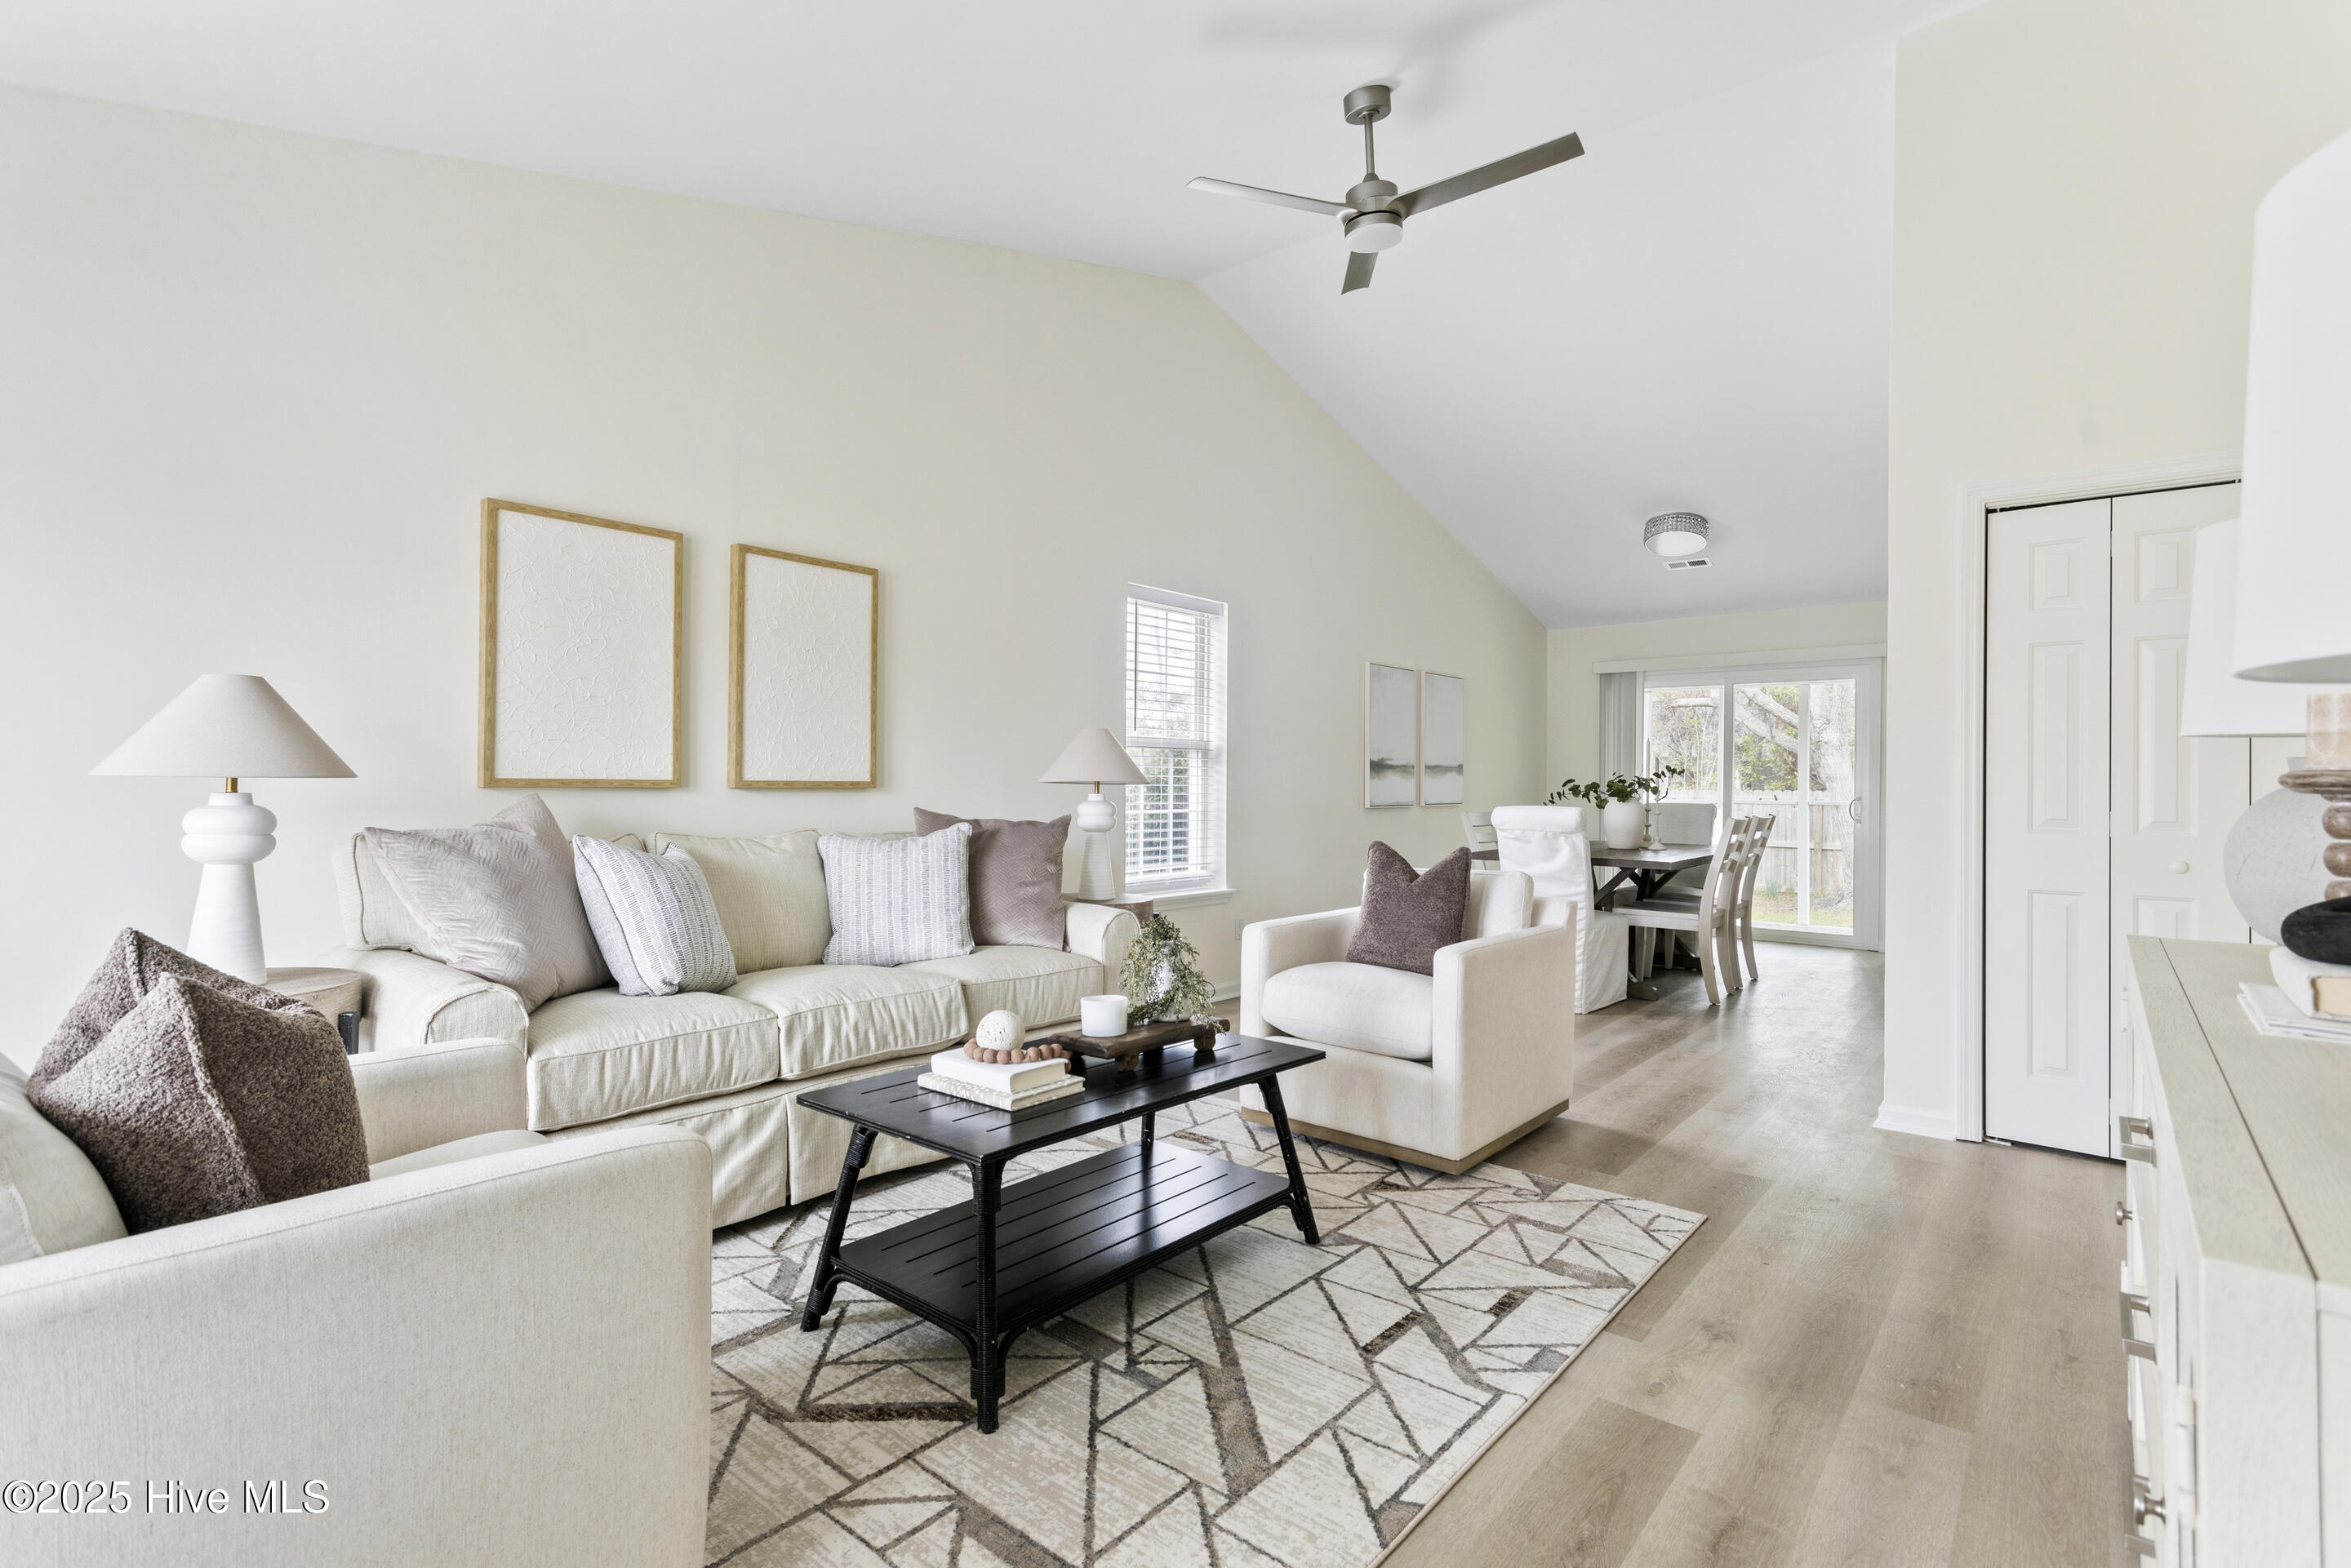
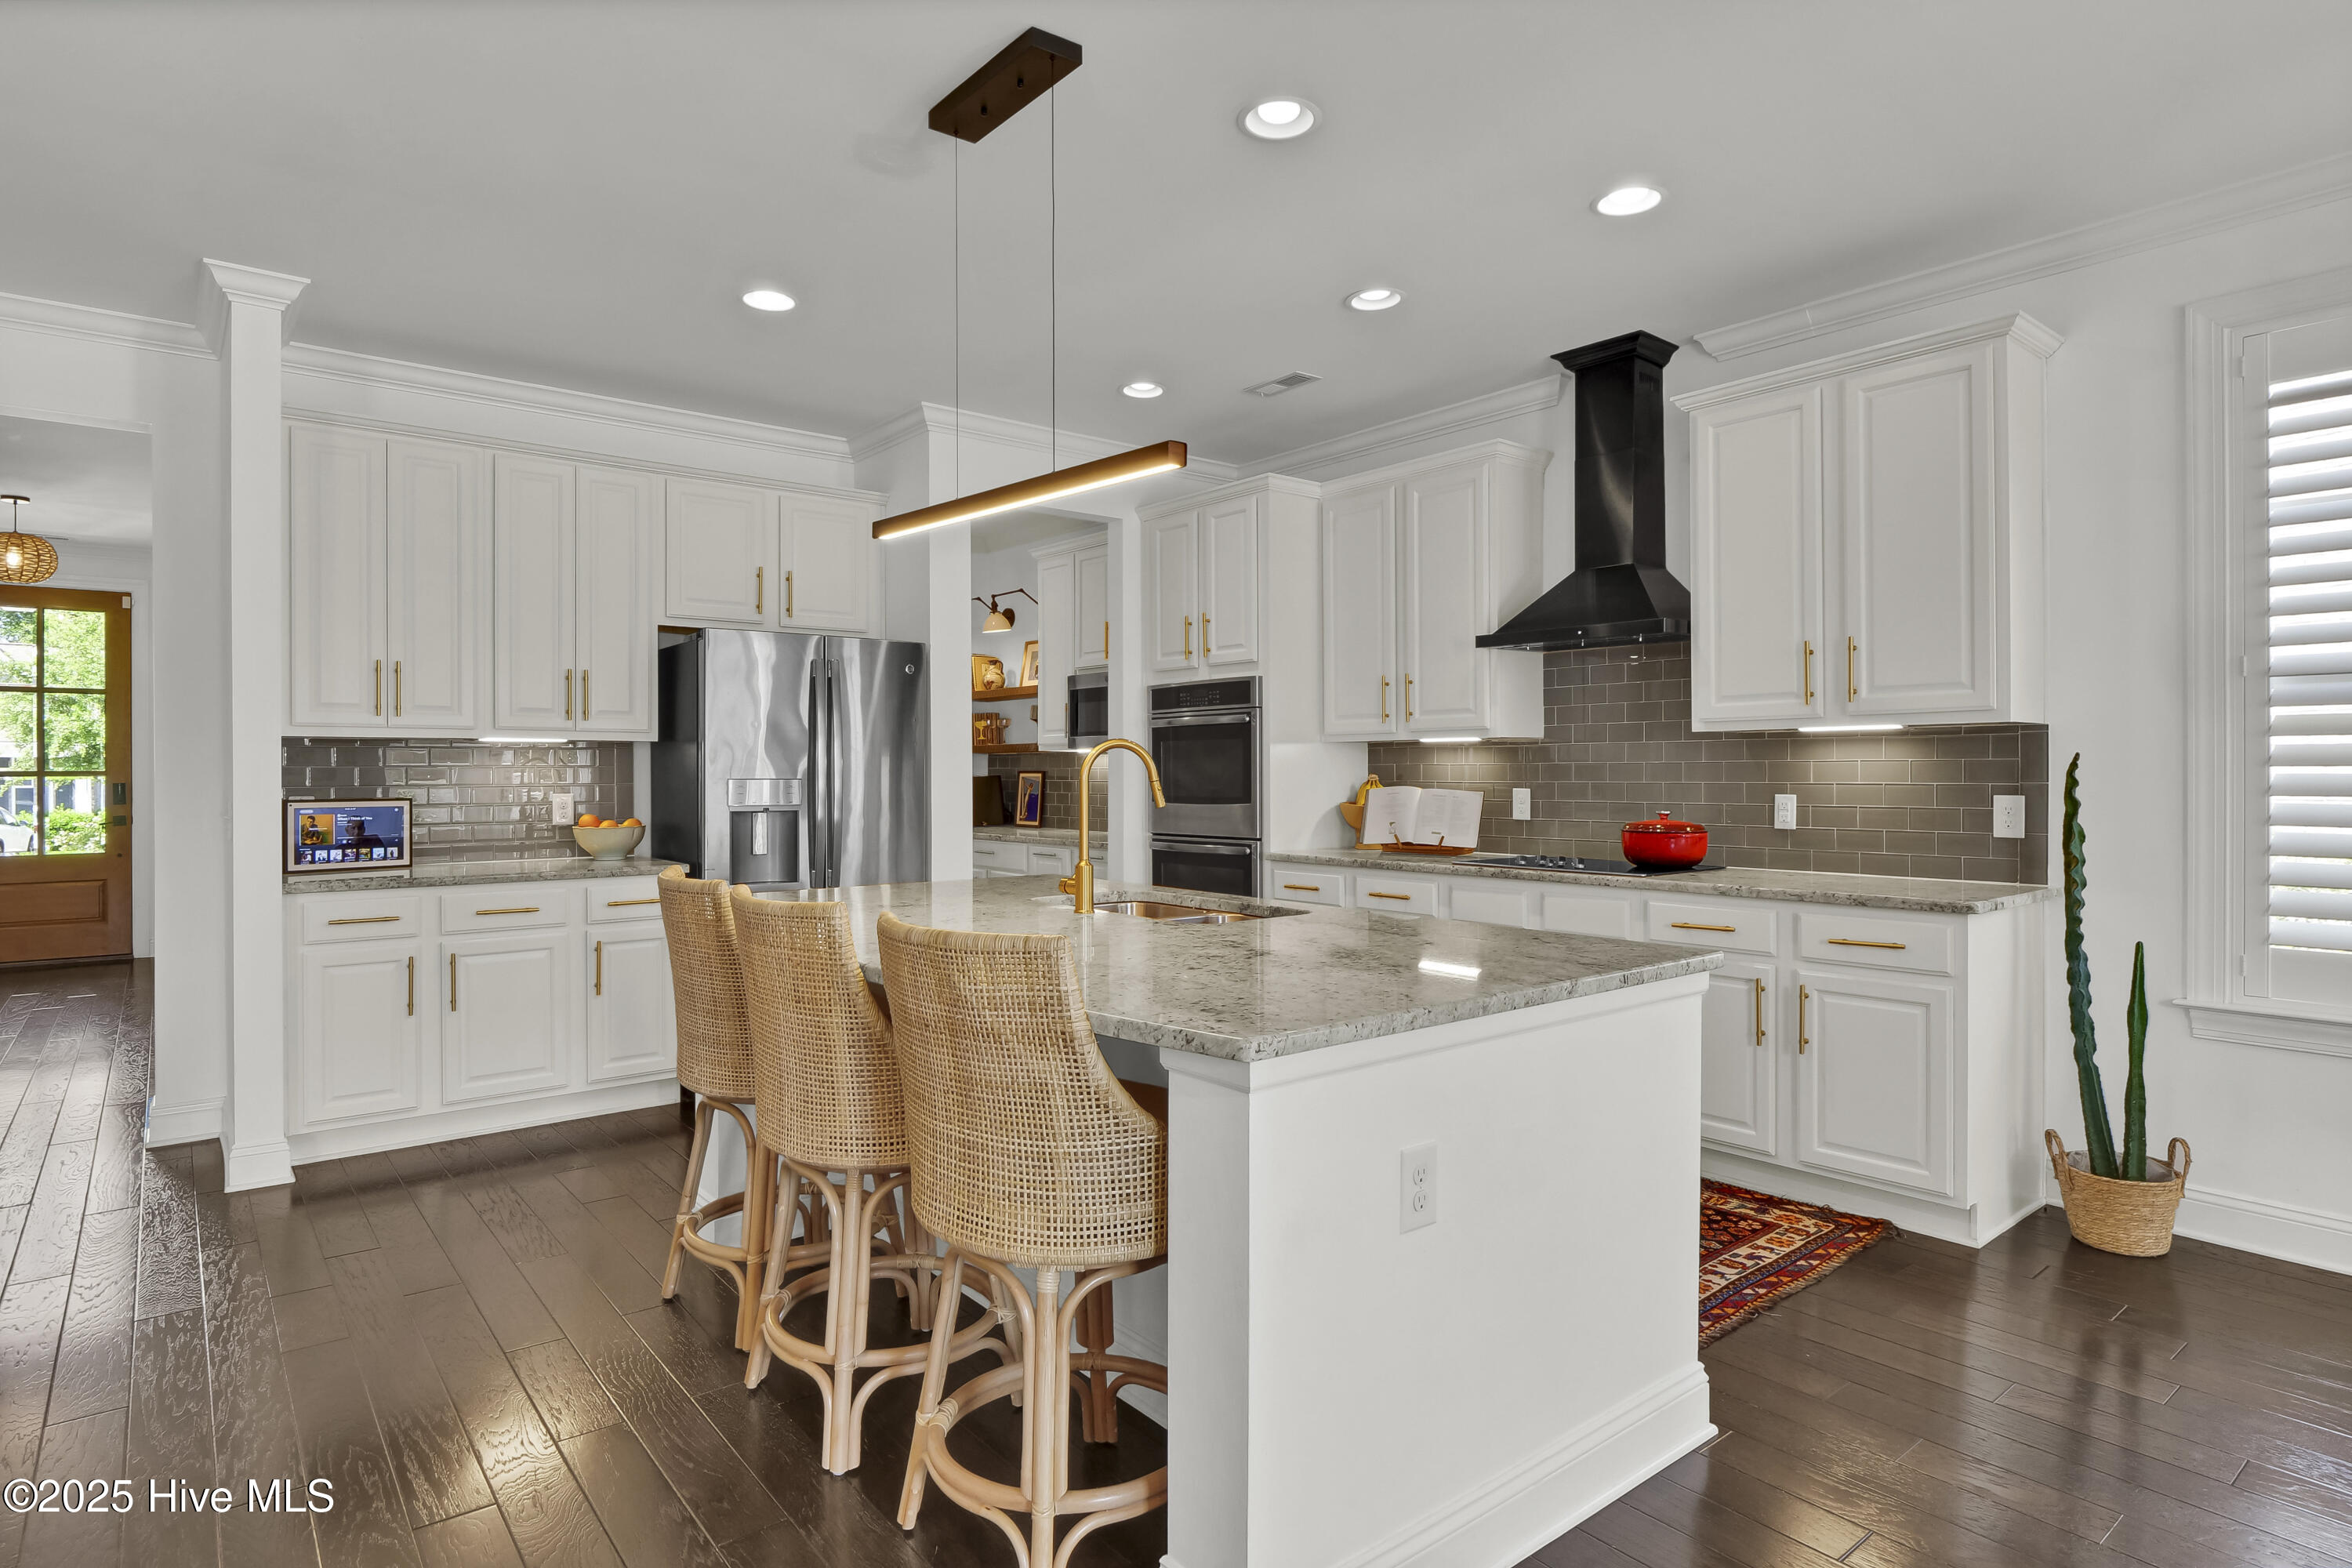
$299,999
3
bds
|
2
ba
|
2,088
sqft
|
built
2010
216 Creekwood Rd, Wilmington, NC 28411
$238
Cash flow
4.1%
Cash-on-Cash Return
6.6%
Cap rate
0.9%
Rent to Value Ratio
482 out of 719 properties for sale in Wilmington, NC
Limited Results Shown
Create a free account, or log in to reveal all property listings and enjoy the complete experience.
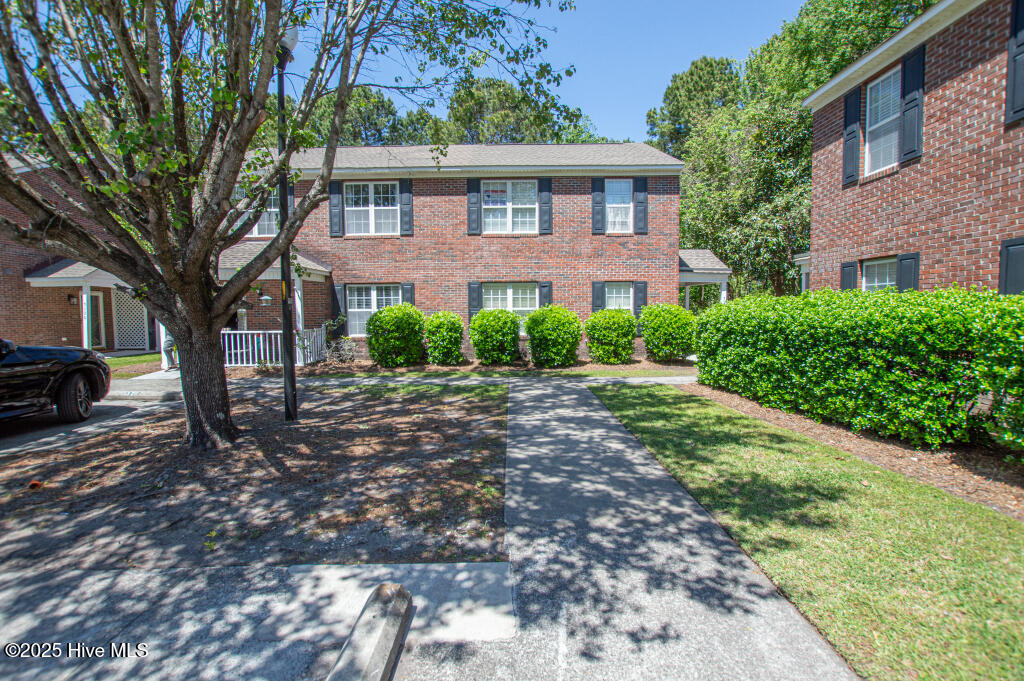
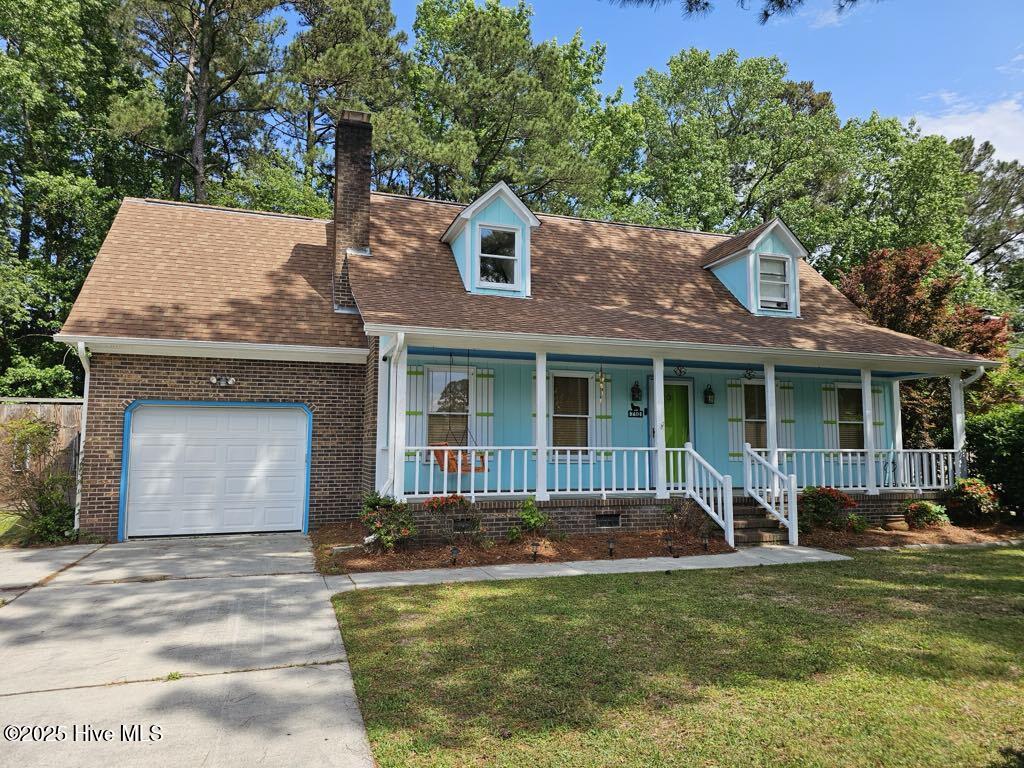
$359,900
3
bds
|
2
ba
|
1,201
sqft
|
built
1997
909 Brewster Ln, Wilmington, NC 28412
$-226
Cash flow
-3.3%
Cash-on-Cash Return
4.9%
Cap rate
0.6%
Rent to Value Ratio
$1,575,000
4
bds
|
3
ba
|
2,906
sqft
|
built
1994
8824 Shipwatch Dr, Wilmington, NC 28412
$-3,680
Cash flow
-12.2%
Cash-on-Cash Return
2.9%
Cap rate
0.4%
Rent to Value Ratio
$299,999
3
bds
|
2
ba
|
2,088
sqft
|
built
2010
216 Creekwood Rd, Wilmington, NC 28411
$238
Cash flow
4.1%
Cash-on-Cash Return
6.6%
Cap rate
0.9%
Rent to Value Ratio
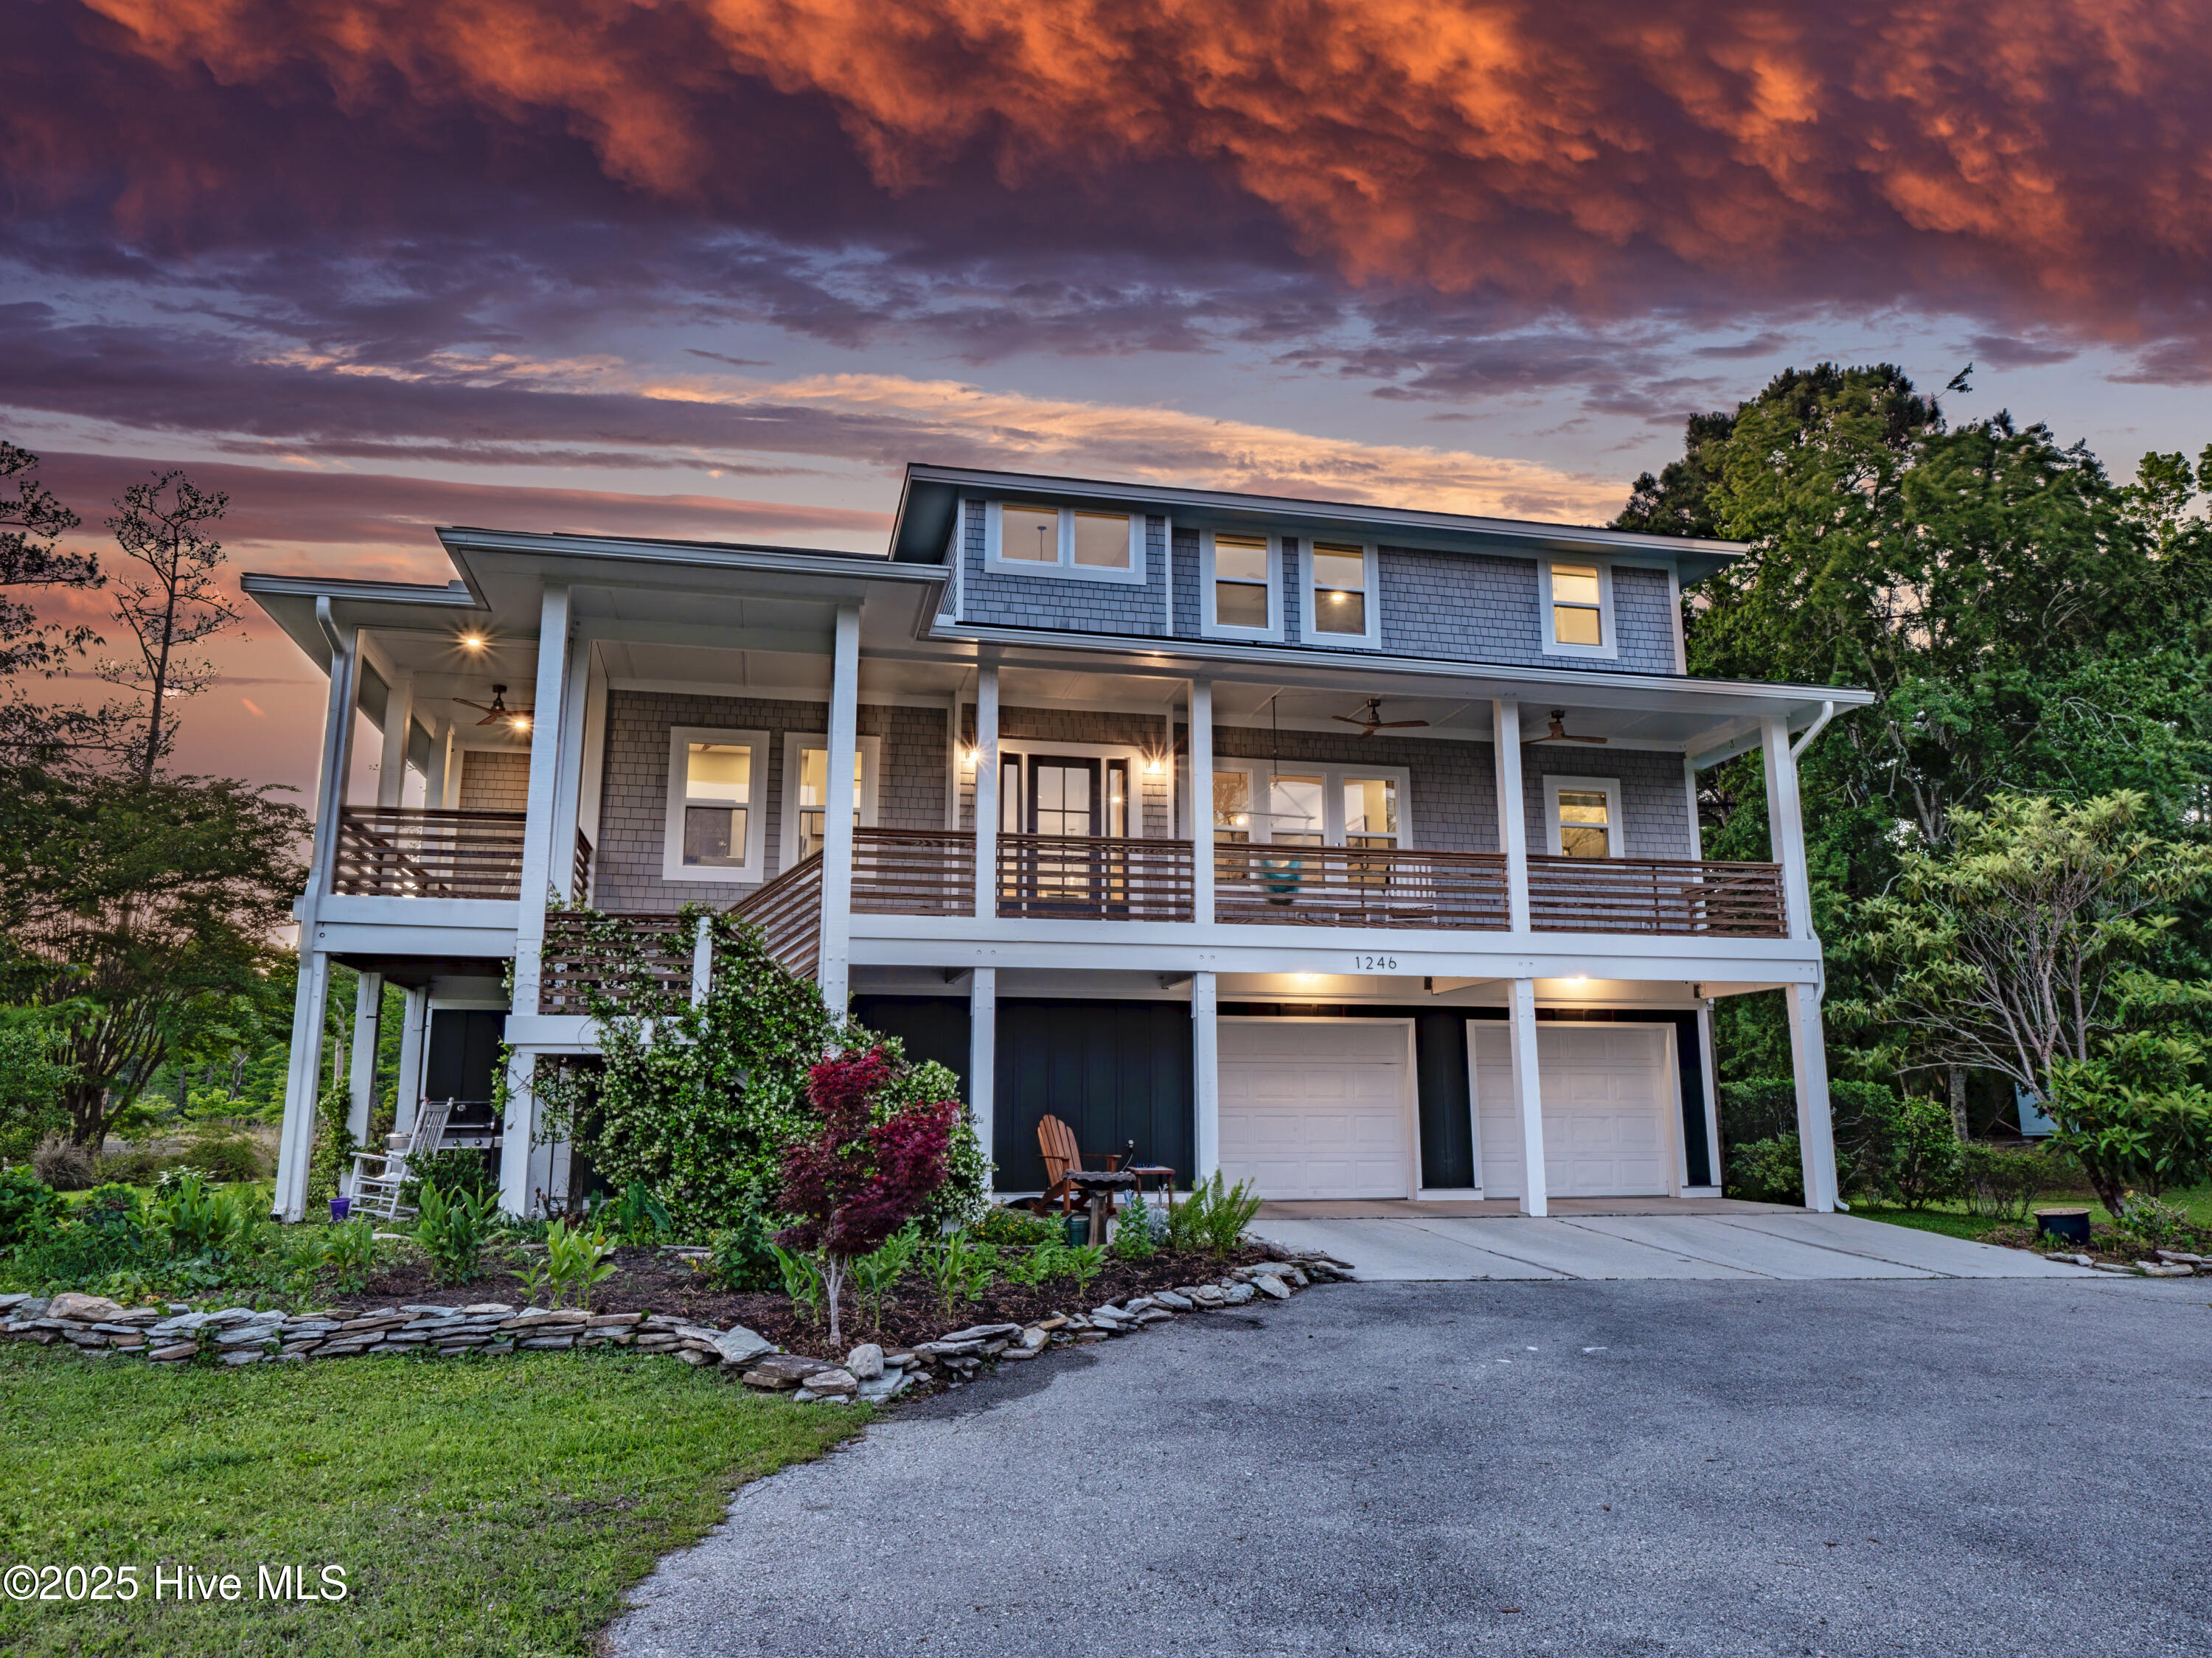
$1,899,000
3
bds
|
3
ba
|
2,884
sqft
|
built
2023
1246 Heron Run Dr, Wilmington, NC 28403
$-6,115
Cash flow
-16.8%
Cash-on-Cash Return
1.8%
Cap rate
0.3%
Rent to Value Ratio
$364,900
3
bds
|
3
ba
|
1,968
sqft
|
built
1987
2801 Hobart Dr, Wilmington, NC 28405
$-226
Cash flow
-3.2%
Cash-on-Cash Return
4.9%
Cap rate
0.7%
Rent to Value Ratio
$455,000
3
bds
|
2
ba
|
2,112
sqft
|
built
1978
4 Pinewood Cir, Wilmington, NC 28409
$-809
Cash flow
-9.3%
Cash-on-Cash Return
3.5%
Cap rate
0.5%
Rent to Value Ratio
$299,900
2
bds
|
2
ba
|
1,063
sqft
|
built
1942
2090 Burnett Blvd, Wilmington, NC 28401
$-414
Cash flow
-7.2%
Cash-on-Cash Return
4.0%
Cap rate
0.5%
Rent to Value Ratio
$330,000
3
bds
|
2
ba
|
1,298
sqft
|
built
1992
4600 Weybridge Ln, Wilmington, NC 28409
$-319
Cash flow
-5.0%
Cash-on-Cash Return
4.5%
Cap rate
0.6%
Rent to Value Ratio
$259,000
2
bds
|
2
ba
|
1,344
sqft
|
built
1997
4105 Breezewood Dr, Wilmington, NC 28412
$-549
Cash flow
-11.1%
Cash-on-Cash Return
3.1%
Cap rate
0.7%
Rent to Value Ratio
$829,000
5
bds
|
5
ba
|
3,865
sqft
|
built
2021
8977 Cobble Ridge Dr, Wilmington, NC 28411
$-1,504
Cash flow
-9.5%
Cash-on-Cash Return
3.5%
Cap rate
0.5%
Rent to Value Ratio

$350,000
3
bds
|
3
ba
|
1,750
sqft
|
built
1977
606 Shawnee Trl, Wilmington, NC 28412
$-360
Cash flow
-5.4%
Cash-on-Cash Return
4.4%
Cap rate
0.6%
Rent to Value Ratio

$599,000
4
bds
|
3
ba
|
2,692
sqft
|
built
2019
3303 Oyster Tabby Dr, Wilmington, NC 28412
$-848
Cash flow
-7.4%
Cash-on-Cash Return
4.0%
Cap rate
0.6%
Rent to Value Ratio
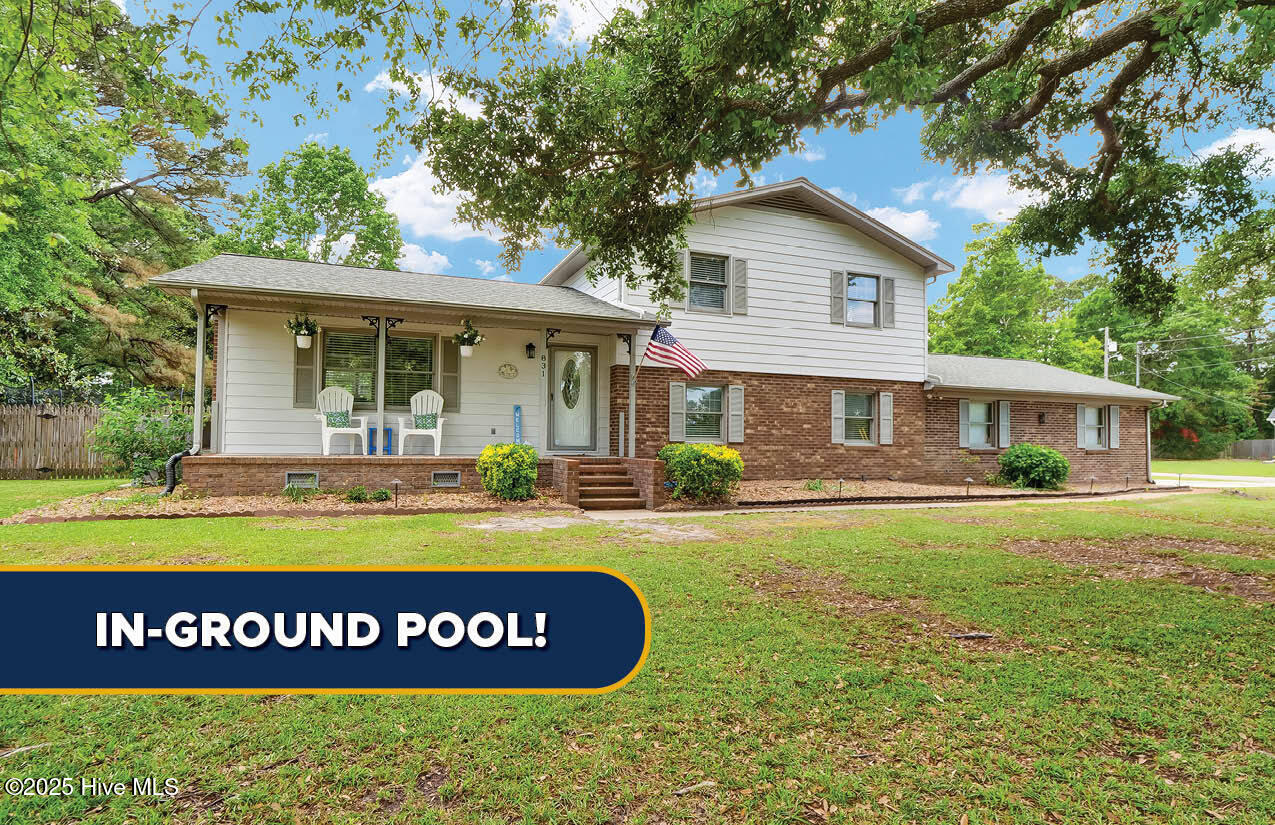
$515,000
3
bds
|
3
ba
|
1,905
sqft
|
built
1979
831 Greenbriar Rd, Wilmington, NC 28409
$-614
Cash flow
-6.2%
Cash-on-Cash Return
4.2%
Cap rate
0.5%
Rent to Value Ratio

$275,000
3
bds
|
1
ba
|
991
sqft
|
built
1929
21 S 13th St, Wilmington, NC 28401
$-316
Cash flow
-6.0%
Cash-on-Cash Return
4.3%
Cap rate
0.6%
Rent to Value Ratio

$390,000
3
bds
|
2
ba
|
1,305
sqft
|
built
1994
7404 Countywood Way, Wilmington, NC 28411
$-562
Cash flow
-7.5%
Cash-on-Cash Return
4.0%
Cap rate
0.5%
Rent to Value Ratio
$300,000
3
bds
|
2
ba
|
1,352
sqft
|
built
2005
9304 Long Putt Ct, Wilmington, NC 28412
$-336
Cash flow
-5.8%
Cash-on-Cash Return
4.3%
Cap rate
0.7%
Rent to Value Ratio
$500,000
3
bds
|
2
ba
|
1,716
sqft
|
built
2019
128 Latitude Ln, Wilmington, NC 28412
$-659
Cash flow
-6.9%
Cash-on-Cash Return
4.1%
Cap rate
0.6%
Rent to Value Ratio

$980,000
5
bds
|
5
ba
|
3,880
sqft
|
built
1984
2118 Gloucester Pl, Wilmington, NC 28403
$-2,823
Cash flow
-15.0%
Cash-on-Cash Return
2.2%
Cap rate
0.3%
Rent to Value Ratio

$319,900
3
bds
|
2
ba
|
1,118
sqft
|
built
1971
217 Cathay Rd, Wilmington, NC 28412
$-407
Cash flow
-6.6%
Cash-on-Cash Return
4.2%
Cap rate
0.5%
Rent to Value Ratio
$798,000
4
bds
|
4
ba
|
3,242
sqft
|
built
2006
347 Lockerby Ln, Wilmington, NC 28411
$-1,813
Cash flow
-11.9%
Cash-on-Cash Return
3.0%
Cap rate
0.4%
Rent to Value Ratio
$1,150,000
5
bds
|
4
ba
|
3,916
sqft
|
built
2016
821 Bedminister Ln, Wilmington, NC 28405
$-3,170
Cash flow
-14.4%
Cash-on-Cash Return
2.4%
Cap rate
0.4%
Rent to Value Ratio
$265,000
3
bds
|
2
ba
|
1,425
sqft
|
built
1996
5126 Lampost Cir, Wilmington, NC 28403
$-363
Cash flow
-7.1%
Cash-on-Cash Return
4.0%
Cap rate
0.7%
Rent to Value Ratio
$267,000
3
bds
|
2
ba
|
1,688
sqft
|
built
1973
125 Hampton Rd N, Wilmington, NC 28409
$485
Cash flow
9.5%
Cash-on-Cash Return
7.9%
Cap rate
1.0%
Rent to Value Ratio
$435,000
4
bds
|
3
ba
|
1,813
sqft
|
built
1986
710 Cheryl Ln, Wilmington, NC 28405
$-377
Cash flow
-4.5%
Cash-on-Cash Return
4.6%
Cap rate
0.6%
Rent to Value Ratio
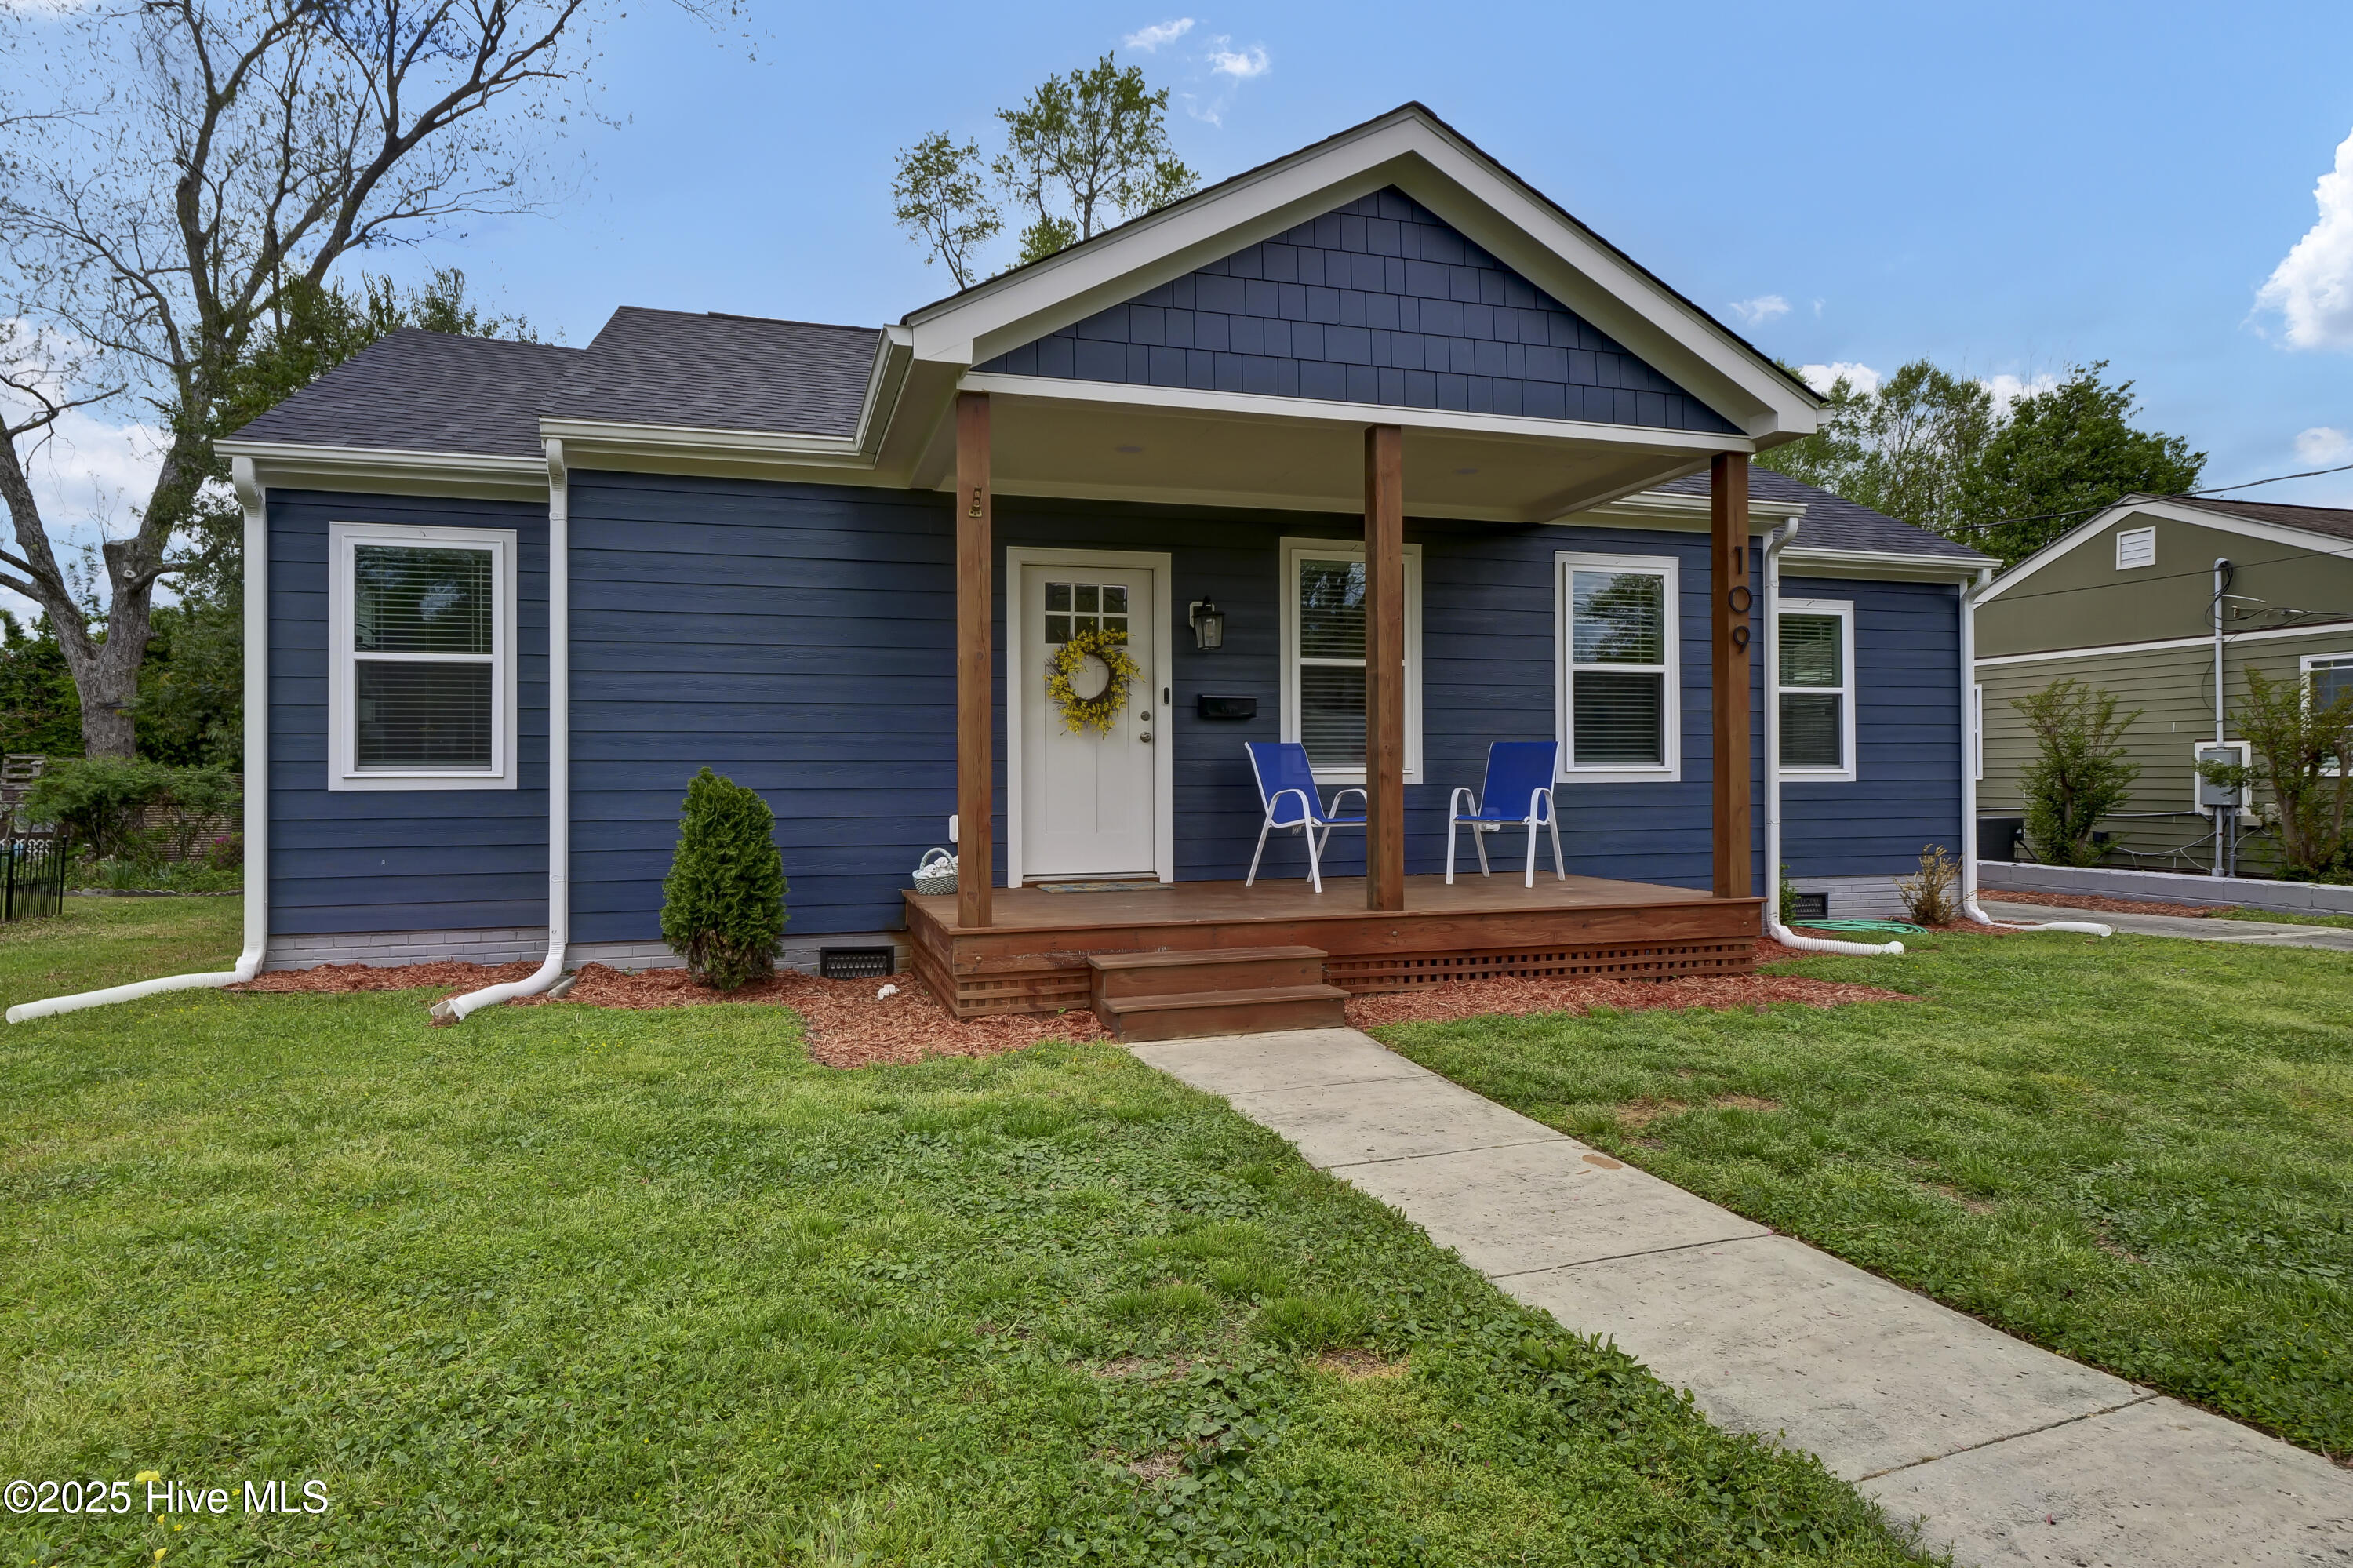
$474,500
3
bds
|
2
ba
|
1,538
sqft
|
built
1947
109 Barnard Dr, Wilmington, NC 28405
$-584
Cash flow
-6.4%
Cash-on-Cash Return
4.2%
Cap rate
0.5%
Rent to Value Ratio
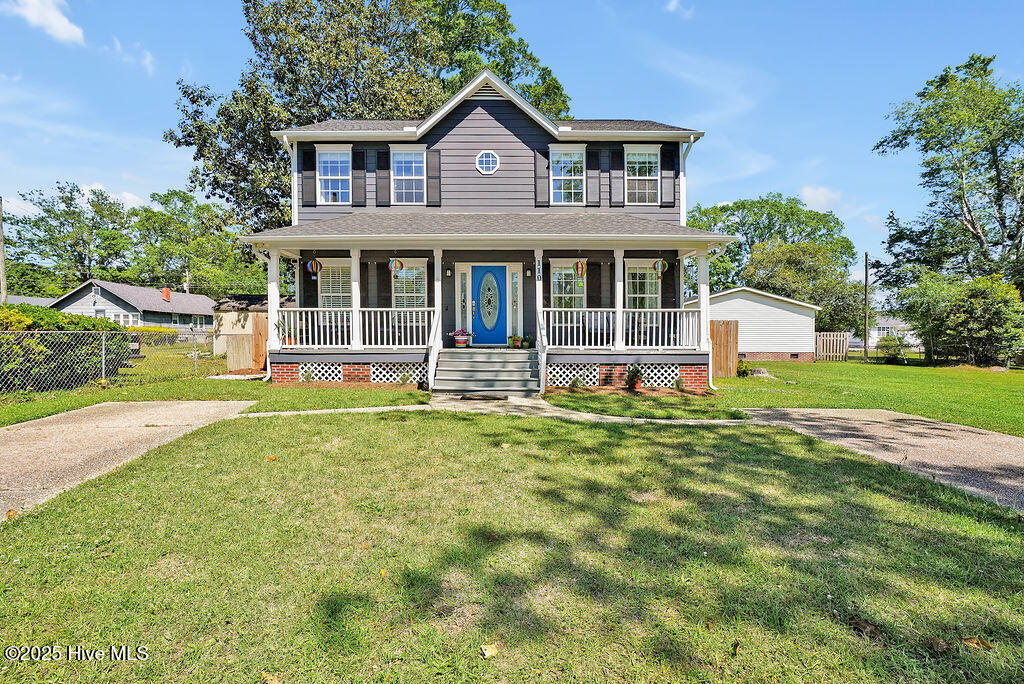
$385,000
4
bds
|
3
ba
|
1,729
sqft
|
built
2005
110 Clay St, Wilmington, NC 28405
$-97
Cash flow
-1.3%
Cash-on-Cash Return
5.4%
Cap rate
0.6%
Rent to Value Ratio

$325,000
3
bds
|
2
ba
|
1,341
sqft
|
built
1970
22 Silva Terra Dr, Wilmington, NC 28412
$-237
Cash flow
-3.8%
Cash-on-Cash Return
4.8%
Cap rate
0.6%
Rent to Value Ratio

$3,650,000
5
bds
|
4
ba
|
5,750
sqft
|
built
1999
1047 Ocean Ridge Dr, Wilmington, NC 28405
$-15,870
Cash flow
-22.7%
Cash-on-Cash Return
0.5%
Cap rate
0.1%
Rent to Value Ratio
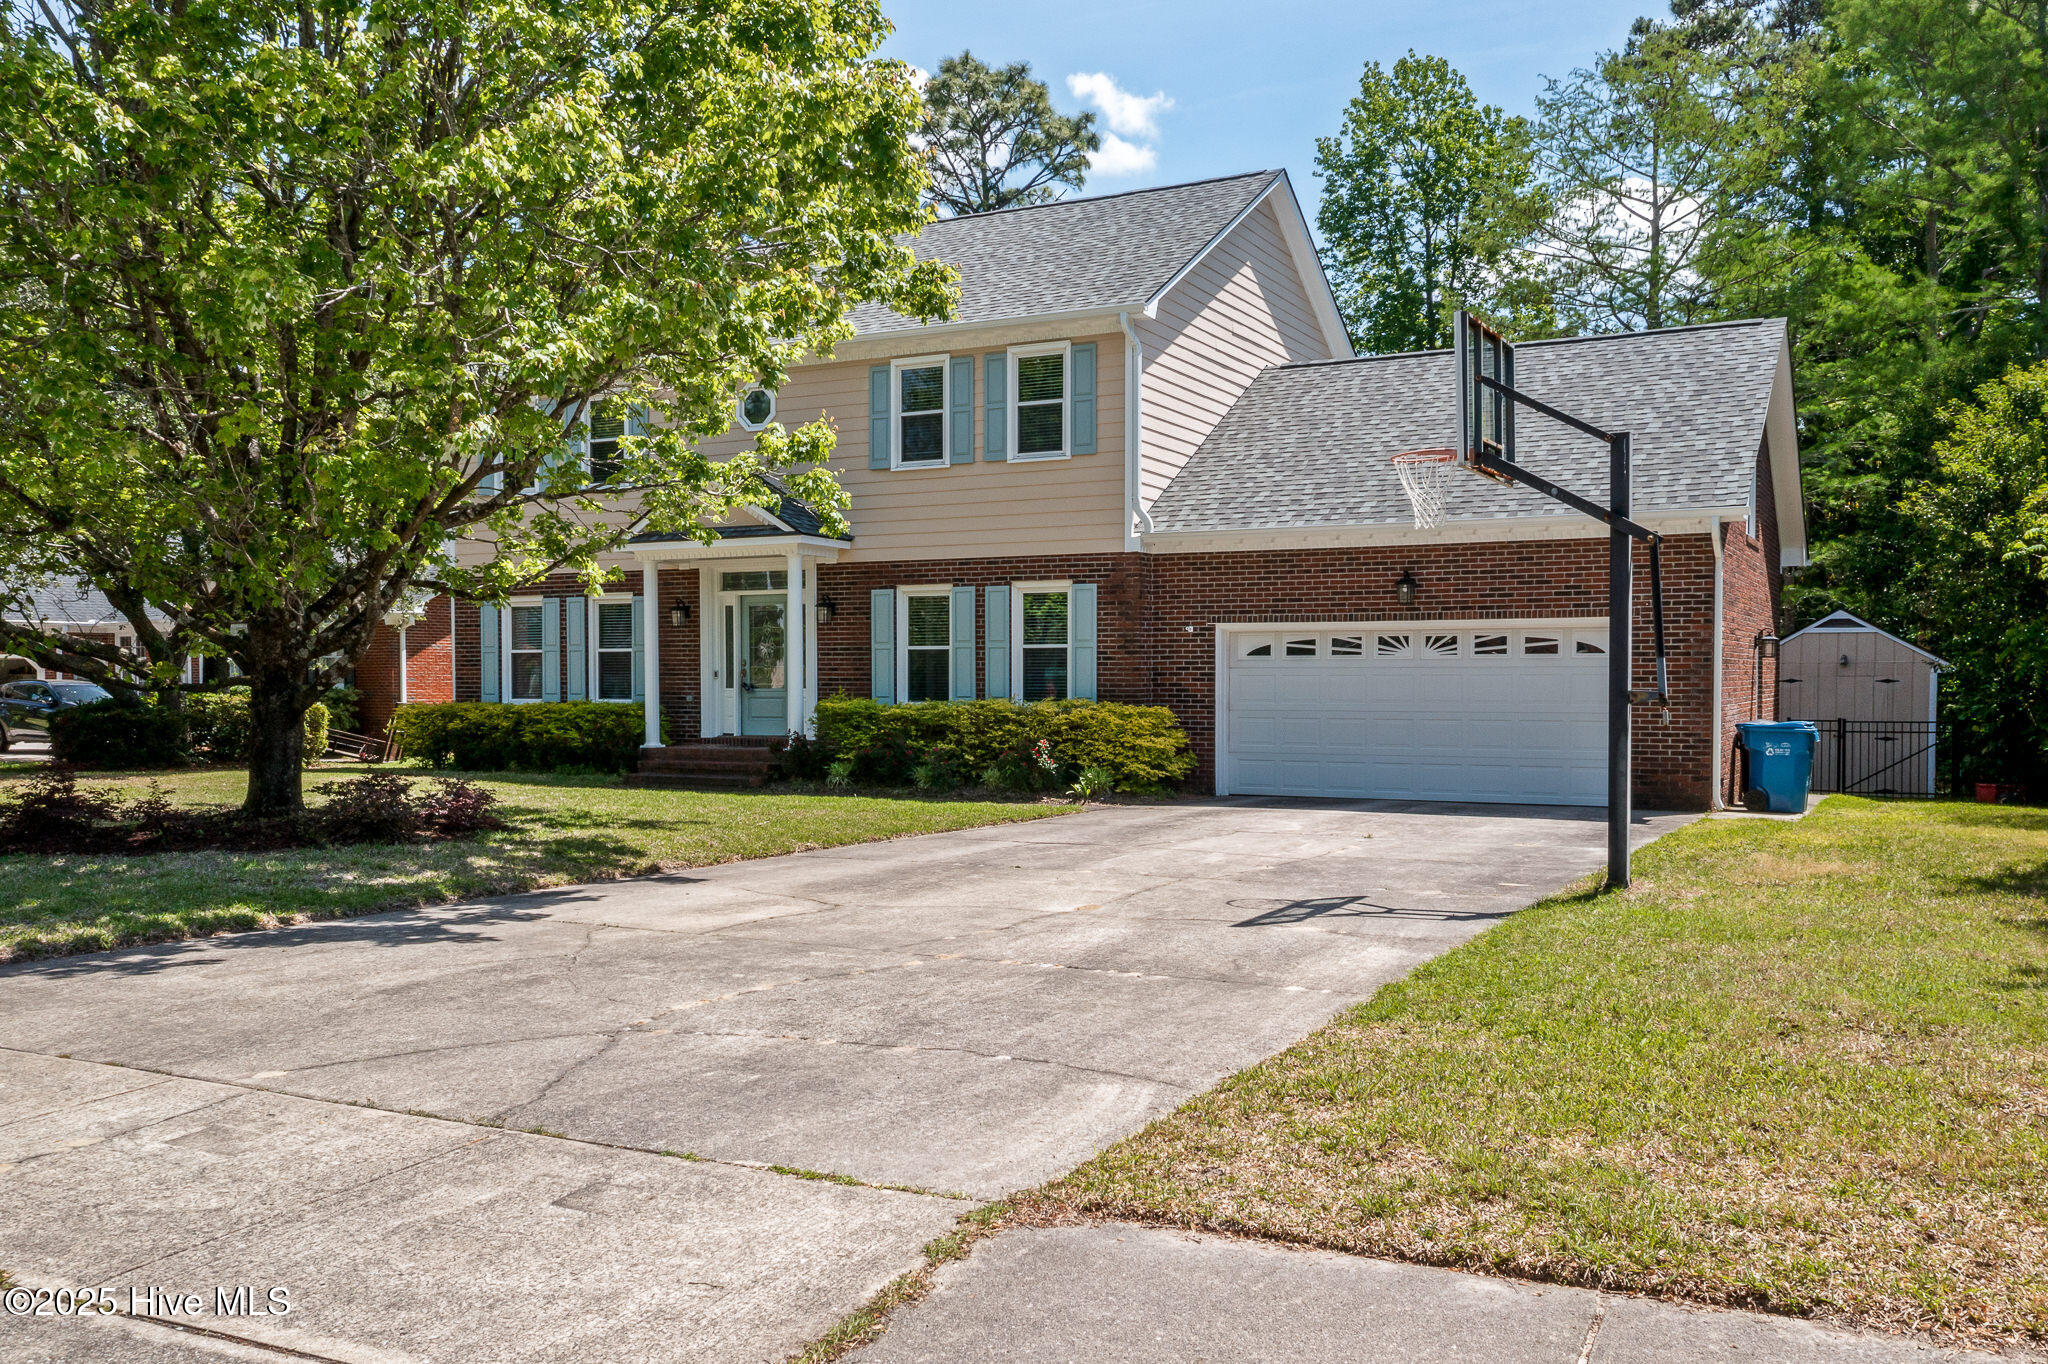
$635,000
4
bds
|
4
ba
|
2,951
sqft
|
built
1987
1428 Bexley Dr, Wilmington, NC 28412
$-1,367
Cash flow
-11.2%
Cash-on-Cash Return
3.1%
Cap rate
0.4%
Rent to Value Ratio

$239,000
4
bds
|
2
ba
|
1,400
sqft
|
built
1971
1502 N 26th St, Wilmington, NC 28405
$-134
Cash flow
-2.9%
Cash-on-Cash Return
5.0%
Cap rate
0.7%
Rent to Value Ratio

$525,000
3
bds
|
3
ba
|
2,190
sqft
|
built
1973
114 Buccaneer Rd, Wilmington, NC 28409
$-585
Cash flow
-5.8%
Cash-on-Cash Return
4.3%
Cap rate
0.6%
Rent to Value Ratio

$1,775,000
4
bds
|
5
ba
|
4,093
sqft
|
built
2005
1921 Sandwedge Pl, Wilmington, NC 28405
$-5,987
Cash flow
-17.6%
Cash-on-Cash Return
1.6%
Cap rate
0.2%
Rent to Value Ratio

$425,000
4
bds
|
3
ba
|
1,968
sqft
|
built
1976
206 Northhills Dr, Wilmington, NC 28411
$-334
Cash flow
-4.1%
Cash-on-Cash Return
4.7%
Cap rate
0.6%
Rent to Value Ratio
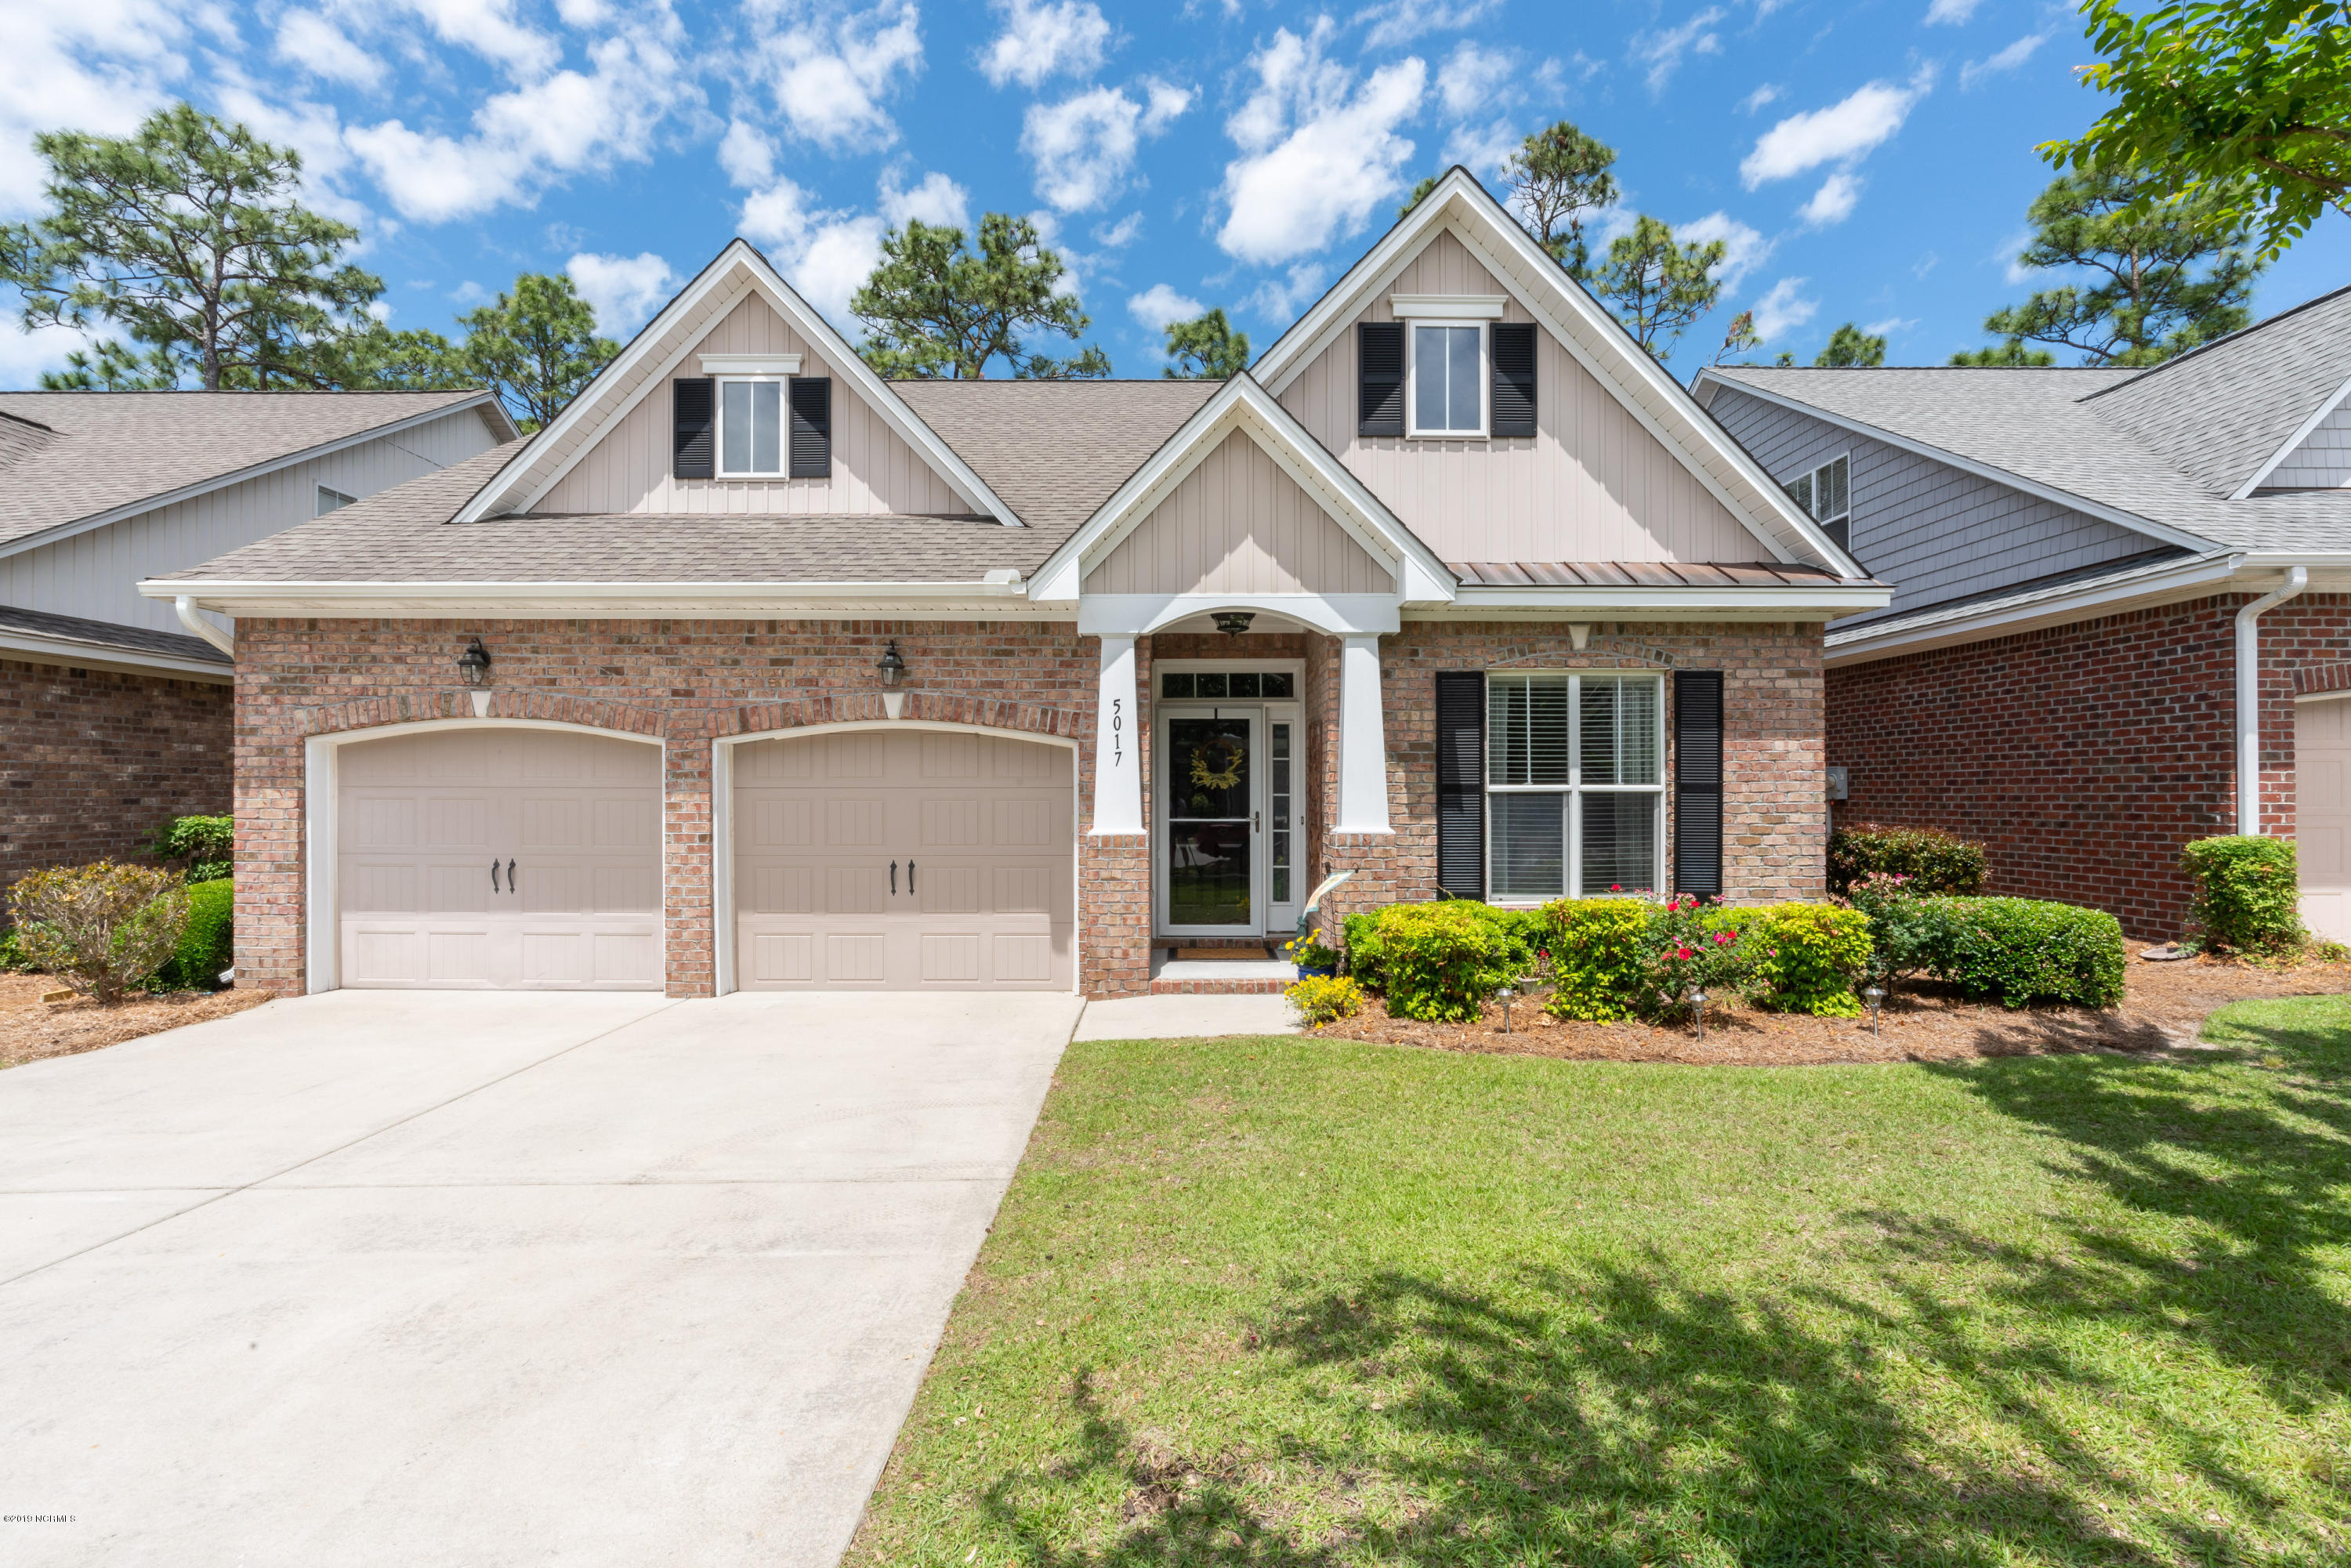
$344,500
4
bds
|
3
ba
|
2,215
sqft
|
built
2007
5017 Whitner Dr, Wilmington, NC 28409
$52
Cash flow
0.8%
Cash-on-Cash Return
5.9%
Cap rate
0.8%
Rent to Value Ratio
$1,395,000
5
bds
|
5
ba
|
3,826
sqft
|
built
1987
1723 Verrazzano Dr, Wilmington, NC 28405
$-4,646
Cash flow
-17.4%
Cash-on-Cash Return
1.7%
Cap rate
0.3%
Rent to Value Ratio

$224,000
3
bds
|
2
ba
|
1,292
sqft
|
built
1996
719 Melba Ct, Wilmington, NC 28405
$-255
Cash flow
-5.9%
Cash-on-Cash Return
4.3%
Cap rate
0.8%
Rent to Value Ratio
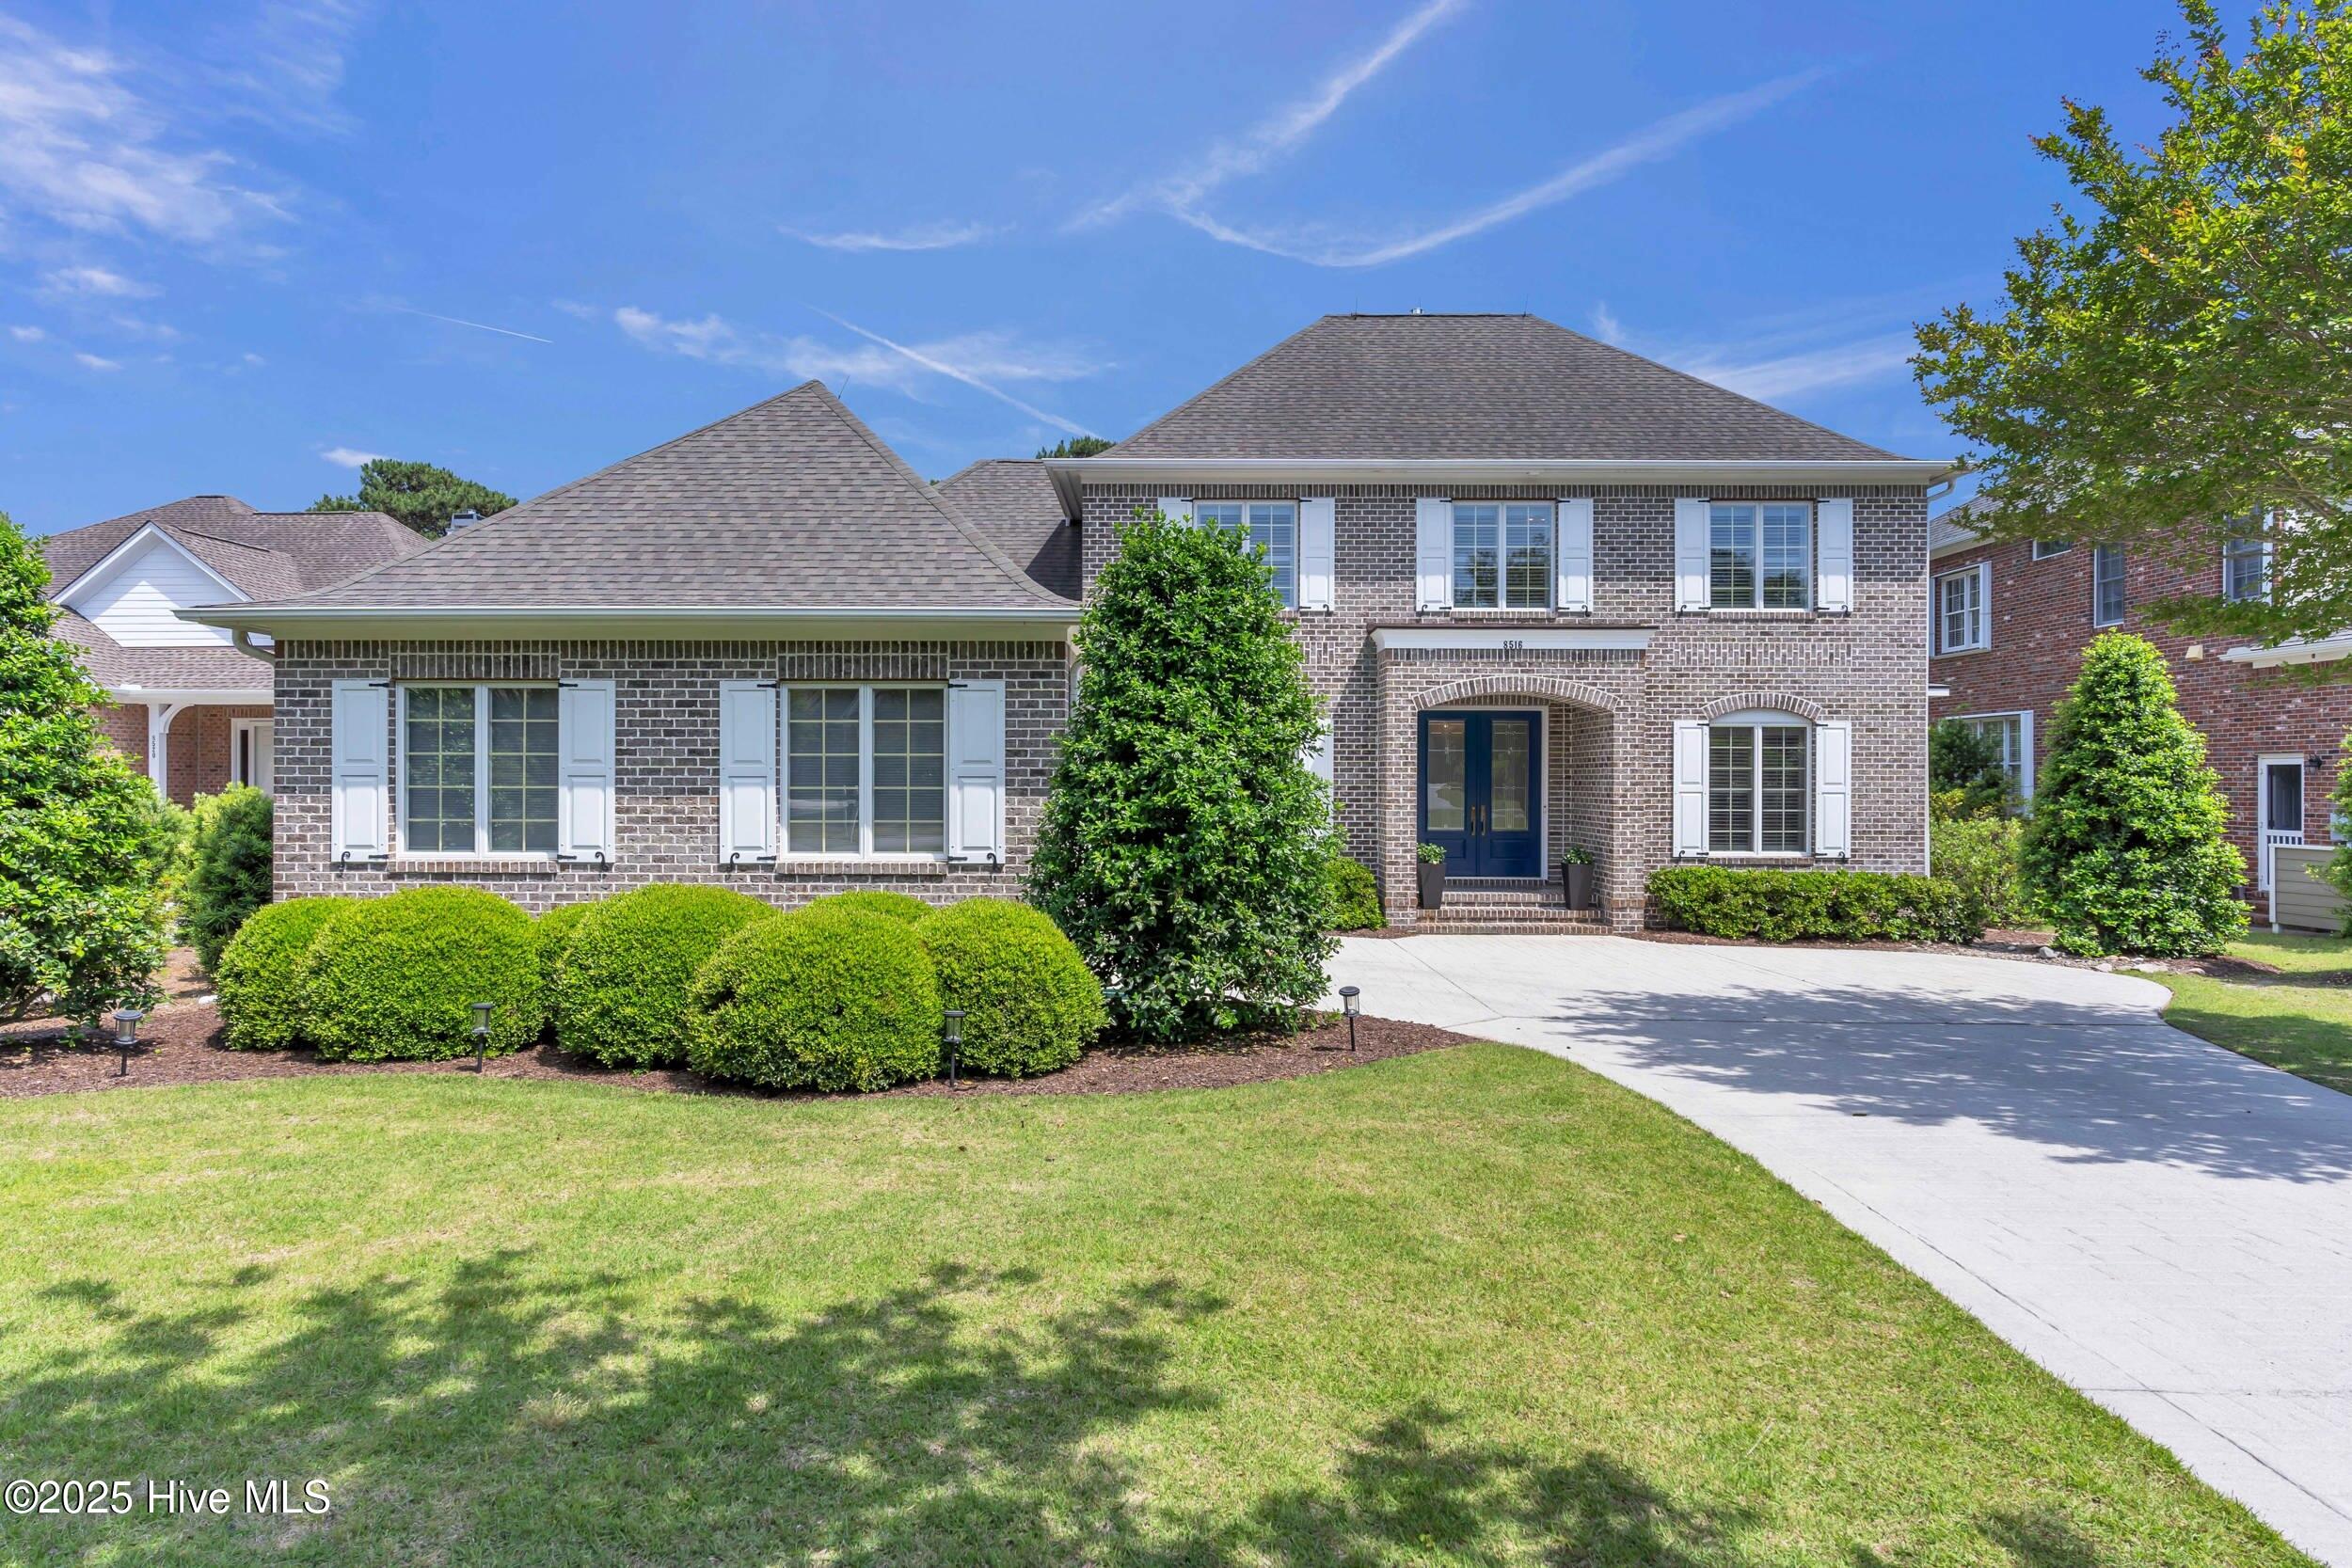
$925,000
4
bds
|
4
ba
|
3,358
sqft
|
built
2002
8516 Galloway National Dr, Wilmington, NC 28411
$-2,218
Cash flow
-12.5%
Cash-on-Cash Return
2.8%
Cap rate
0.4%
Rent to Value Ratio

$430,000
3
bds
|
2
ba
|
1,934
sqft
|
built
1981
517 Kelly Rd, Wilmington, NC 28409
$-514
Cash flow
-6.2%
Cash-on-Cash Return
4.2%
Cap rate
0.6%
Rent to Value Ratio

$370,000
3
bds
|
3
ba
|
1,835
sqft
|
built
2000
7300 Cassimir Pl, Wilmington, NC 28412
$-109
Cash flow
-1.5%
Cash-on-Cash Return
5.3%
Cap rate
0.7%
Rent to Value Ratio

$320,000
3
bds
|
2
ba
|
1,306
sqft
|
built
2005
2354 Adams St, Wilmington, NC 28401
$-307
Cash flow
-5.0%
Cash-on-Cash Return
4.5%
Cap rate
0.6%
Rent to Value Ratio