Raleigh, NC Investment Properties for Sale
Browse homes for sale and investment properties in Raleigh, NC. Refine your search by price, property type, or more.
Best cash flowing properties in Raleigh, NC
$240,000
3
bds
|
3
ba
|
1,319
sqft
|
built
1978
4600 Millstone Dr, Raleigh, NC 27604
$-363
Cash flow
-7.9%
Cash-on-Cash Return
3.9%
Cap rate
0.7%
Rent to Value Ratio

$250,000
3
bds
|
3
ba
|
1,336
sqft
|
built
2006
4000 Volkswalk Pl, Raleigh, NC 27610
$-366
Cash flow
-7.6%
Cash-on-Cash Return
3.9%
Cap rate
0.6%
Rent to Value Ratio
90 out of 1,259 properties for sale in Raleigh, NC
Limited Results Shown
Create a free account, or log in to reveal all property listings and enjoy the complete experience.
$355,000
3
bds
|
2
ba
|
1,245
sqft
|
built
1996
1021 Forest Glen Dr, Raleigh, NC 27603
$-596
Cash flow
-8.8%
Cash-on-Cash Return
3.7%
Cap rate
0.5%
Rent to Value Ratio
$325,000
3
bds
|
3
ba
|
1,373
sqft
|
built
2002
4121 Palafox Ct, Raleigh, NC 27604
$-664
Cash flow
-10.7%
Cash-on-Cash Return
3.2%
Cap rate
0.5%
Rent to Value Ratio

$978,000
5
bds
|
4
ba
|
4,644
sqft
|
built
2002
9220 Meadow Mist Ct, Raleigh, NC 27617
$-2,514
Cash flow
-13.4%
Cash-on-Cash Return
2.6%
Cap rate
0.4%
Rent to Value Ratio
$774,900
4
bds
|
4
ba
|
3,148
sqft
|
built
2012
3612 Griffice Mill Rd, Raleigh, NC 27610
$-2,374
Cash flow
-16.0%
Cash-on-Cash Return
2.0%
Cap rate
0.3%
Rent to Value Ratio
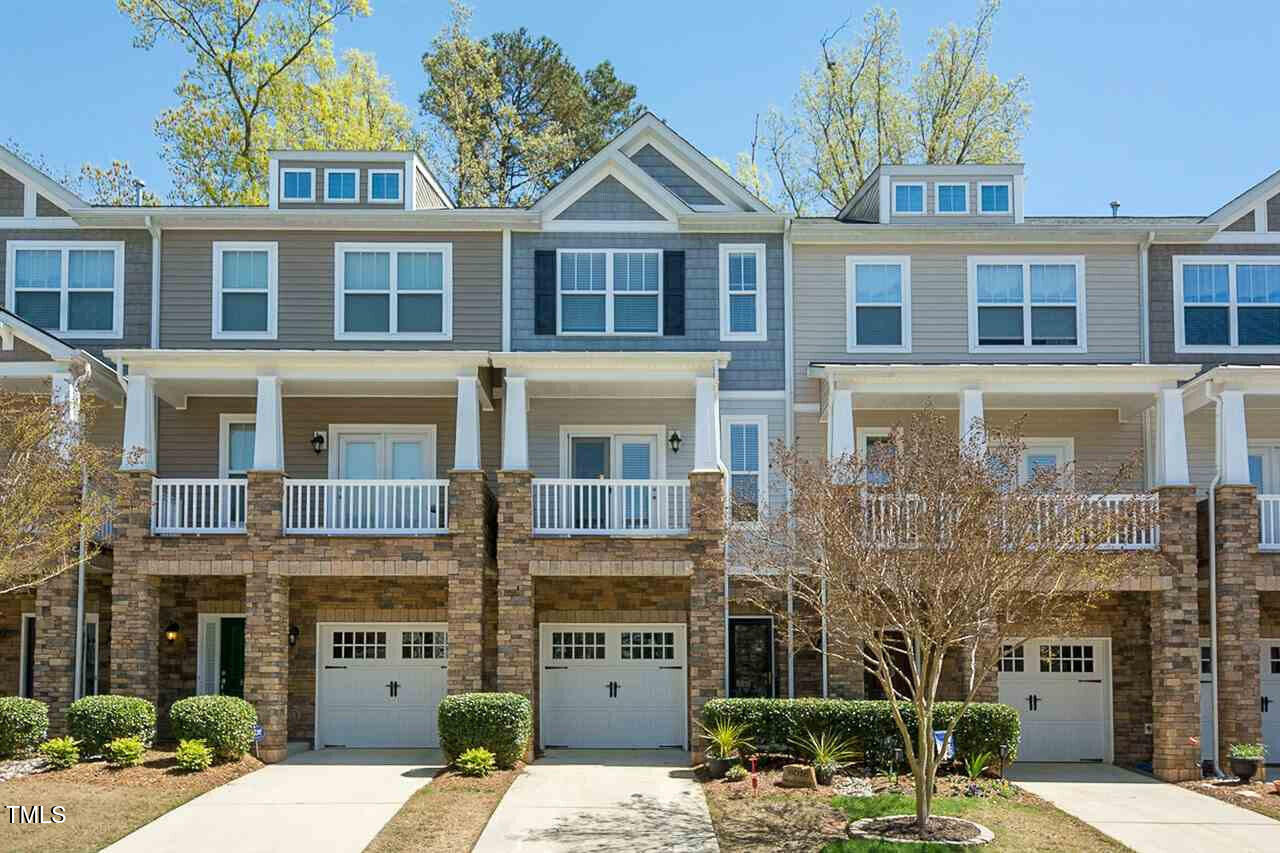
$344,990
3
bds
|
4
ba
|
1,857
sqft
|
built
2023
5432 Crescent Square St, Raleigh, NC 27616
$-477
Cash flow
-7.2%
Cash-on-Cash Return
4.0%
Cap rate
0.6%
Rent to Value Ratio
$249,900
2
bds
|
2
ba
|
1,098
sqft
|
built
1995
5557 Fieldcross Ct, Raleigh, NC 27610
$-487
Cash flow
-10.2%
Cash-on-Cash Return
3.3%
Cap rate
0.6%
Rent to Value Ratio
$775,000
5
bds
|
4
ba
|
2,706
sqft
|
built
2000
2429 Falls River Ave, Raleigh, NC 27614
$-2,225
Cash flow
-15.0%
Cash-on-Cash Return
2.2%
Cap rate
0.4%
Rent to Value Ratio

$434,900
3
bds
|
3
ba
|
1,859
sqft
|
built
2012
2459 Memory Ridge Dr, Raleigh, NC 27606
$-1,144
Cash flow
-13.7%
Cash-on-Cash Return
2.5%
Cap rate
0.5%
Rent to Value Ratio

$760,000
3
bds
|
3
ba
|
2,070
sqft
|
built
1961
1205 Glen Eden Dr, Raleigh, NC 27612
$-1,879
Cash flow
-12.9%
Cash-on-Cash Return
2.7%
Cap rate
0.4%
Rent to Value Ratio

$475,000
2
bds
|
3
ba
|
1,457
sqft
|
built
2006
444 S Blount St, Raleigh, NC 27601
$-1,660
Cash flow
-18.2%
Cash-on-Cash Return
1.5%
Cap rate
0.4%
Rent to Value Ratio
$795,000
2
bds
|
1
ba
|
1,340
sqft
|
built
1920
521 E Edenton St, Raleigh, NC 27601
$-2,842
Cash flow
-18.7%
Cash-on-Cash Return
1.4%
Cap rate
0.3%
Rent to Value Ratio
$366,900
3
bds
|
4
ba
|
1,571
sqft
|
built
2009
8016 Sycamore Hill Ln, Raleigh, NC 27612
$-913
Cash flow
-13.0%
Cash-on-Cash Return
2.7%
Cap rate
0.5%
Rent to Value Ratio
$360,000
3
bds
|
2
ba
|
1,318
sqft
|
built
1986
468 Dickens Dr, Raleigh, NC 27610
$-688
Cash flow
-10.0%
Cash-on-Cash Return
3.4%
Cap rate
0.5%
Rent to Value Ratio
$365,000
4
bds
|
2
ba
|
1,590
sqft
|
built
1969
323 Ranch Farm Rd, Raleigh, NC 27603
$-669
Cash flow
-9.6%
Cash-on-Cash Return
3.5%
Cap rate
0.5%
Rent to Value Ratio
$250,000
3
bds
|
3
ba
|
1,336
sqft
|
built
2006
4000 Volkswalk Pl, Raleigh, NC 27610
$-366
Cash flow
-7.6%
Cash-on-Cash Return
3.9%
Cap rate
0.6%
Rent to Value Ratio
$409,000
2
bds
|
3
ba
|
1,746
sqft
|
built
2001
10436 Cokesbury Ln, Raleigh, NC 27614
$-879
Cash flow
-11.2%
Cash-on-Cash Return
3.1%
Cap rate
0.5%
Rent to Value Ratio
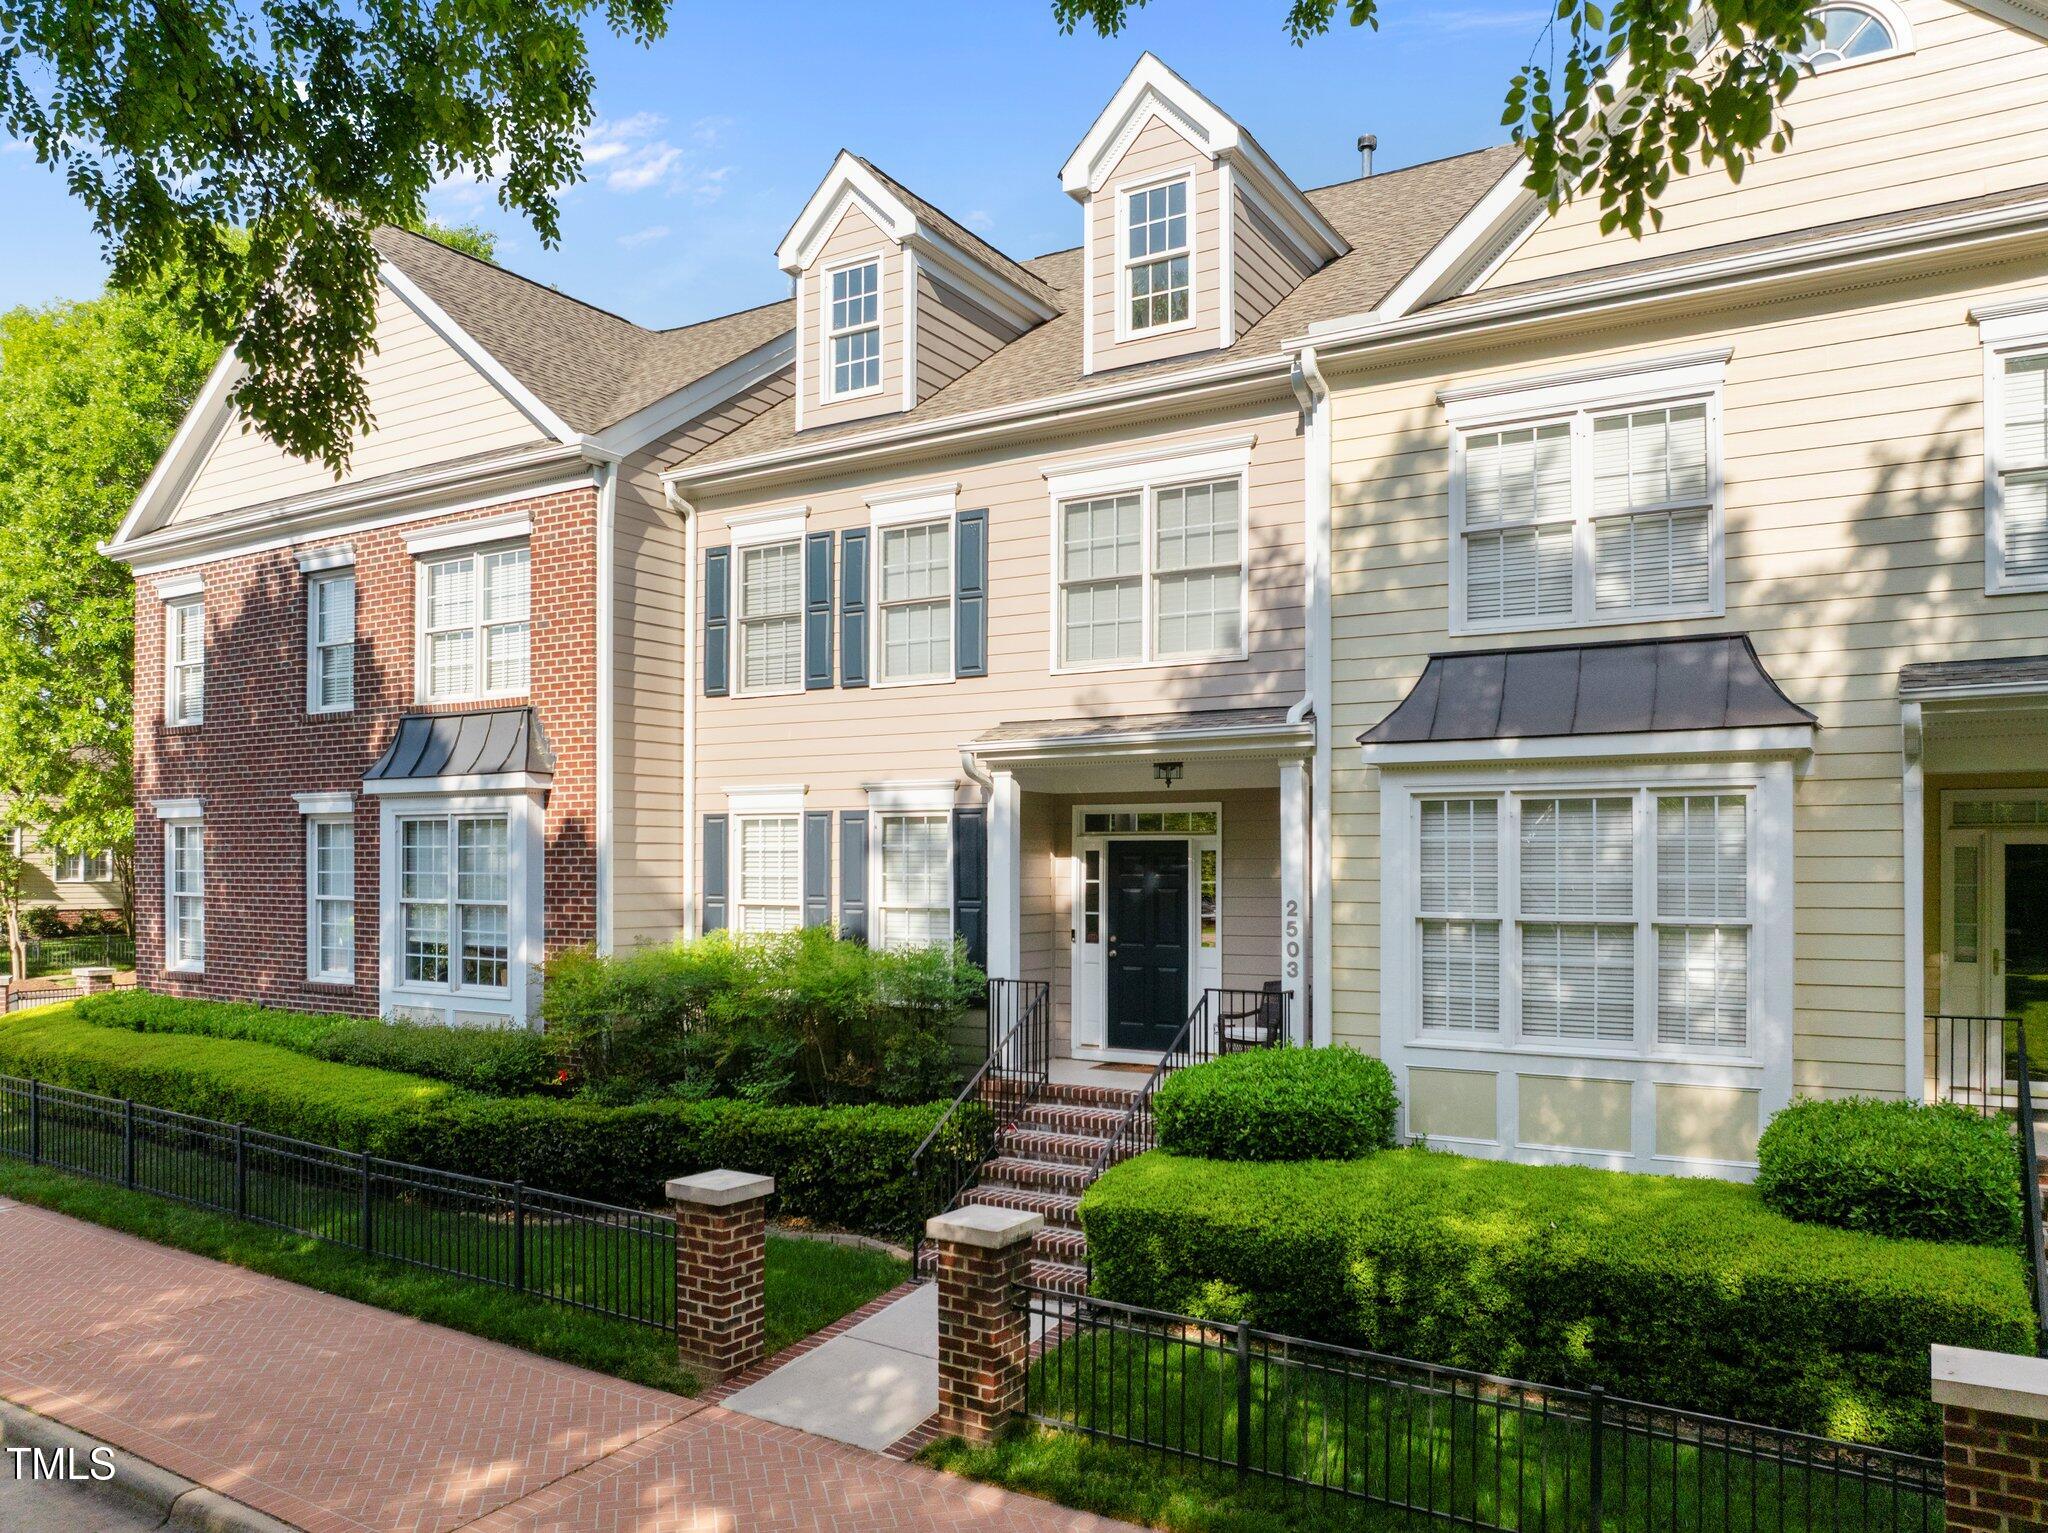
$589,000
3
bds
|
3
ba
|
2,468
sqft
|
built
2004
2503 Saint Pauls Sq, Raleigh, NC 27614
$-3,769
Cash flow
-33.4%
Cash-on-Cash Return
-2.0%
Cap rate
0.4%
Rent to Value Ratio
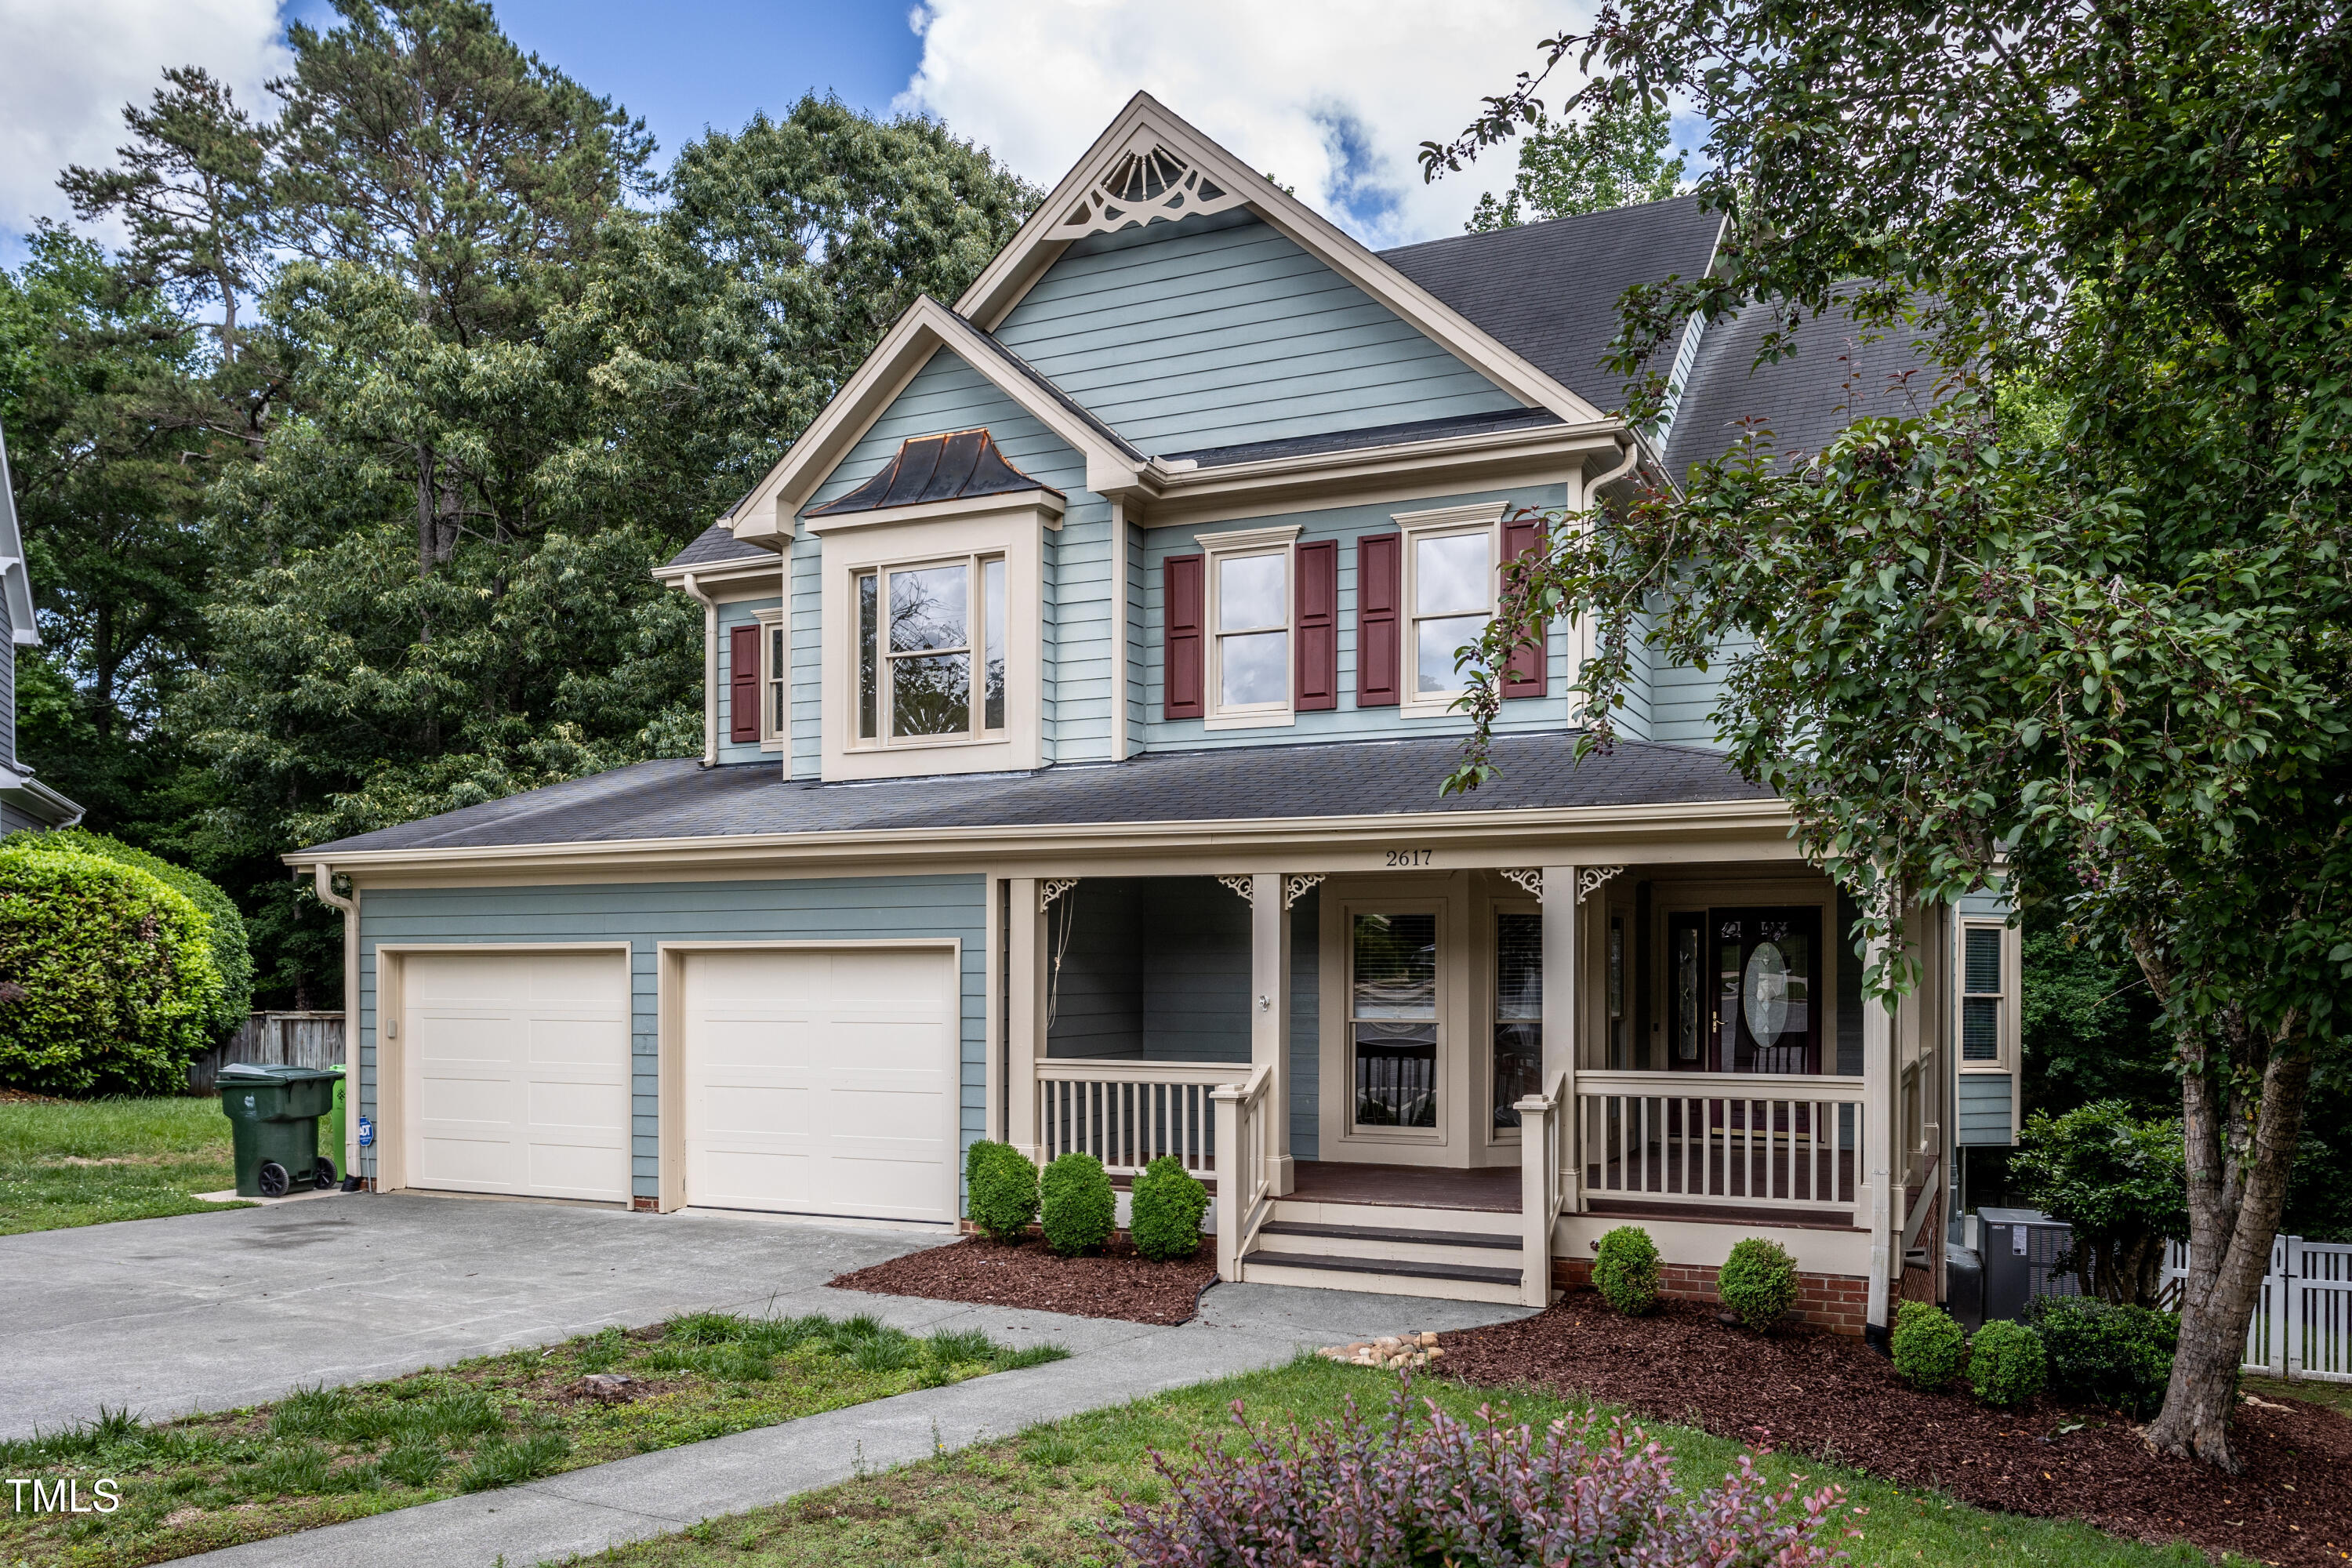
$600,000
4
bds
|
3
ba
|
2,926
sqft
|
built
2001
2617 Charenson Pl, Raleigh, NC 27614
$-1,331
Cash flow
-11.6%
Cash-on-Cash Return
3.0%
Cap rate
0.5%
Rent to Value Ratio
$750,000
3
bds
|
3
ba
|
2,466
sqft
|
built
2002
9413 Lake Villa Way, Raleigh, NC 27614
$-2,641
Cash flow
-18.4%
Cash-on-Cash Return
1.5%
Cap rate
0.3%
Rent to Value Ratio
$479,999
1
bds
|
1
ba
|
906
sqft
|
built
2020
523 S West St, Raleigh, NC 27601
$-1,515
Cash flow
-16.5%
Cash-on-Cash Return
1.9%
Cap rate
0.5%
Rent to Value Ratio
$384,000
3
bds
|
2
ba
|
1,150
sqft
|
built
1915
1512 Pender St, Raleigh, NC 27610
$-437
Cash flow
-5.9%
Cash-on-Cash Return
4.3%
Cap rate
0.5%
Rent to Value Ratio
$518,000
4
bds
|
3
ba
|
3,022
sqft
|
built
2018
2005 Ernesto Ln, Raleigh, NC 27603
$-1,289
Cash flow
-13.0%
Cash-on-Cash Return
2.7%
Cap rate
0.4%
Rent to Value Ratio

$649,000
3
bds
|
4
ba
|
1,483
sqft
|
built
2021
5 Seawell Ave, Raleigh, NC 27601
$-1,390
Cash flow
-11.2%
Cash-on-Cash Return
3.1%
Cap rate
0.6%
Rent to Value Ratio
$364,000
2
bds
|
2
ba
|
1,614
sqft
|
built
2007
4712 Fox Fern Ln, Raleigh, NC 27604
$-1,034
Cash flow
-14.8%
Cash-on-Cash Return
2.3%
Cap rate
0.5%
Rent to Value Ratio

$424,900
3
bds
|
3
ba
|
2,360
sqft
|
built
1948
1410 Cross Link Rd, Raleigh, NC 27610
$-839
Cash flow
-10.3%
Cash-on-Cash Return
3.3%
Cap rate
0.5%
Rent to Value Ratio
$429,990
4
bds
|
4
ba
|
1,908
sqft
|
built
2022
8230 Ebenezer Church Rd, Raleigh, NC 27613
$-833
Cash flow
-10.1%
Cash-on-Cash Return
3.4%
Cap rate
0.6%
Rent to Value Ratio
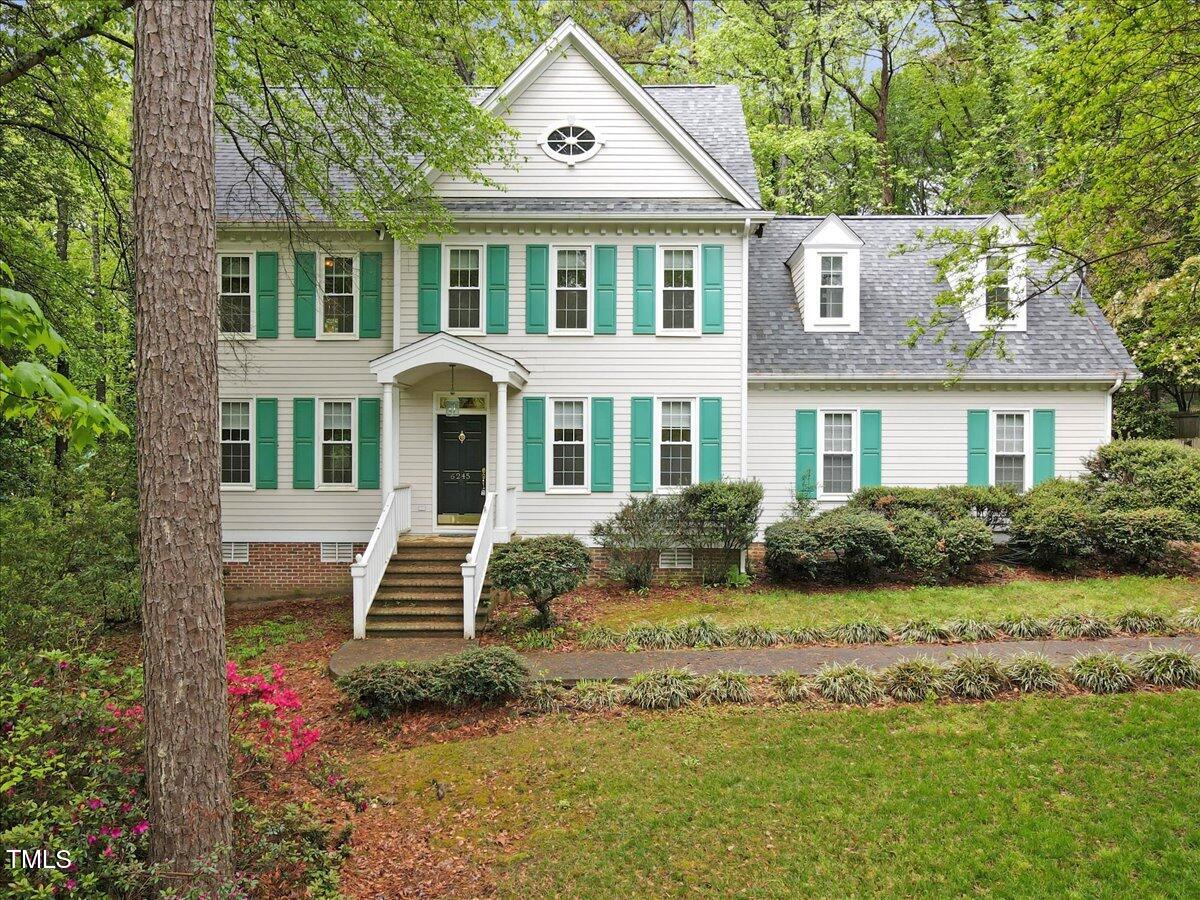
$454,000
3
bds
|
3
ba
|
2,477
sqft
|
built
1991
6245 Hampton Ridge Rd, Raleigh, NC 27603
$-785
Cash flow
-9.0%
Cash-on-Cash Return
3.6%
Cap rate
0.5%
Rent to Value Ratio

$379,999
3
bds
|
3
ba
|
1,754
sqft
|
built
2008
9221 Calabria Dr, Raleigh, NC 27617
$-1,036
Cash flow
-14.2%
Cash-on-Cash Return
2.4%
Cap rate
0.6%
Rent to Value Ratio
$459,000
3
bds
|
3
ba
|
1,751
sqft
|
built
1990
12325 Inglehurst Dr, Raleigh, NC 27613
$-1,115
Cash flow
-12.7%
Cash-on-Cash Return
2.8%
Cap rate
0.4%
Rent to Value Ratio
$240,000
3
bds
|
3
ba
|
1,319
sqft
|
built
1978
4600 Millstone Dr, Raleigh, NC 27604
$-363
Cash flow
-7.9%
Cash-on-Cash Return
3.9%
Cap rate
0.7%
Rent to Value Ratio
$1,499,000
4
bds
|
5
ba
|
5,718
sqft
|
built
2005
1300 Caistor Ln, Raleigh, NC 27614
$-3,949
Cash flow
-13.7%
Cash-on-Cash Return
2.5%
Cap rate
0.4%
Rent to Value Ratio

$499,900
4
bds
|
3
ba
|
2,873
sqft
|
built
2002
6101 Clarks Fork Dr, Raleigh, NC 27616
$-1,029
Cash flow
-10.7%
Cash-on-Cash Return
3.2%
Cap rate
0.5%
Rent to Value Ratio
$345,000
3
bds
|
2
ba
|
1,610
sqft
|
built
1994
4705 Forest Highland Dr, Raleigh, NC 27604
$-680
Cash flow
-10.3%
Cash-on-Cash Return
3.3%
Cap rate
0.5%
Rent to Value Ratio
$325,000
2
bds
|
3
ba
|
1,350
sqft
|
built
2005
5229 Moonview Ct, Raleigh, NC 27606
$-416
Cash flow
-6.7%
Cash-on-Cash Return
4.1%
Cap rate
0.6%
Rent to Value Ratio
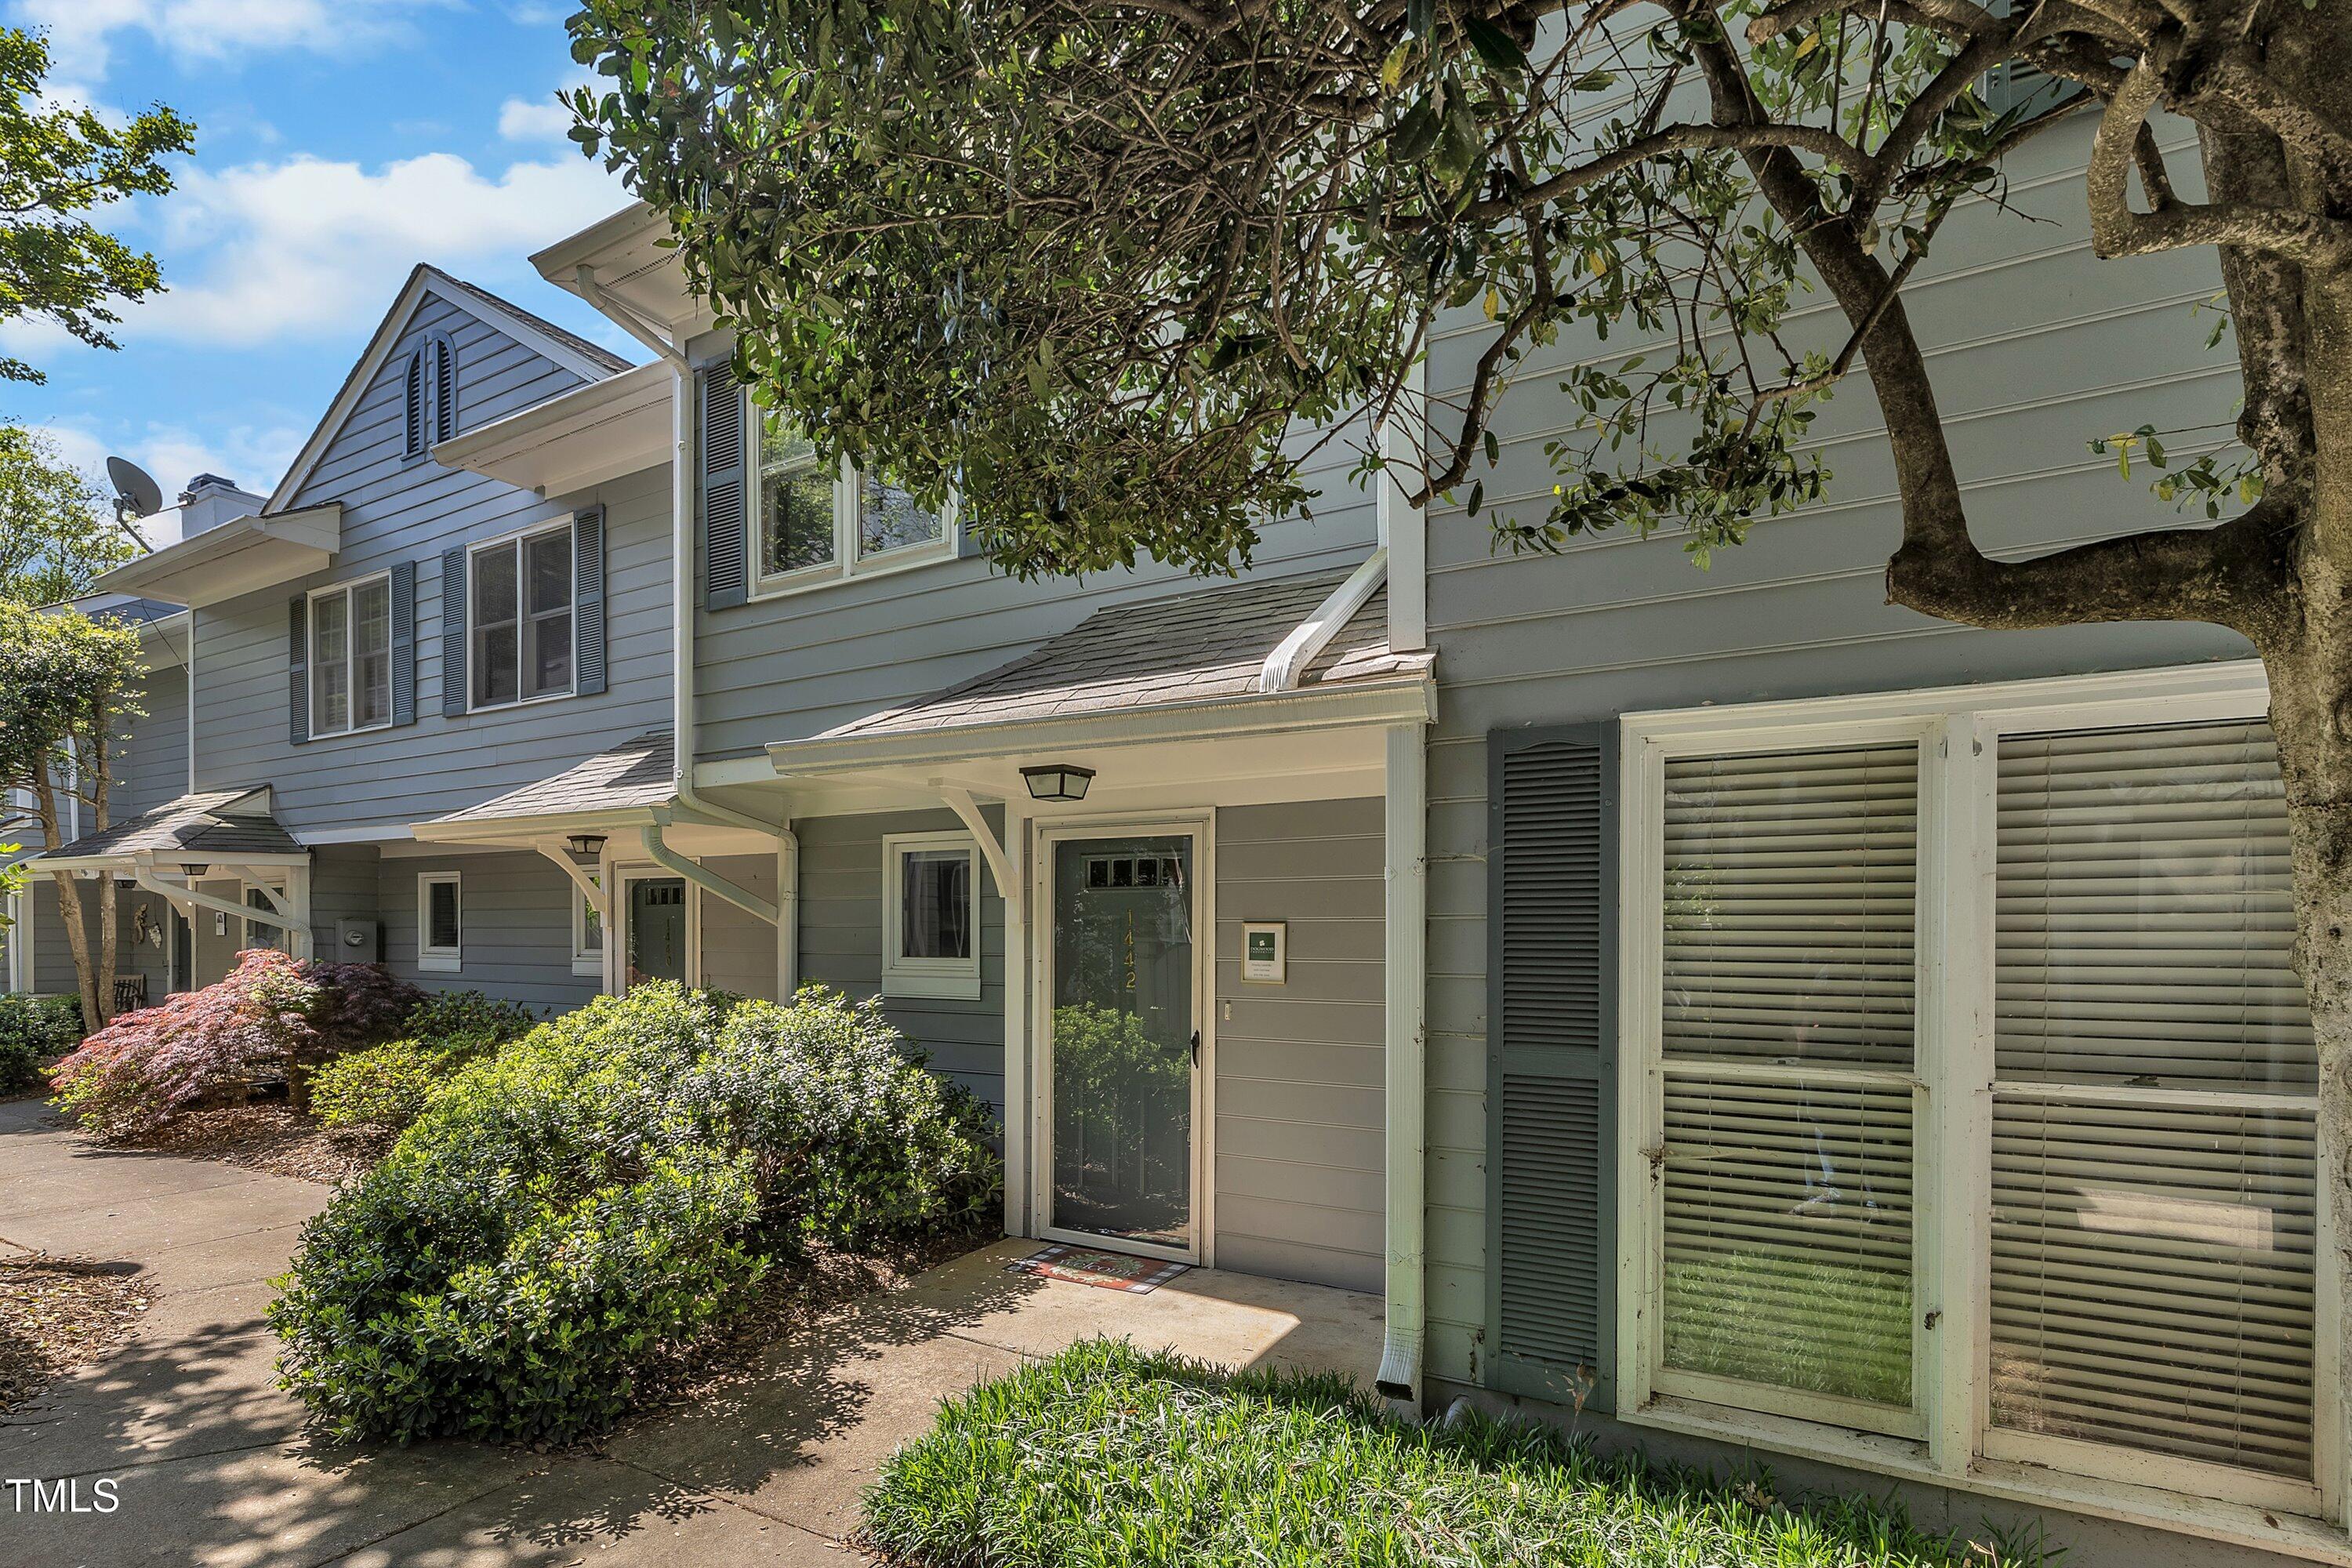
$349,900
2
bds
|
3
ba
|
1,042
sqft
|
built
1988
1442 Barton Place Dr, Raleigh, NC 27608
$-764
Cash flow
-11.4%
Cash-on-Cash Return
3.1%
Cap rate
0.6%
Rent to Value Ratio
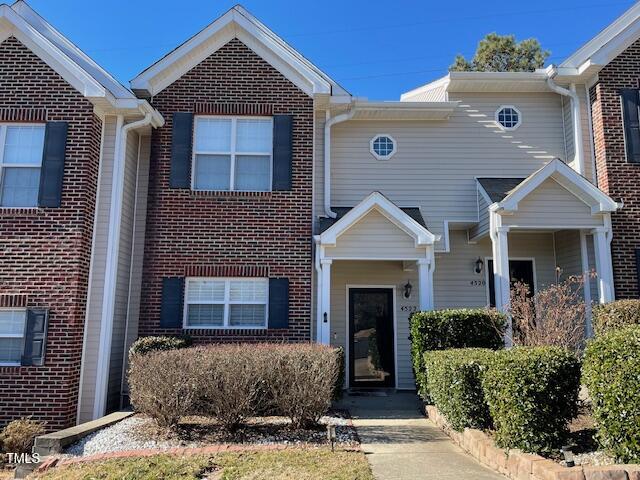
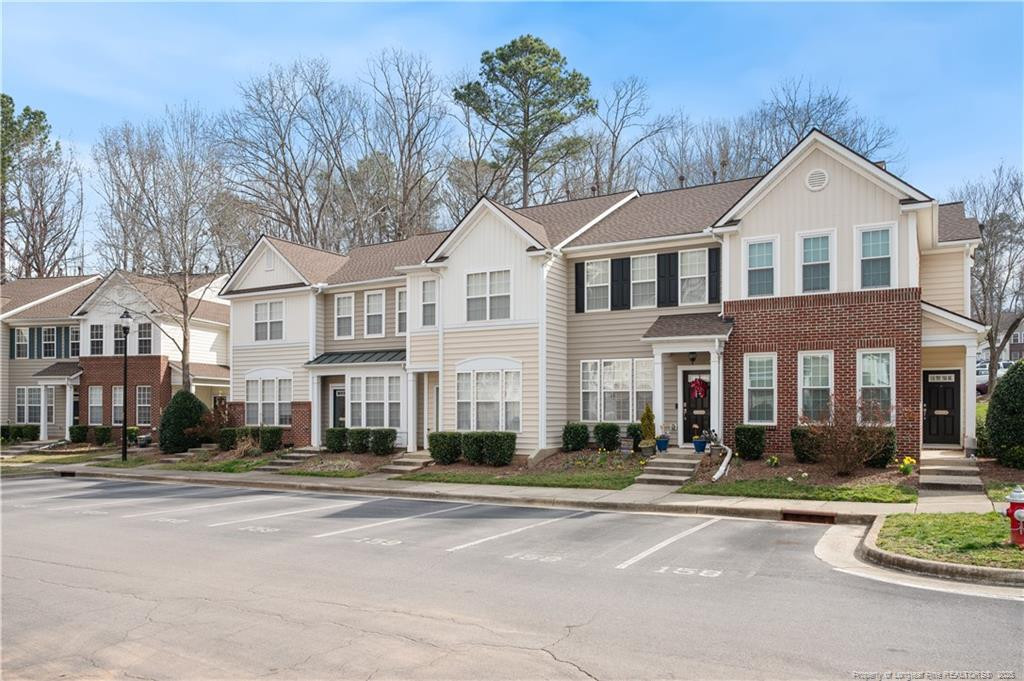
$266,900
2
bds
|
3
ba
|
1,295
sqft
|
built
2004
4522 Centrebrook Cir, Raleigh, NC 27616
$-531
Cash flow
-10.4%
Cash-on-Cash Return
3.3%
Cap rate
0.6%
Rent to Value Ratio
$2,175,000
5
bds
|
8
ba
|
6,897
sqft
|
built
2004
5768 Cavanaugh Dr, Raleigh, NC 27614
$-6,653
Cash flow
-16.0%
Cash-on-Cash Return
2.0%
Cap rate
0.3%
Rent to Value Ratio
$314,800
2
bds
|
3
ba
|
1,200
sqft
|
built
1985
7708 Falcon Rest Cir, Raleigh, NC 27615
$-596
Cash flow
-9.9%
Cash-on-Cash Return
3.4%
Cap rate
0.6%
Rent to Value Ratio
$1,690,000
3
bds
|
3
ba
|
2,284
sqft
|
built
2019
620 Wade Ave, Raleigh, NC 27605
$-6,338
Cash flow
-19.6%
Cash-on-Cash Return
1.2%
Cap rate
0.3%
Rent to Value Ratio
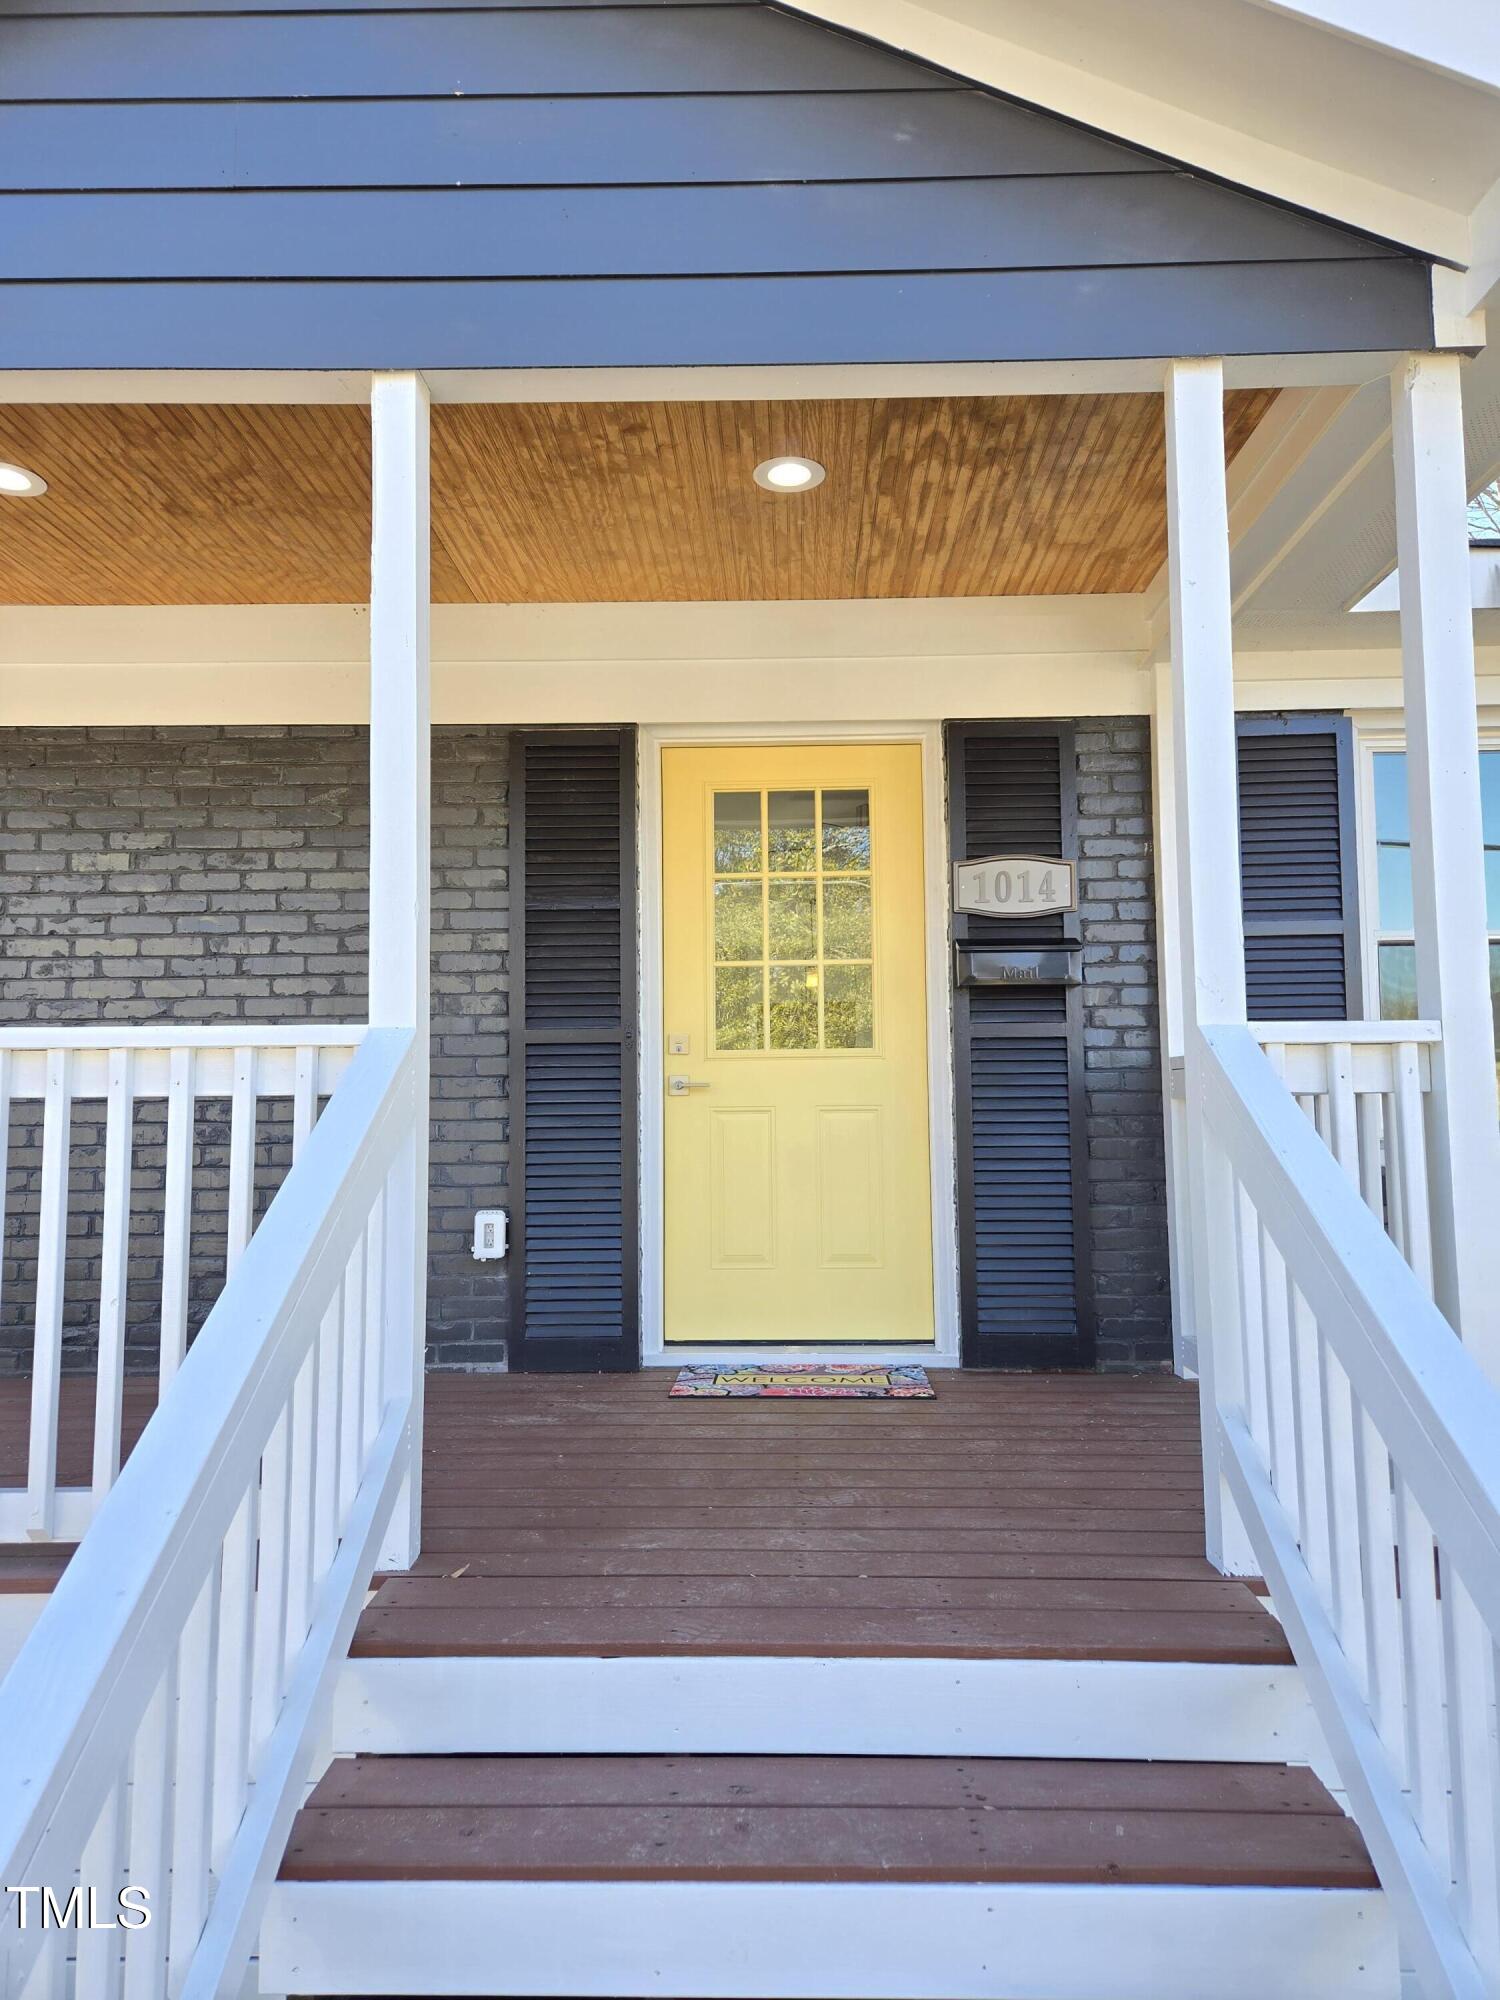
$534,900
3
bds
|
2
ba
|
1,608
sqft
|
built
1963
1014 E Jones St, Raleigh, NC 27601
$-866
Cash flow
-8.4%
Cash-on-Cash Return
3.7%
Cap rate
0.5%
Rent to Value Ratio