Phoenix, AZ Investment Properties for Sale
Browse homes for sale and investment properties in Phoenix, AZ. Refine your search by price, property type, or more.
Best cash flowing properties in Phoenix, AZ
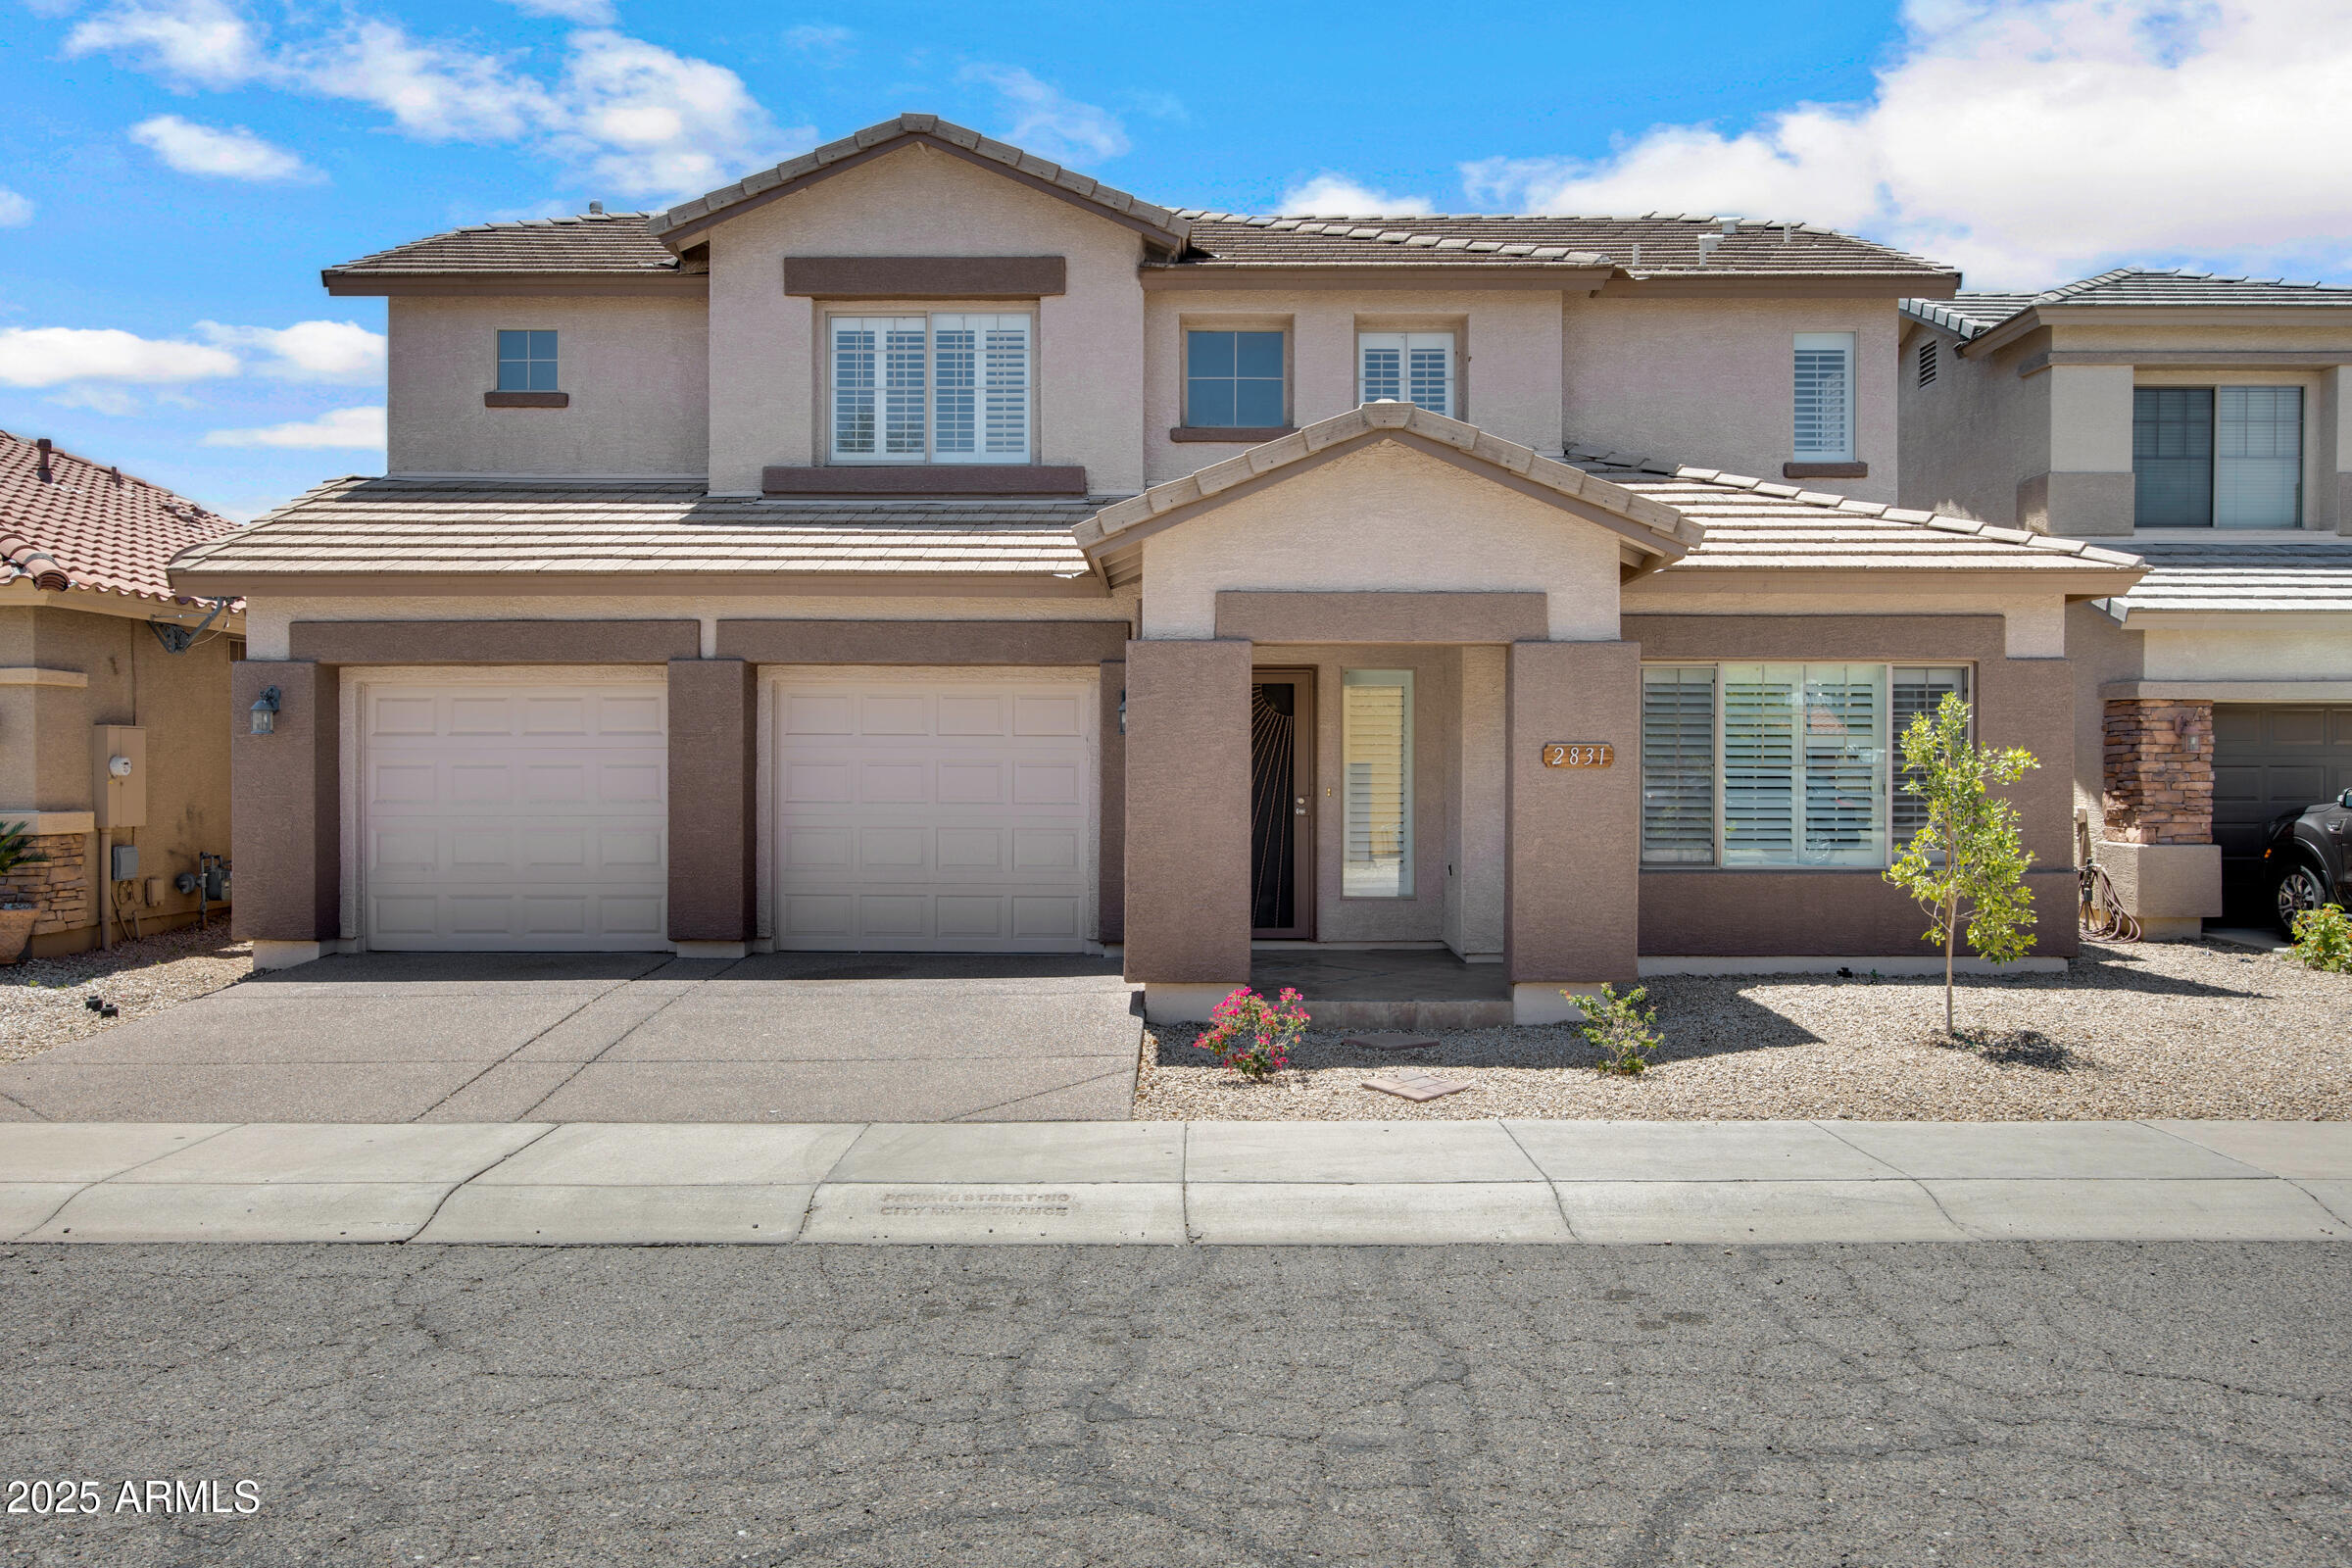
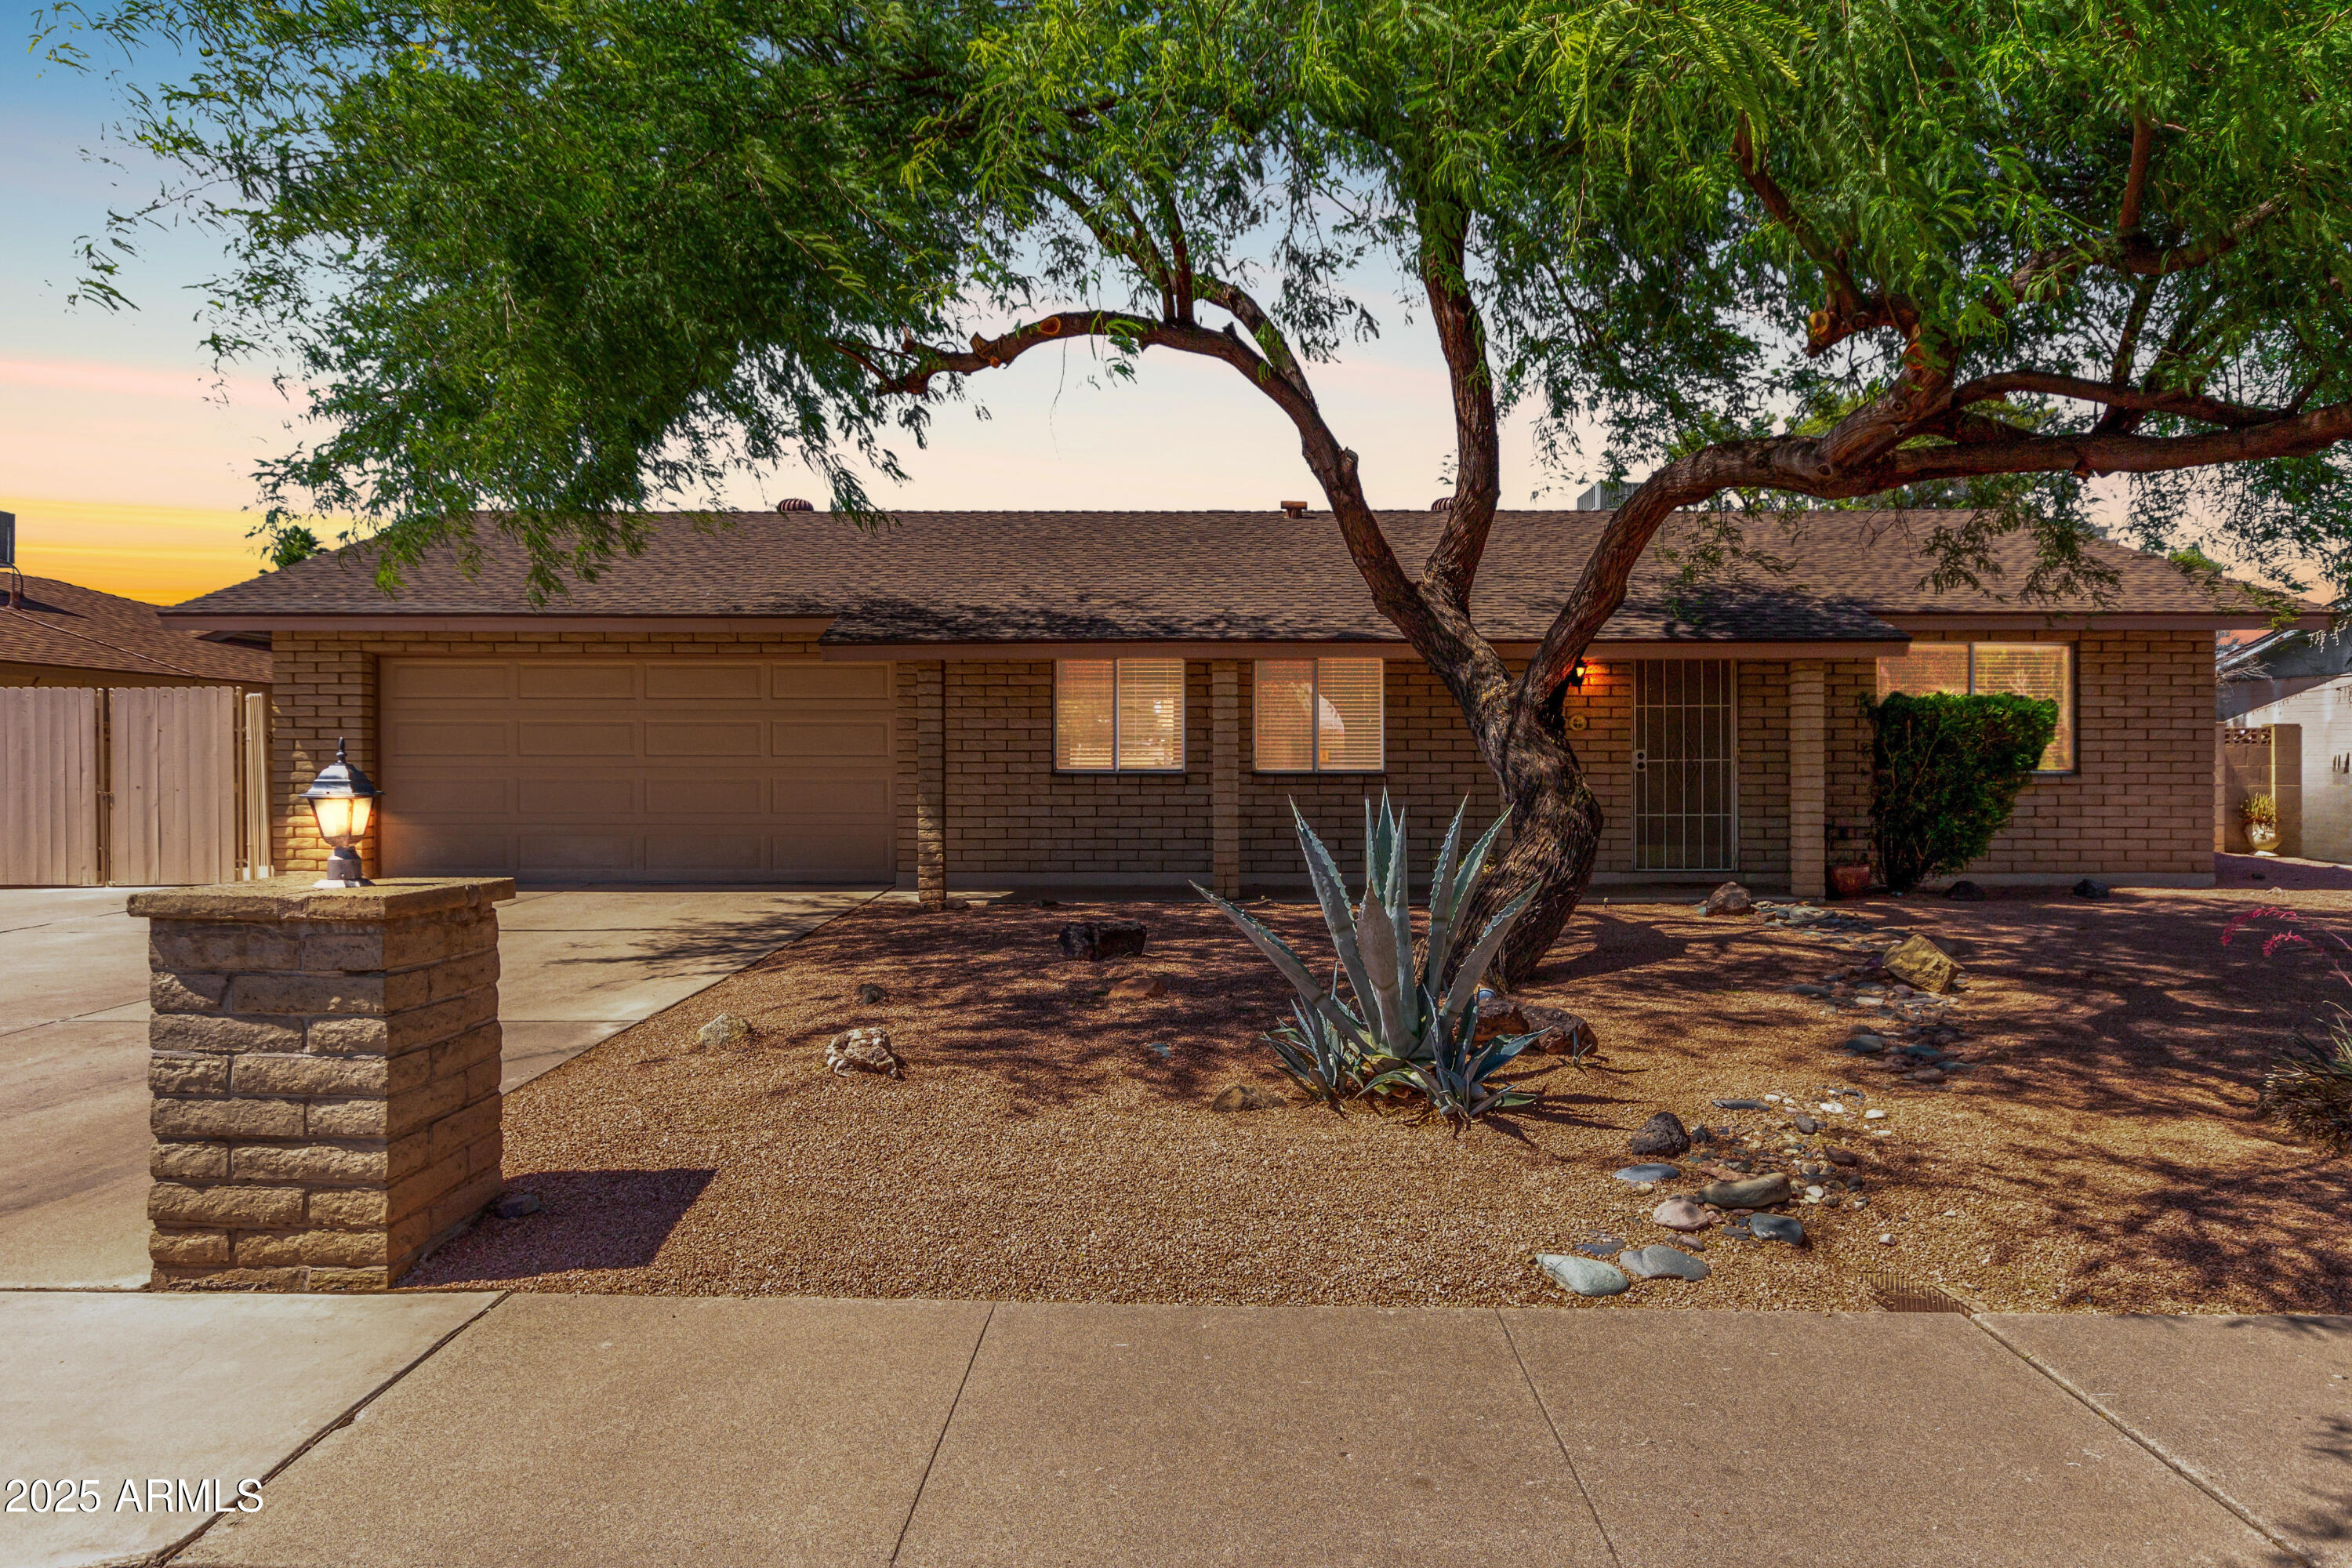
$285,000
3
bds
|
3
ba
|
2,139
sqft
|
built
2003
2831 W Margy Ct, Phoenix, AZ 85017
$-199
Cash flow
-3.6%
Cash-on-Cash Return
4.8%
Cap rate
0.7%
Rent to Value Ratio
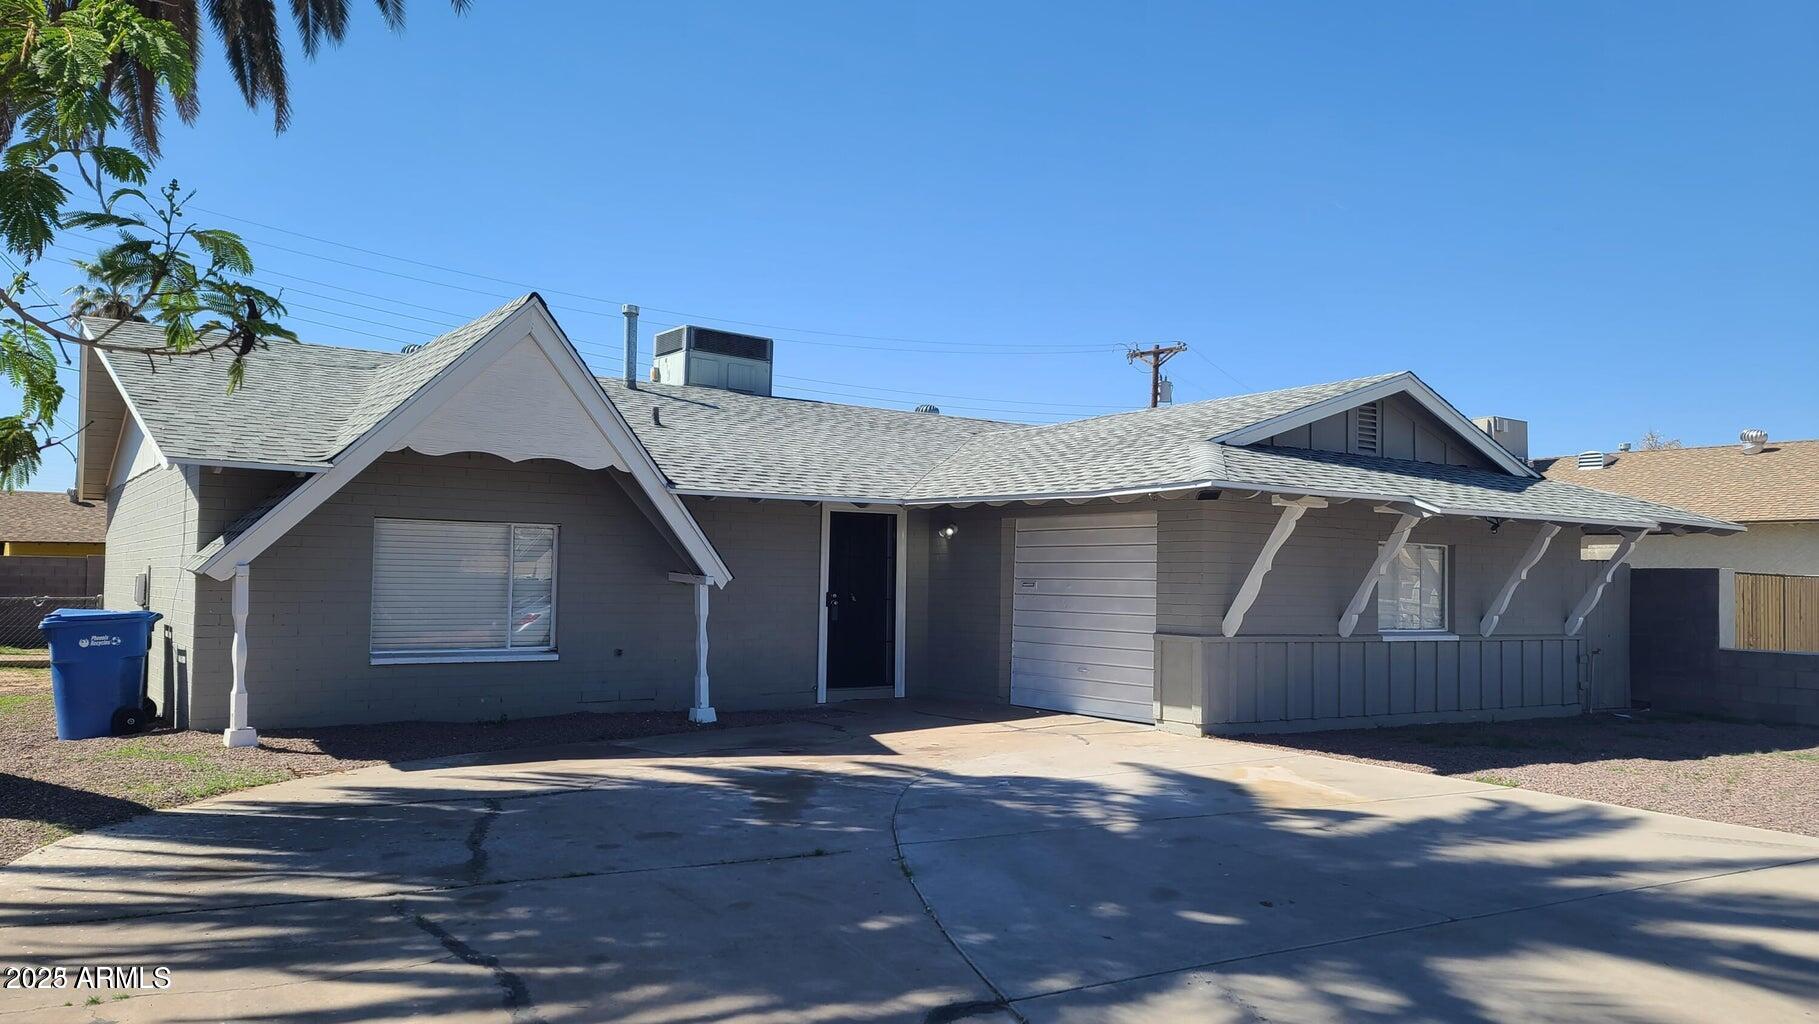
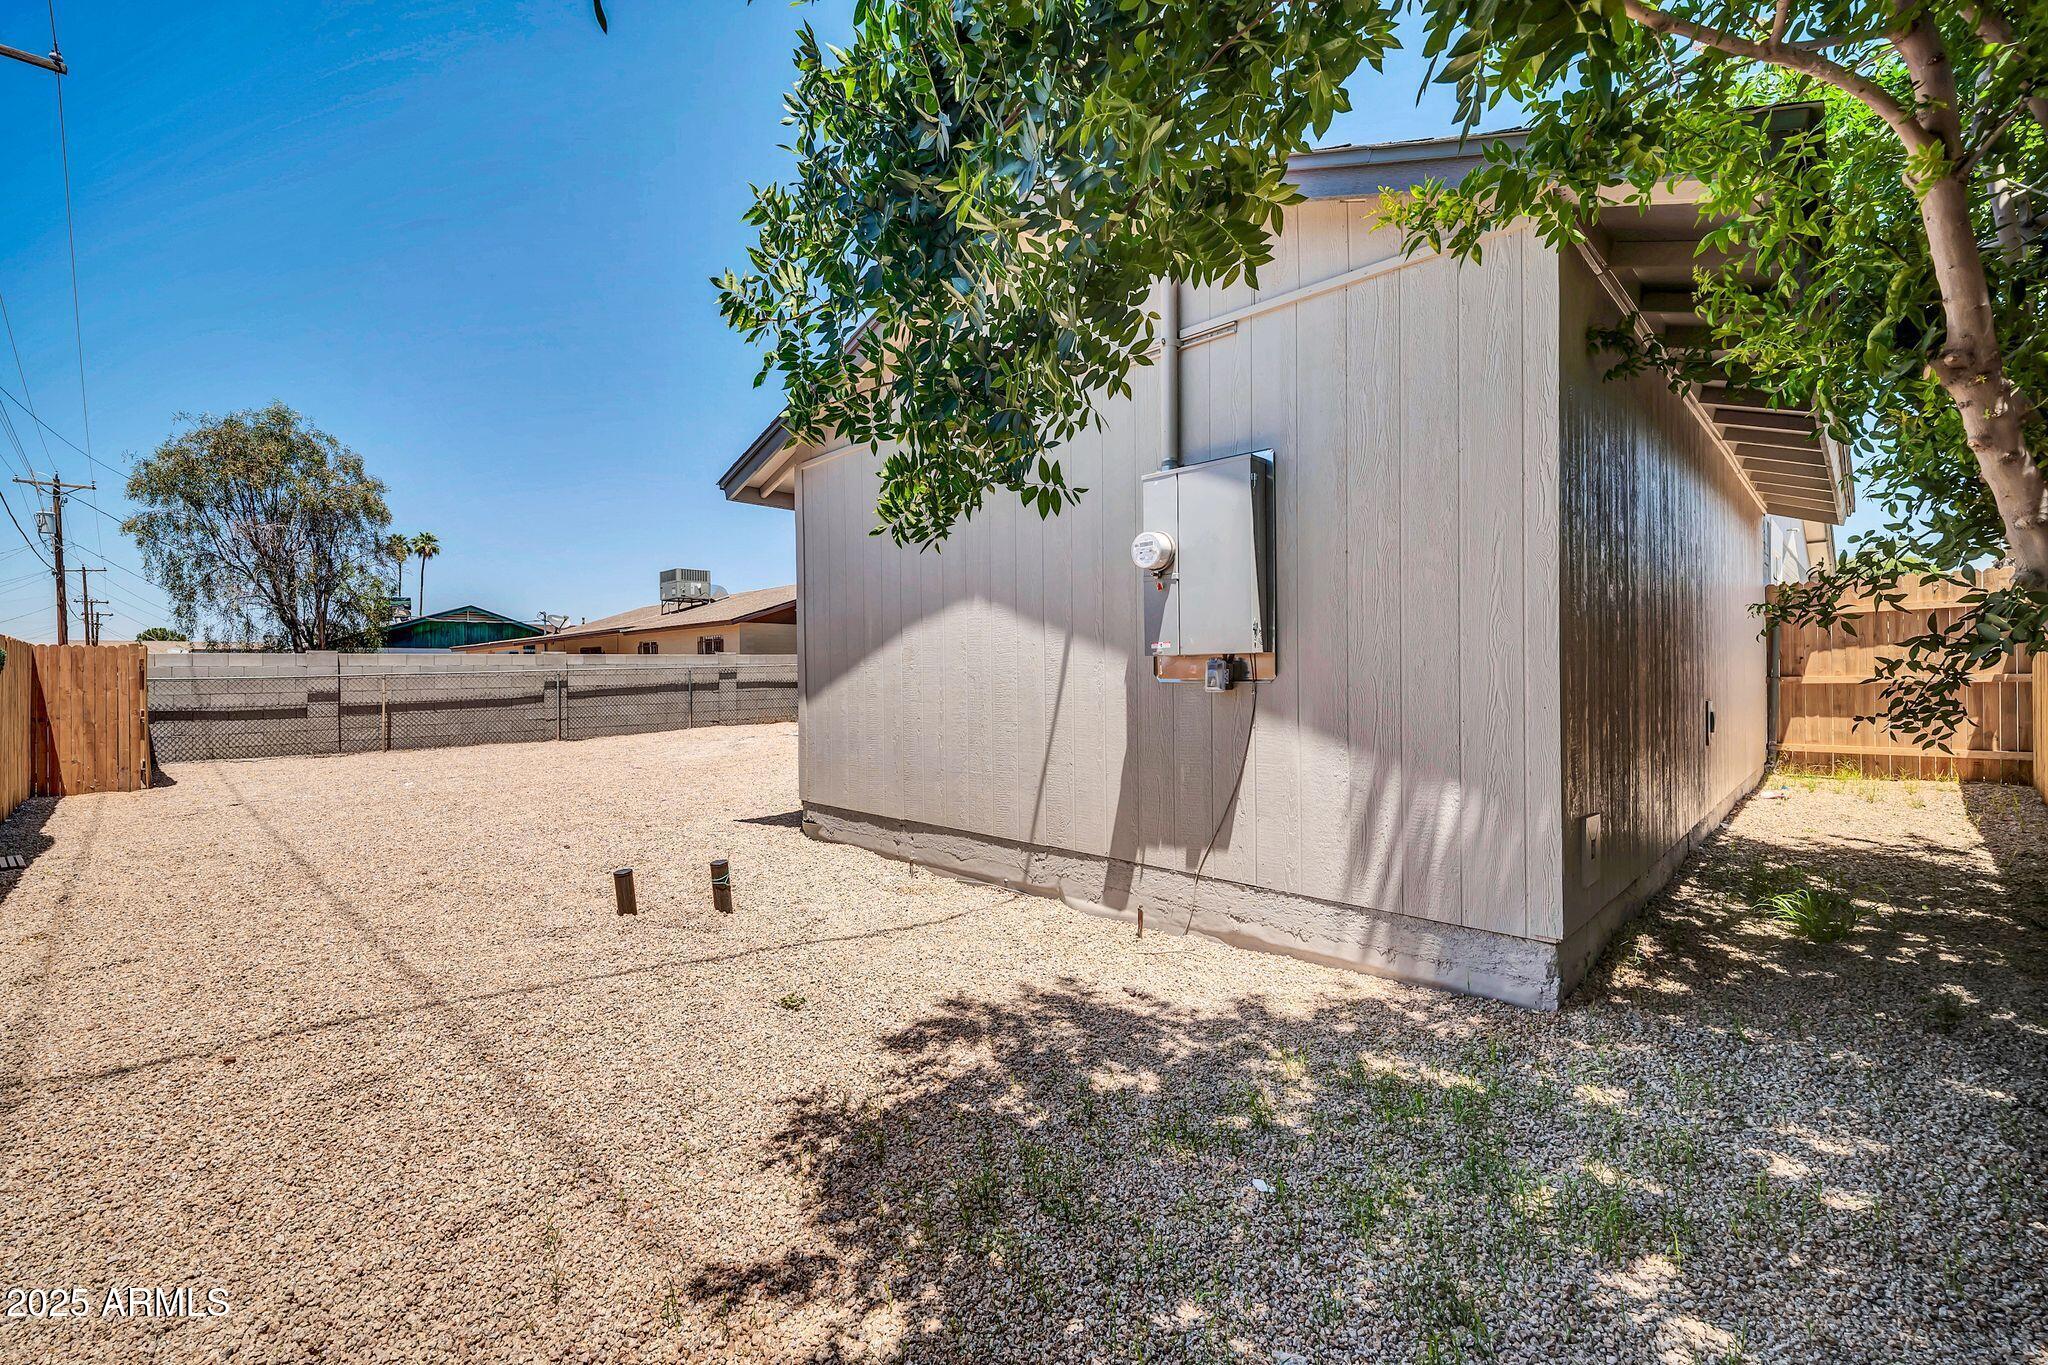
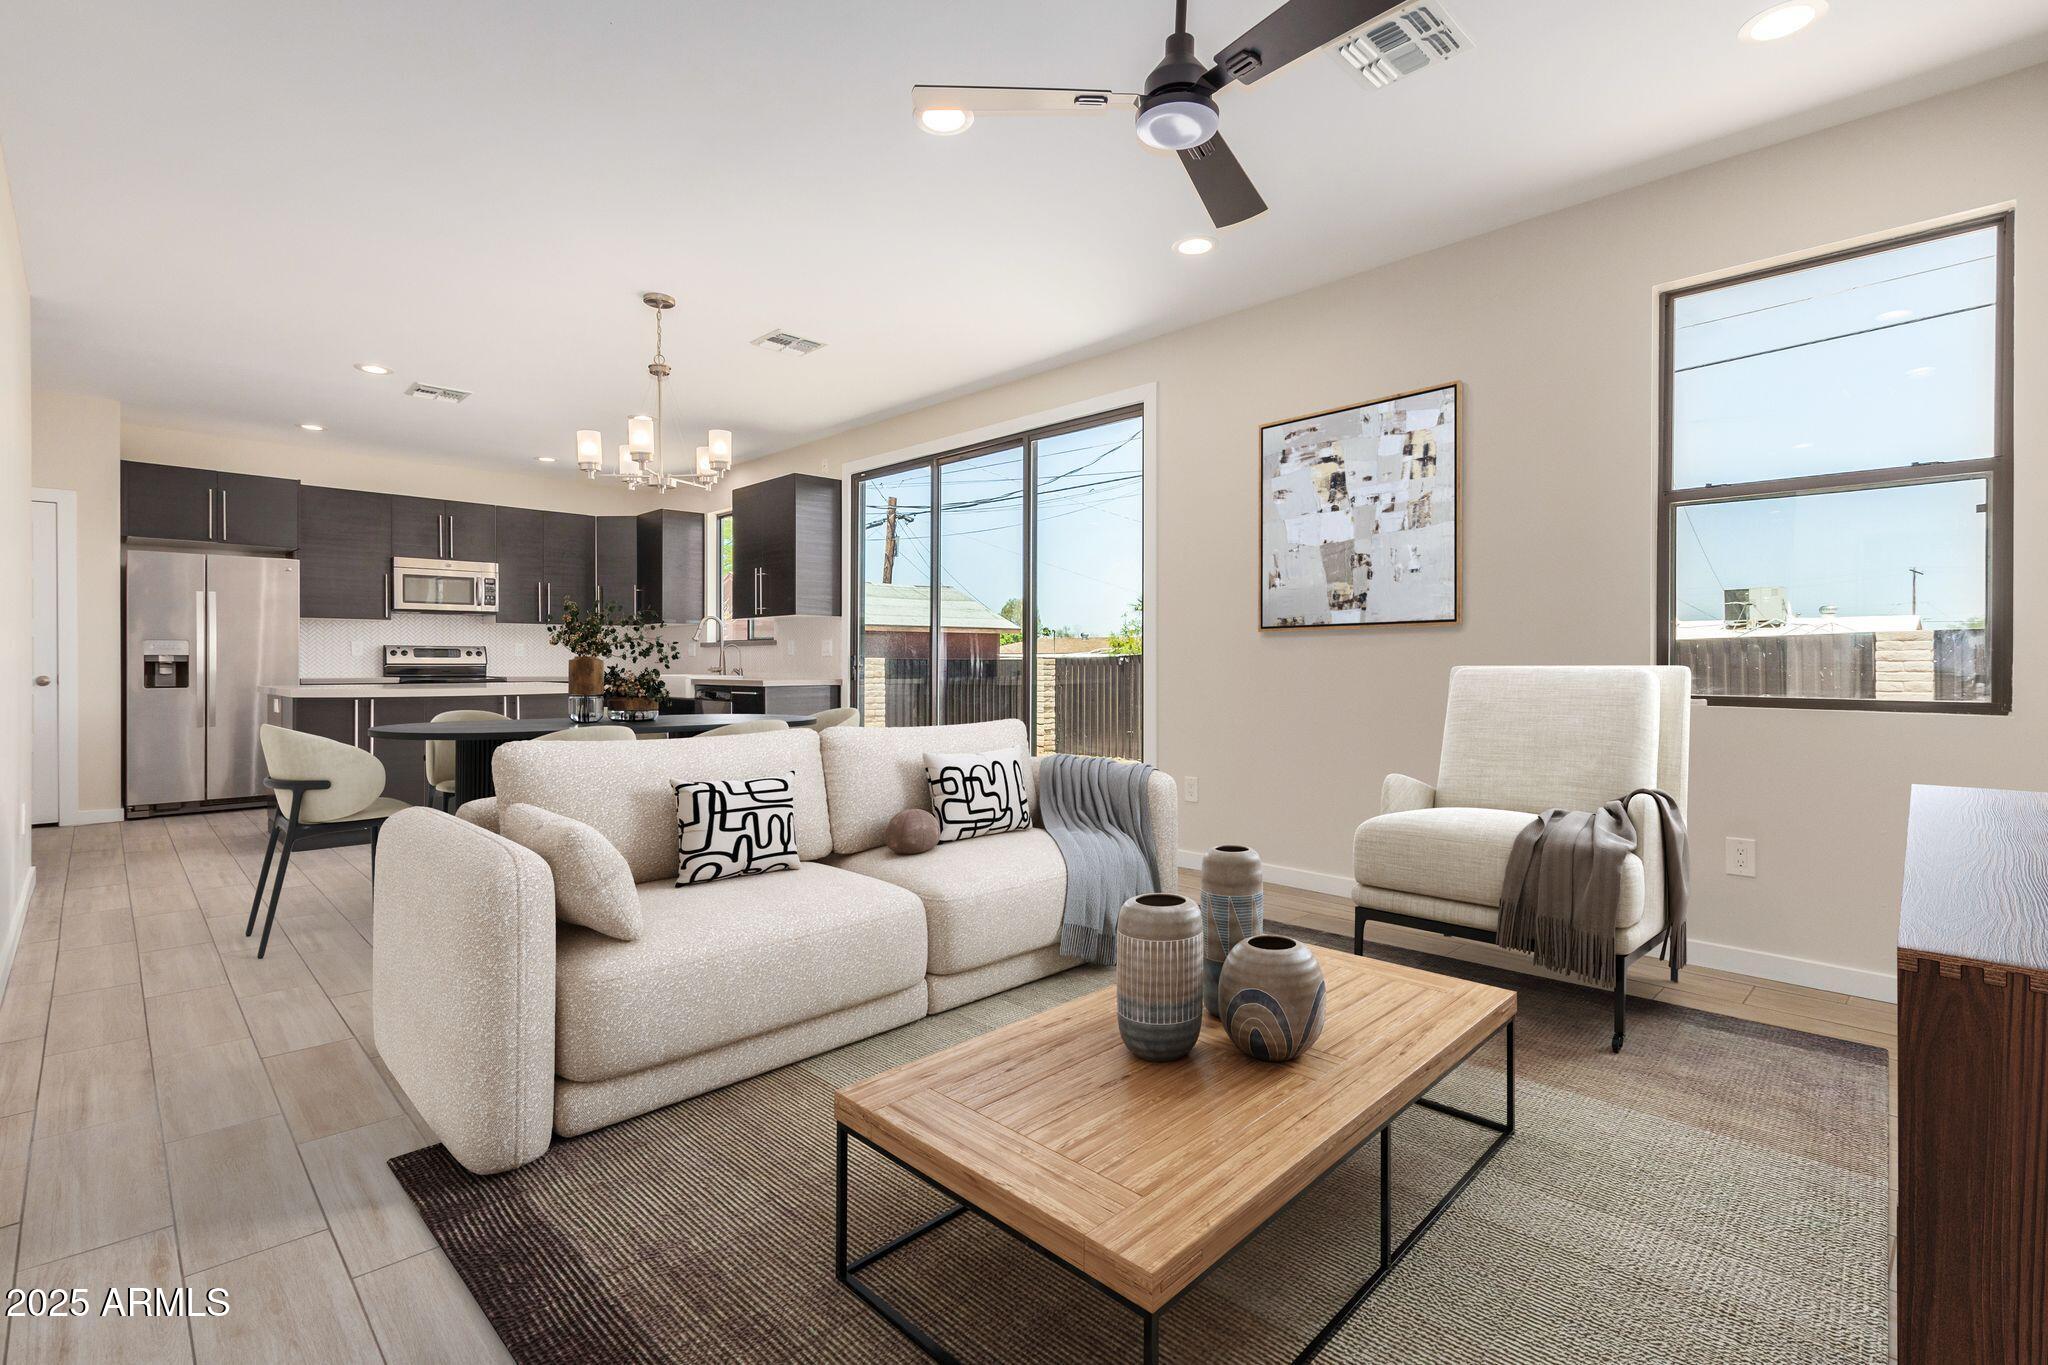
$340,000
3
bds
|
2
ba
|
1,395
sqft
|
built
1959
2908 N 53rd Ln, Phoenix, AZ 85031
$-299
Cash flow
-4.6%
Cash-on-Cash Return
4.6%
Cap rate
0.6%
Rent to Value Ratio
3,574 out of 4,109 properties for sale in Phoenix, AZ
Limited Results Shown
Create a free account, or log in to reveal all property listings and enjoy the complete experience.

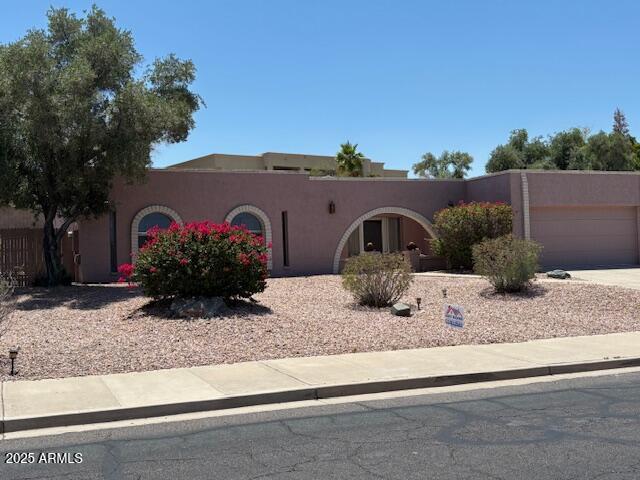
$269,995
3
bds
|
2
ba
|
1,298
sqft
|
built
1972
2645 W Elm St, Phoenix, AZ 85017
$-385
Cash flow
-7.4%
Cash-on-Cash Return
4.0%
Cap rate
0.7%
Rent to Value Ratio
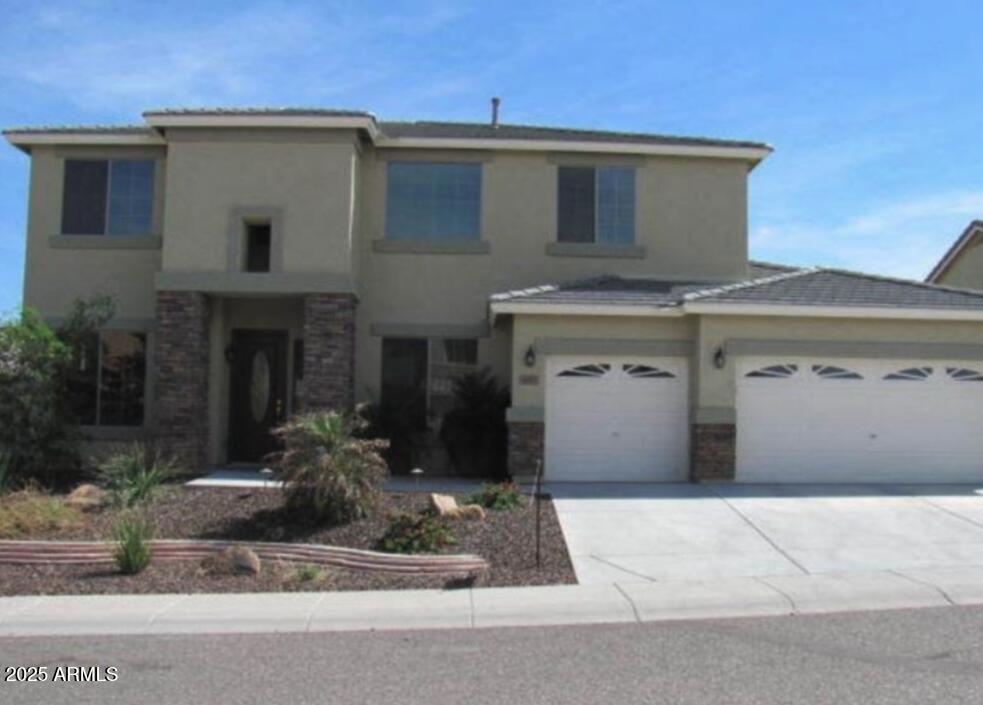
$464,900
4
bds
|
3
ba
|
1,866
sqft
|
built
1970
5236 S 19th Ave, Phoenix, AZ 85041
$-1,144
Cash flow
-12.8%
Cash-on-Cash Return
2.7%
Cap rate
0.3%
Rent to Value Ratio
$359,000
1
bds
|
2
ba
|
856
sqft
|
built
1979
5203 N 24th St, Phoenix, AZ 85016
$-1,153
Cash flow
-16.8%
Cash-on-Cash Return
1.8%
Cap rate
0.4%
Rent to Value Ratio

$469,800
2
bds
|
1
ba
|
1,090
sqft
|
built
1930
1134 W Portland St, Phoenix, AZ 85007
$-816
Cash flow
-9.1%
Cash-on-Cash Return
3.6%
Cap rate
0.5%
Rent to Value Ratio
$839,000
3
bds
|
2
ba
|
2,014
sqft
|
built
2019
549 E Balao Dr, Phoenix, AZ 85085
$-1,689
Cash flow
-10.5%
Cash-on-Cash Return
3.3%
Cap rate
0.5%
Rent to Value Ratio
$400,000
3
bds
|
2
ba
|
1,936
sqft
|
built
1971
3636 W Crocus Dr, Phoenix, AZ 85053
$-624
Cash flow
-8.1%
Cash-on-Cash Return
3.8%
Cap rate
0.5%
Rent to Value Ratio
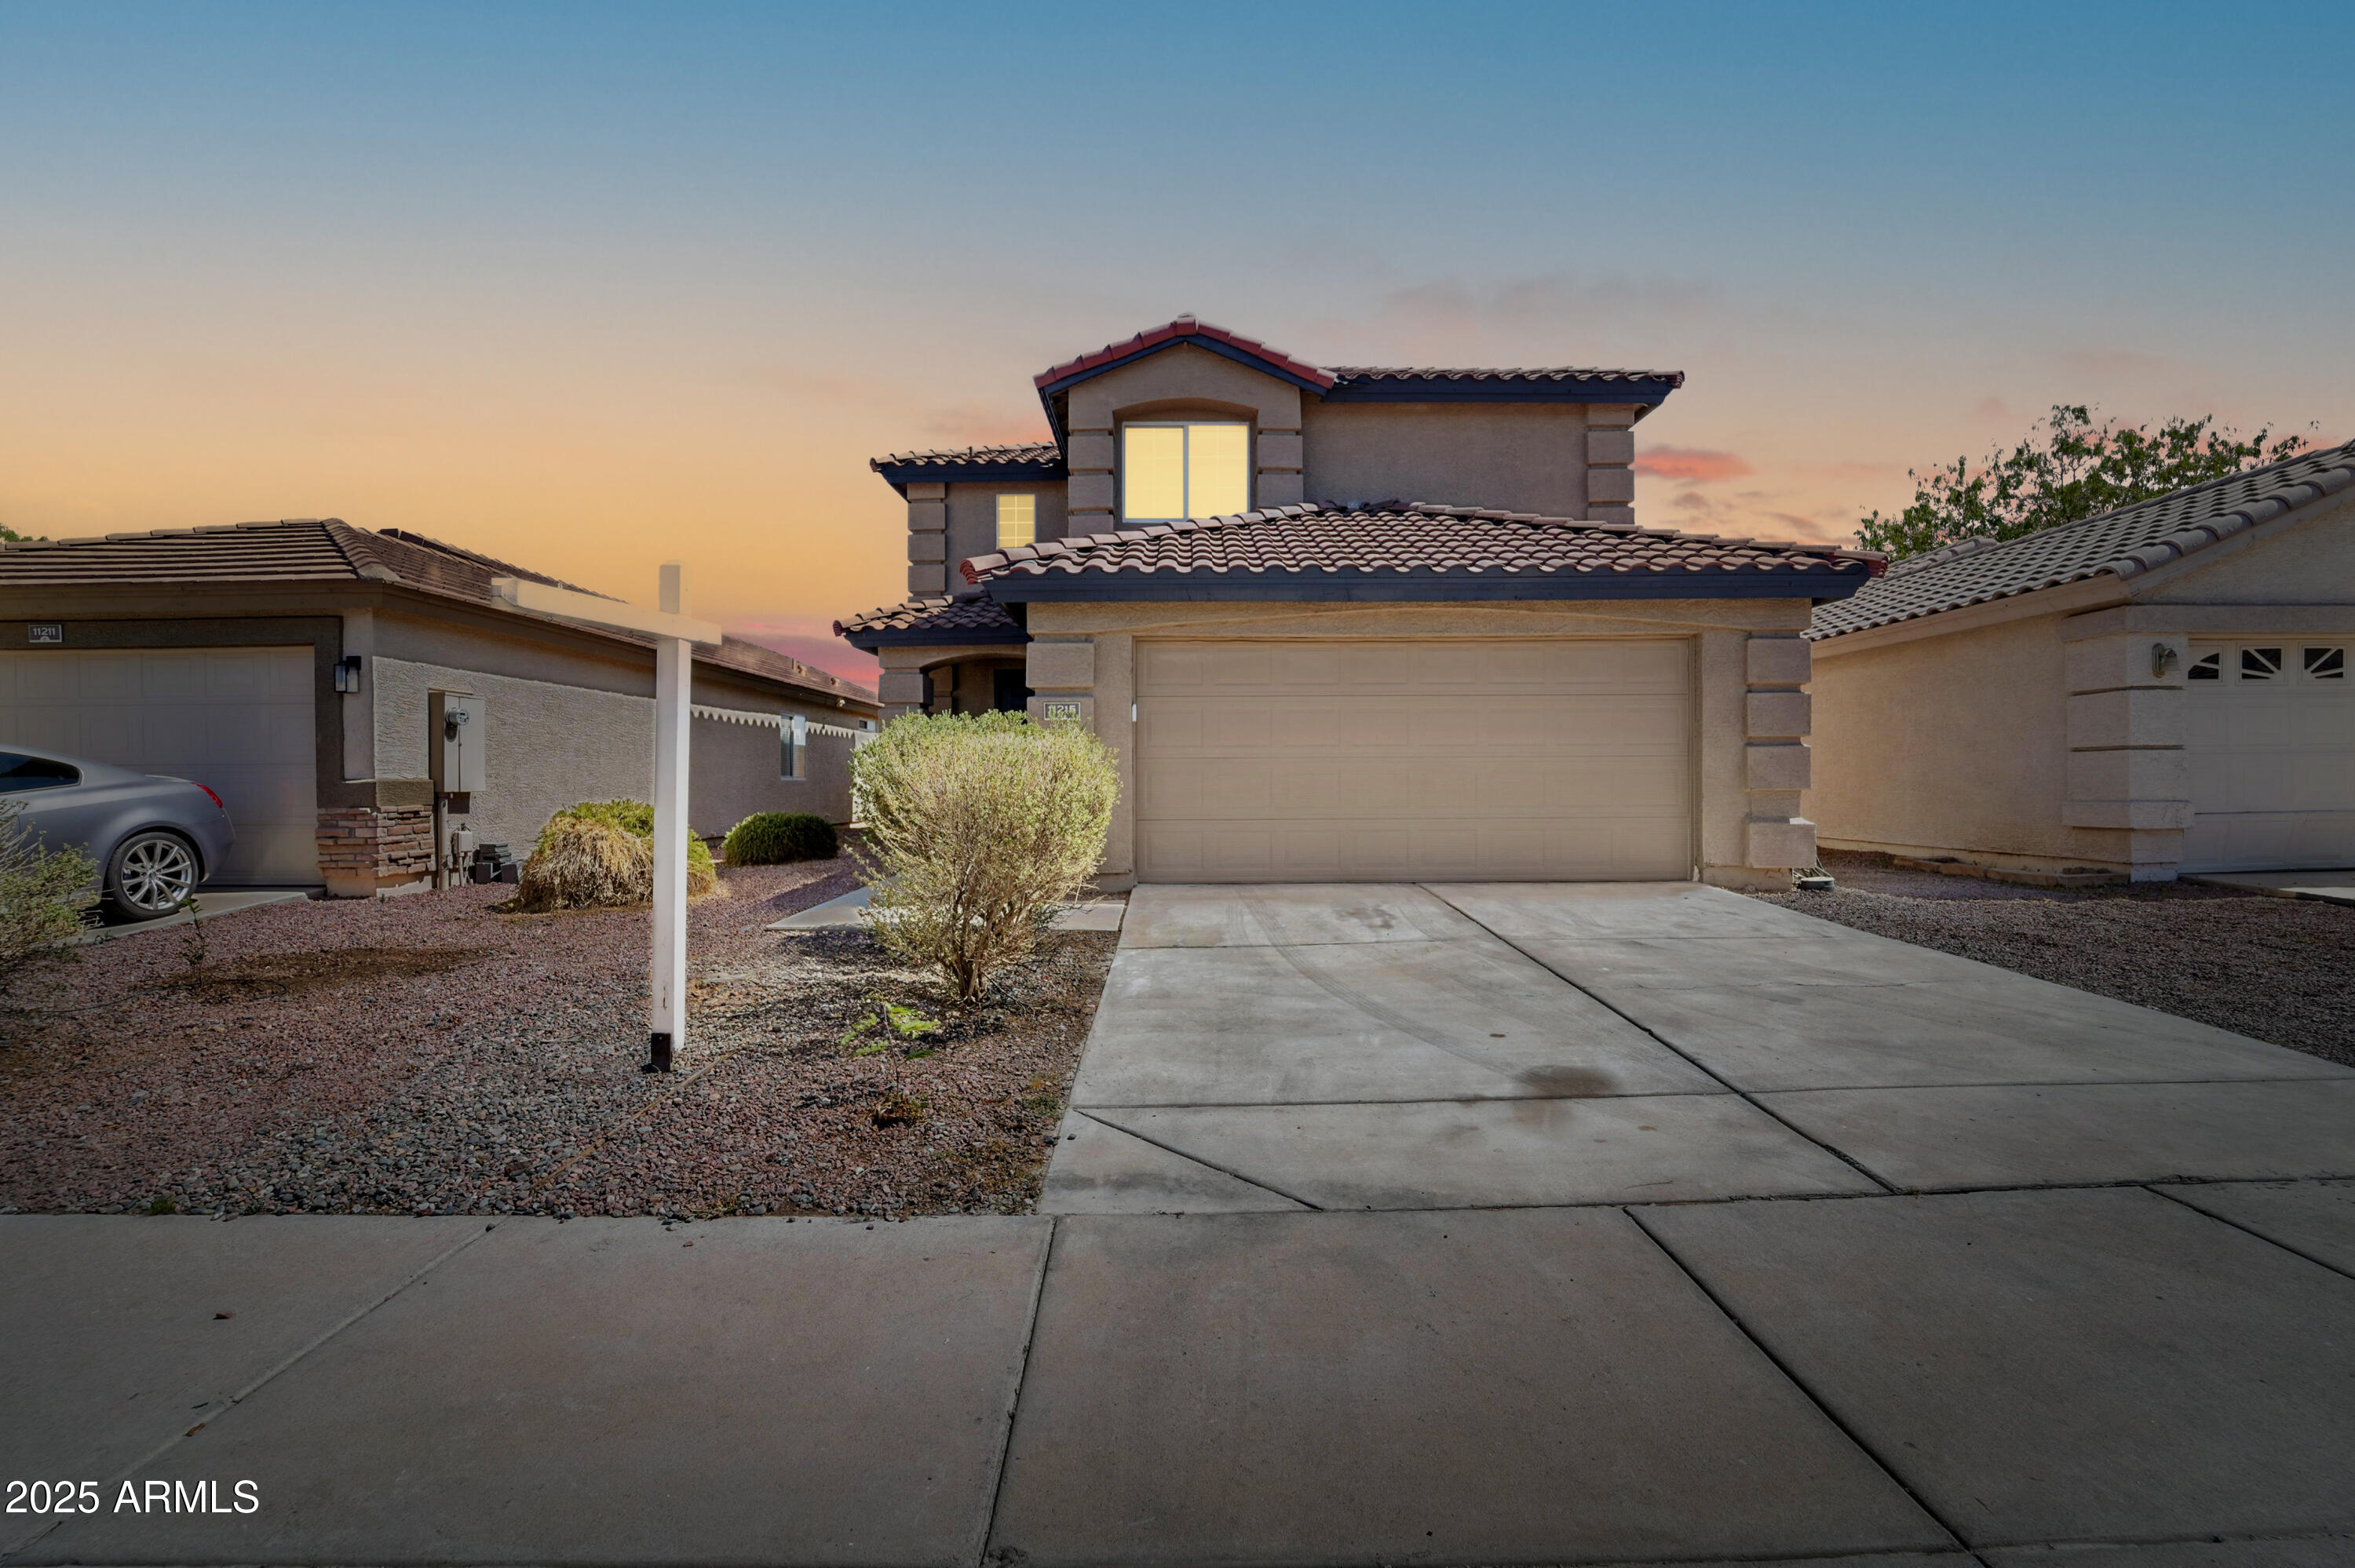
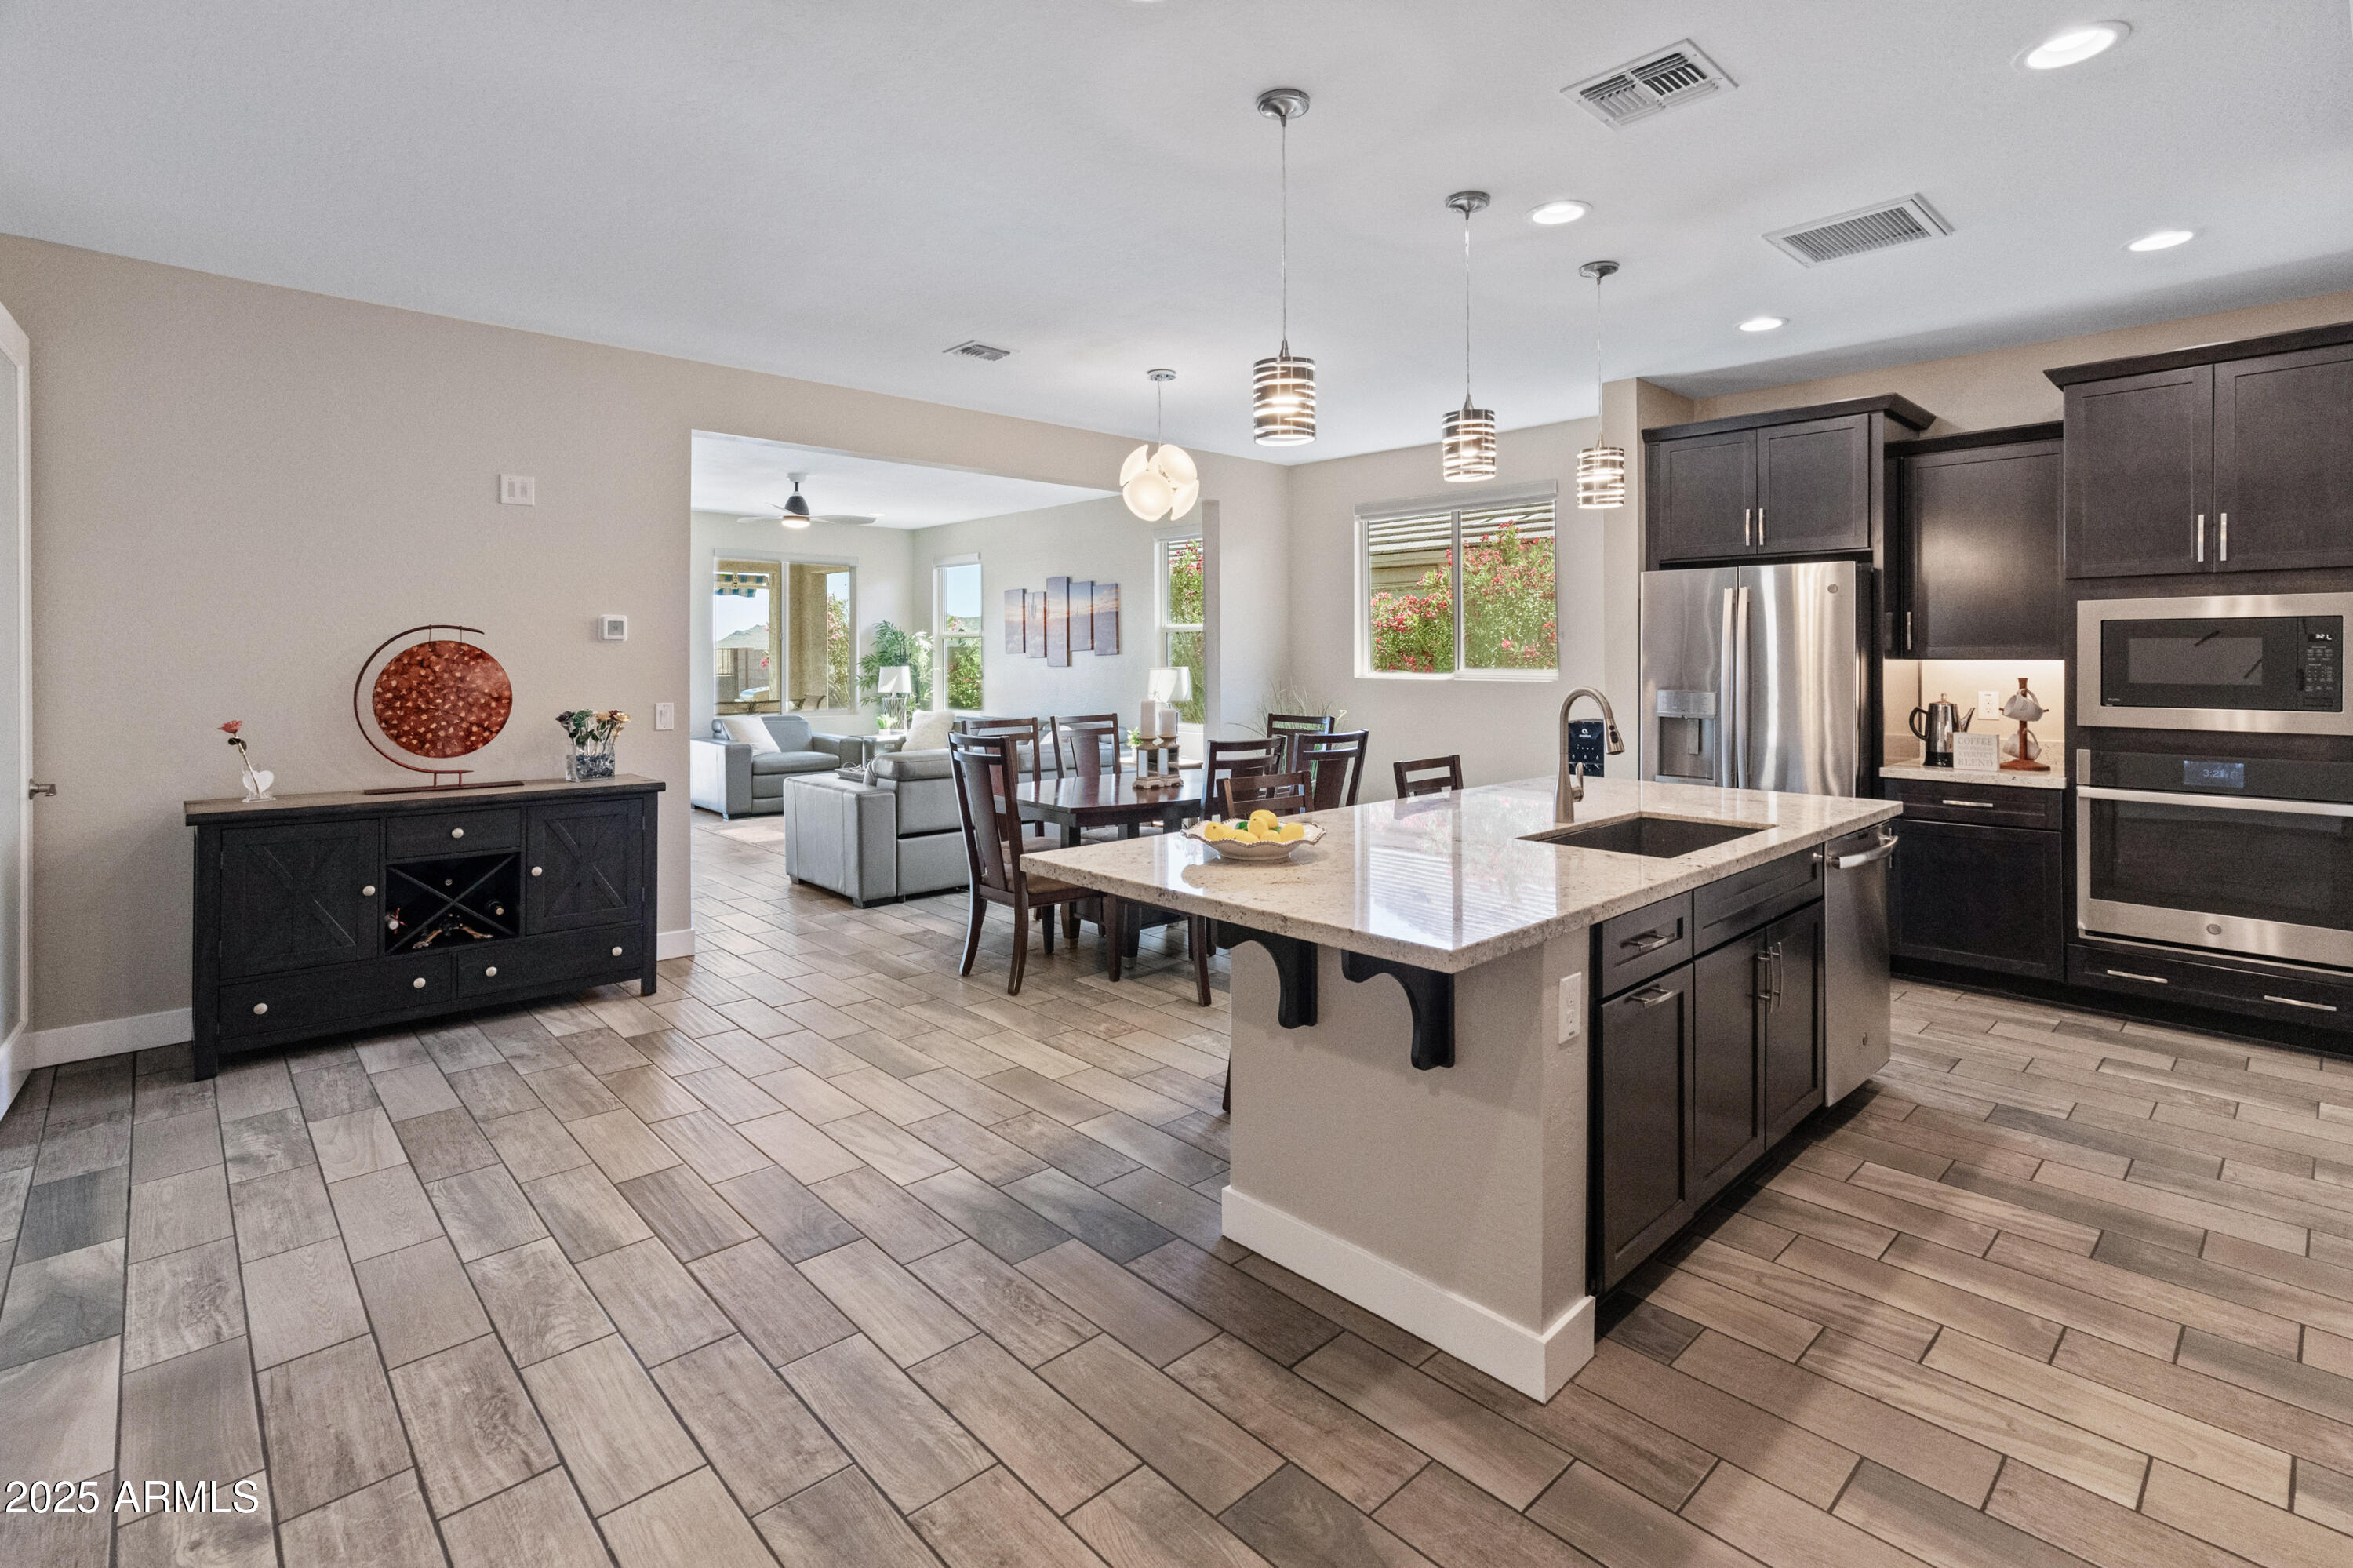
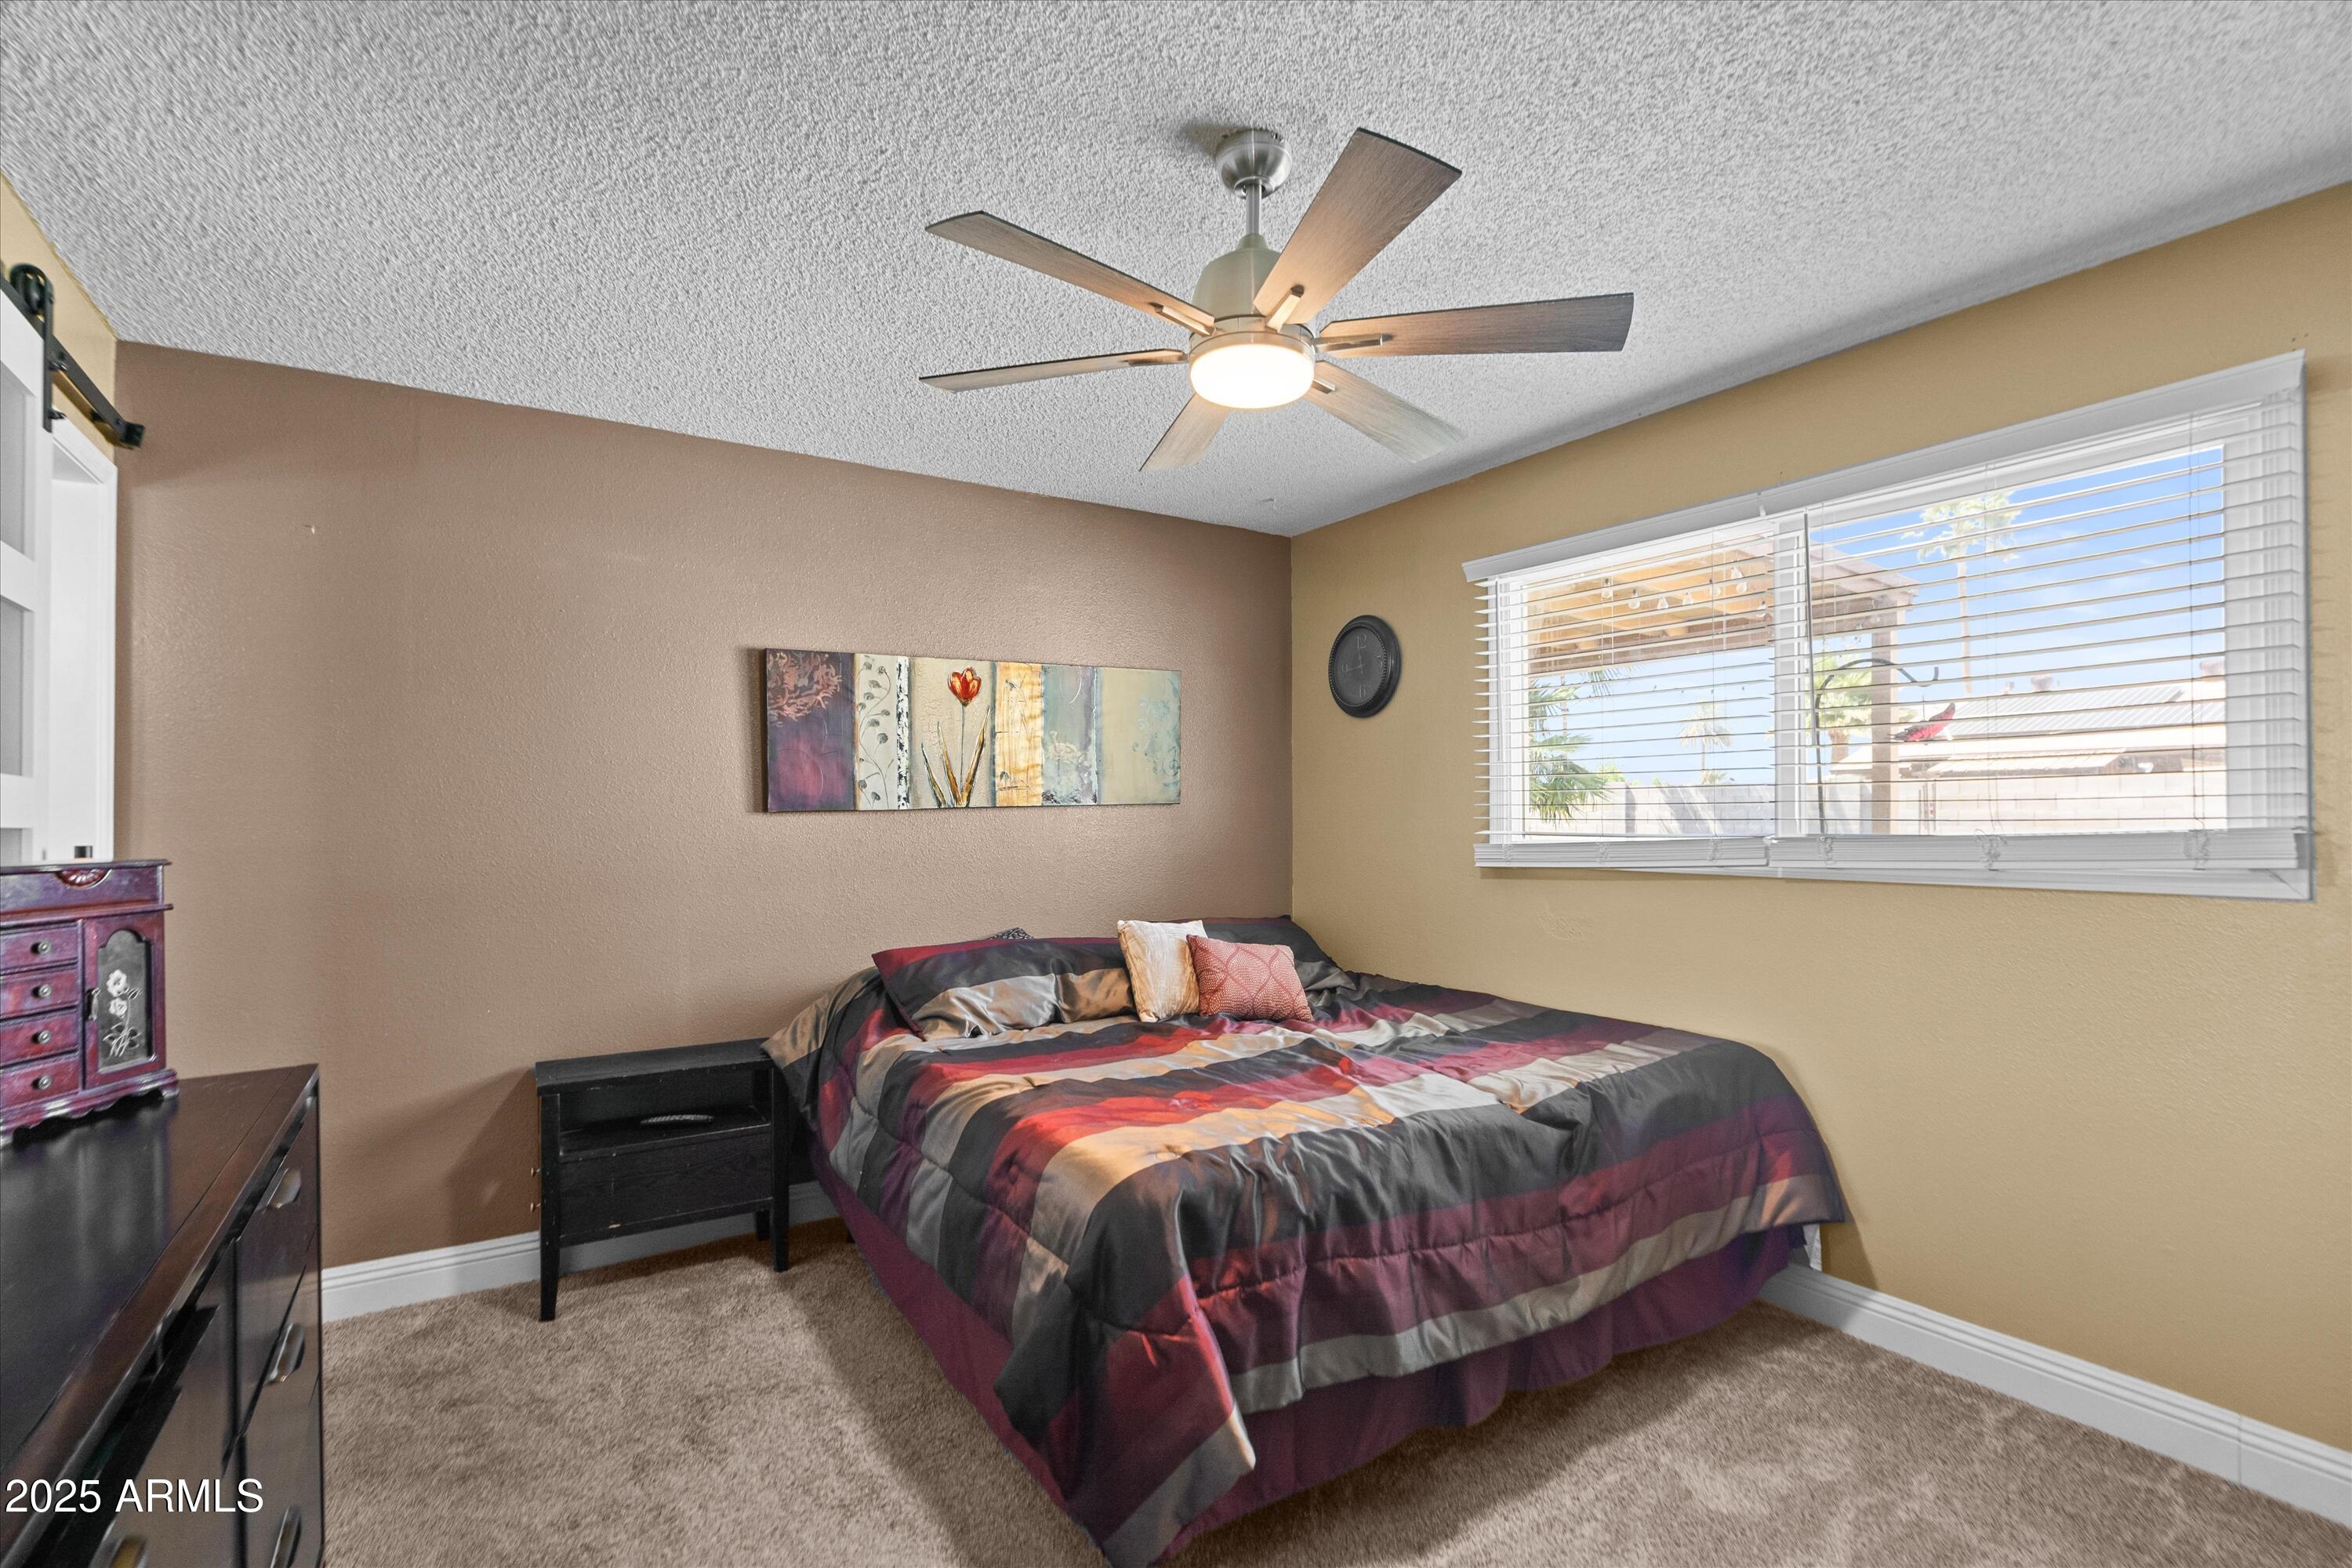
$395,000
4
bds
|
3
ba
|
1,384
sqft
|
built
1998
11215 W Heatherbrae Dr, Phoenix, AZ 85037
$-786
Cash flow
-10.4%
Cash-on-Cash Return
3.3%
Cap rate
0.5%
Rent to Value Ratio

$569,000
3
bds
|
2
ba
|
1,575
sqft
|
built
2015
19365 N 28th St, Phoenix, AZ 85050
$-934
Cash flow
-8.6%
Cash-on-Cash Return
3.7%
Cap rate
0.5%
Rent to Value Ratio
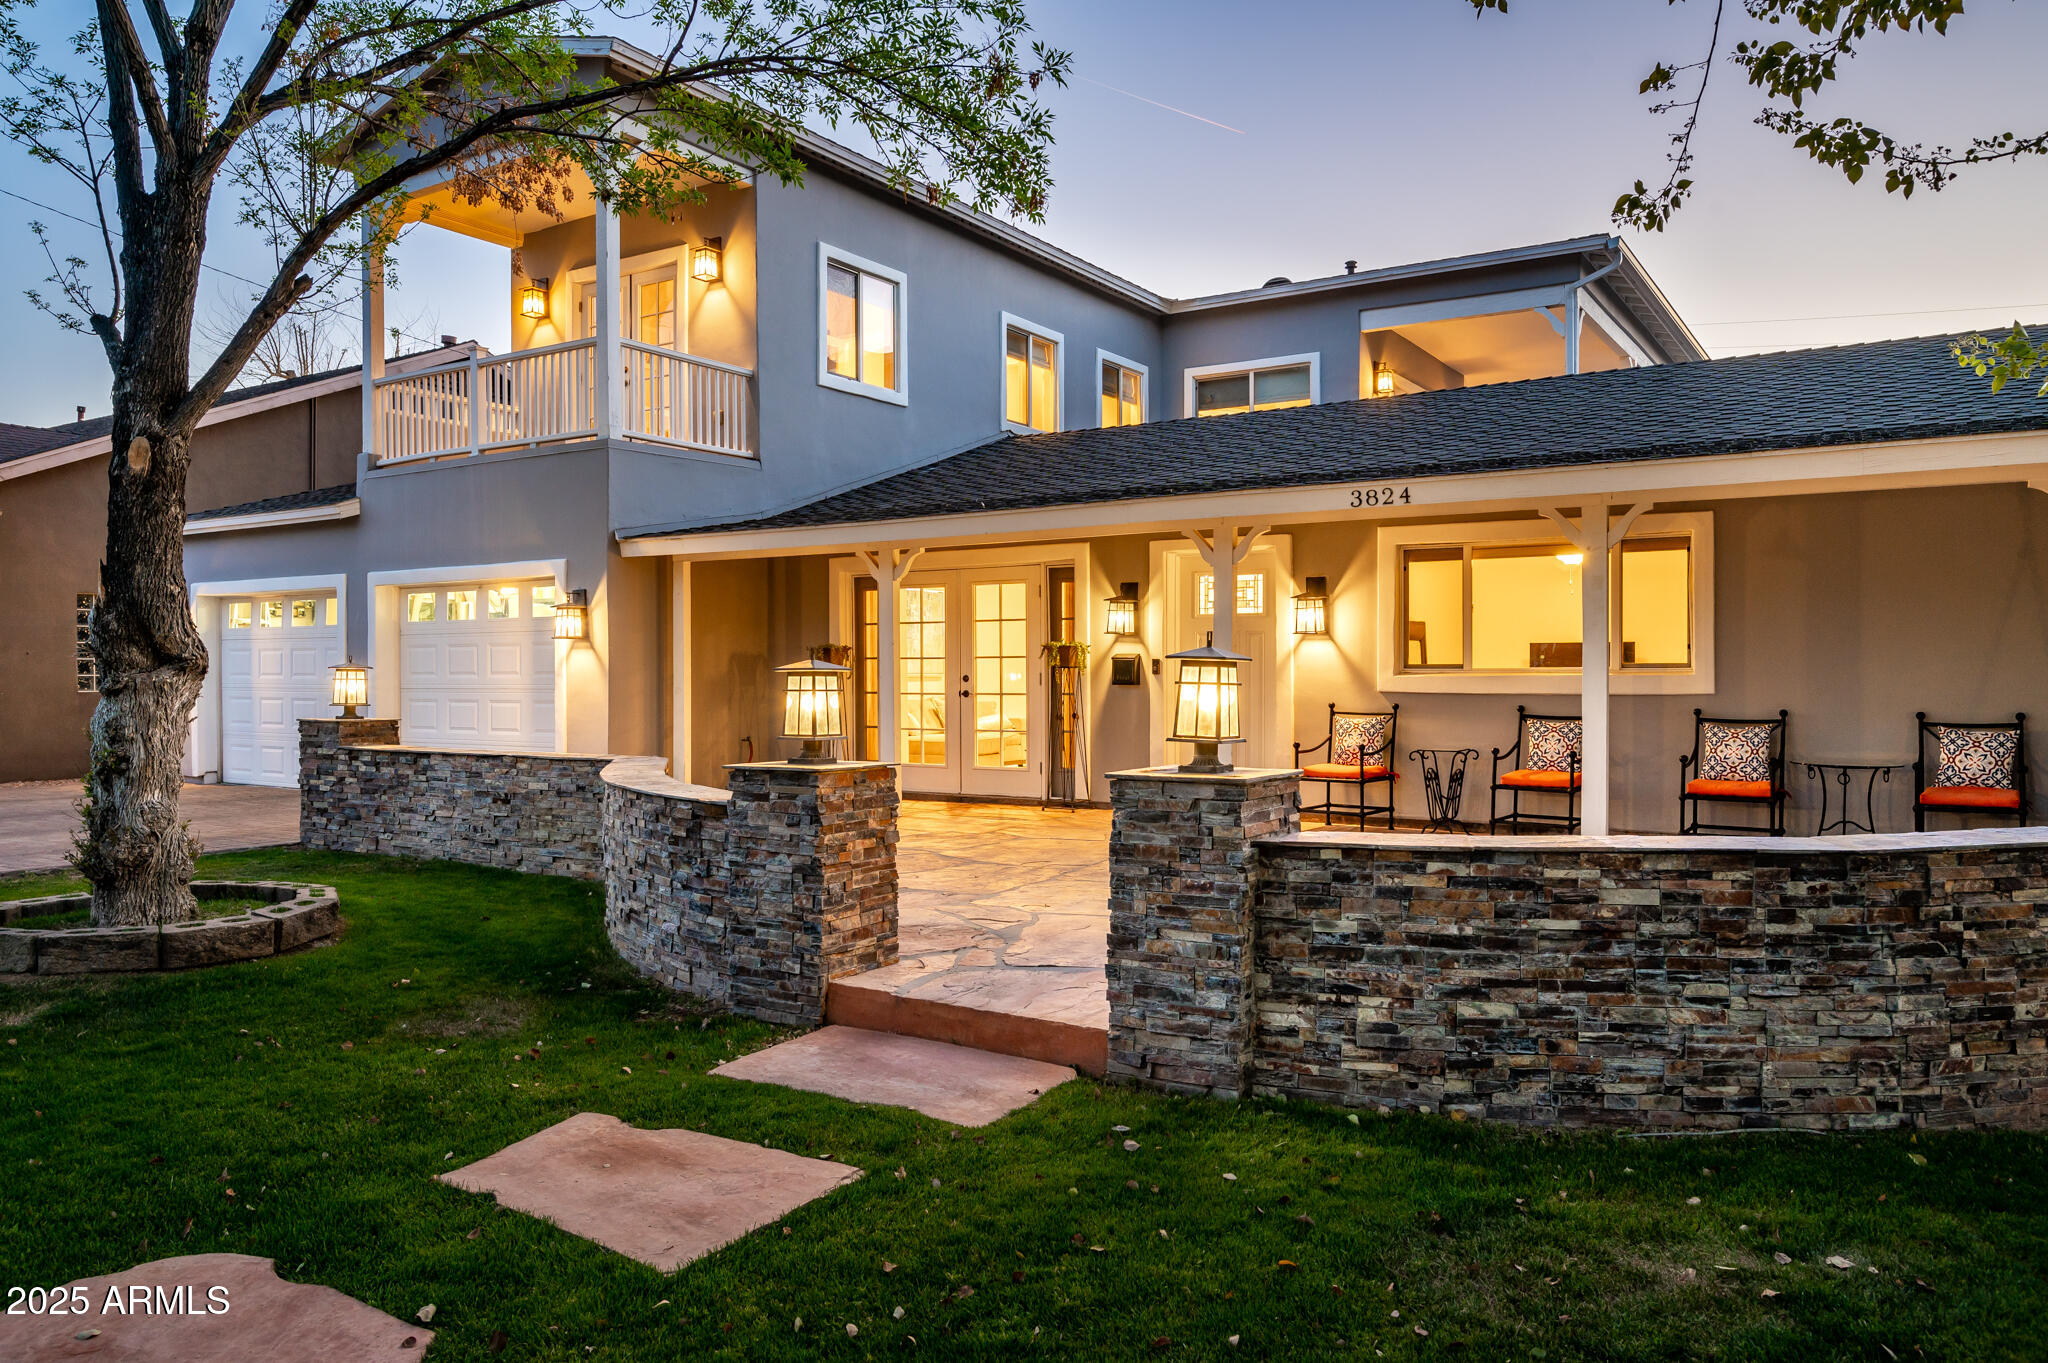
$1,325,000
5
bds
|
3
ba
|
2,778
sqft
|
built
1956
3824 N 50th Pl, Phoenix, AZ 85018
$-2,070
Cash flow
-8.2%
Cash-on-Cash Return
3.8%
Cap rate
0.5%
Rent to Value Ratio
$435,000
3
bds
|
2
ba
|
1,434
sqft
|
built
2001
7924 W Hammond Ln, Phoenix, AZ 85043
$-925
Cash flow
-11.1%
Cash-on-Cash Return
3.1%
Cap rate
0.4%
Rent to Value Ratio

$340,000
2
bds
|
1
ba
|
936
sqft
|
built
1979
18427 N 32nd Ln, Phoenix, AZ 85053
$-560
Cash flow
-8.6%
Cash-on-Cash Return
3.7%
Cap rate
0.5%
Rent to Value Ratio
$399,900
4
bds
|
3
ba
|
1,776
sqft
|
built
2006
7227 S 13th Way, Phoenix, AZ 85042
$-628
Cash flow
-8.2%
Cash-on-Cash Return
3.8%
Cap rate
0.6%
Rent to Value Ratio
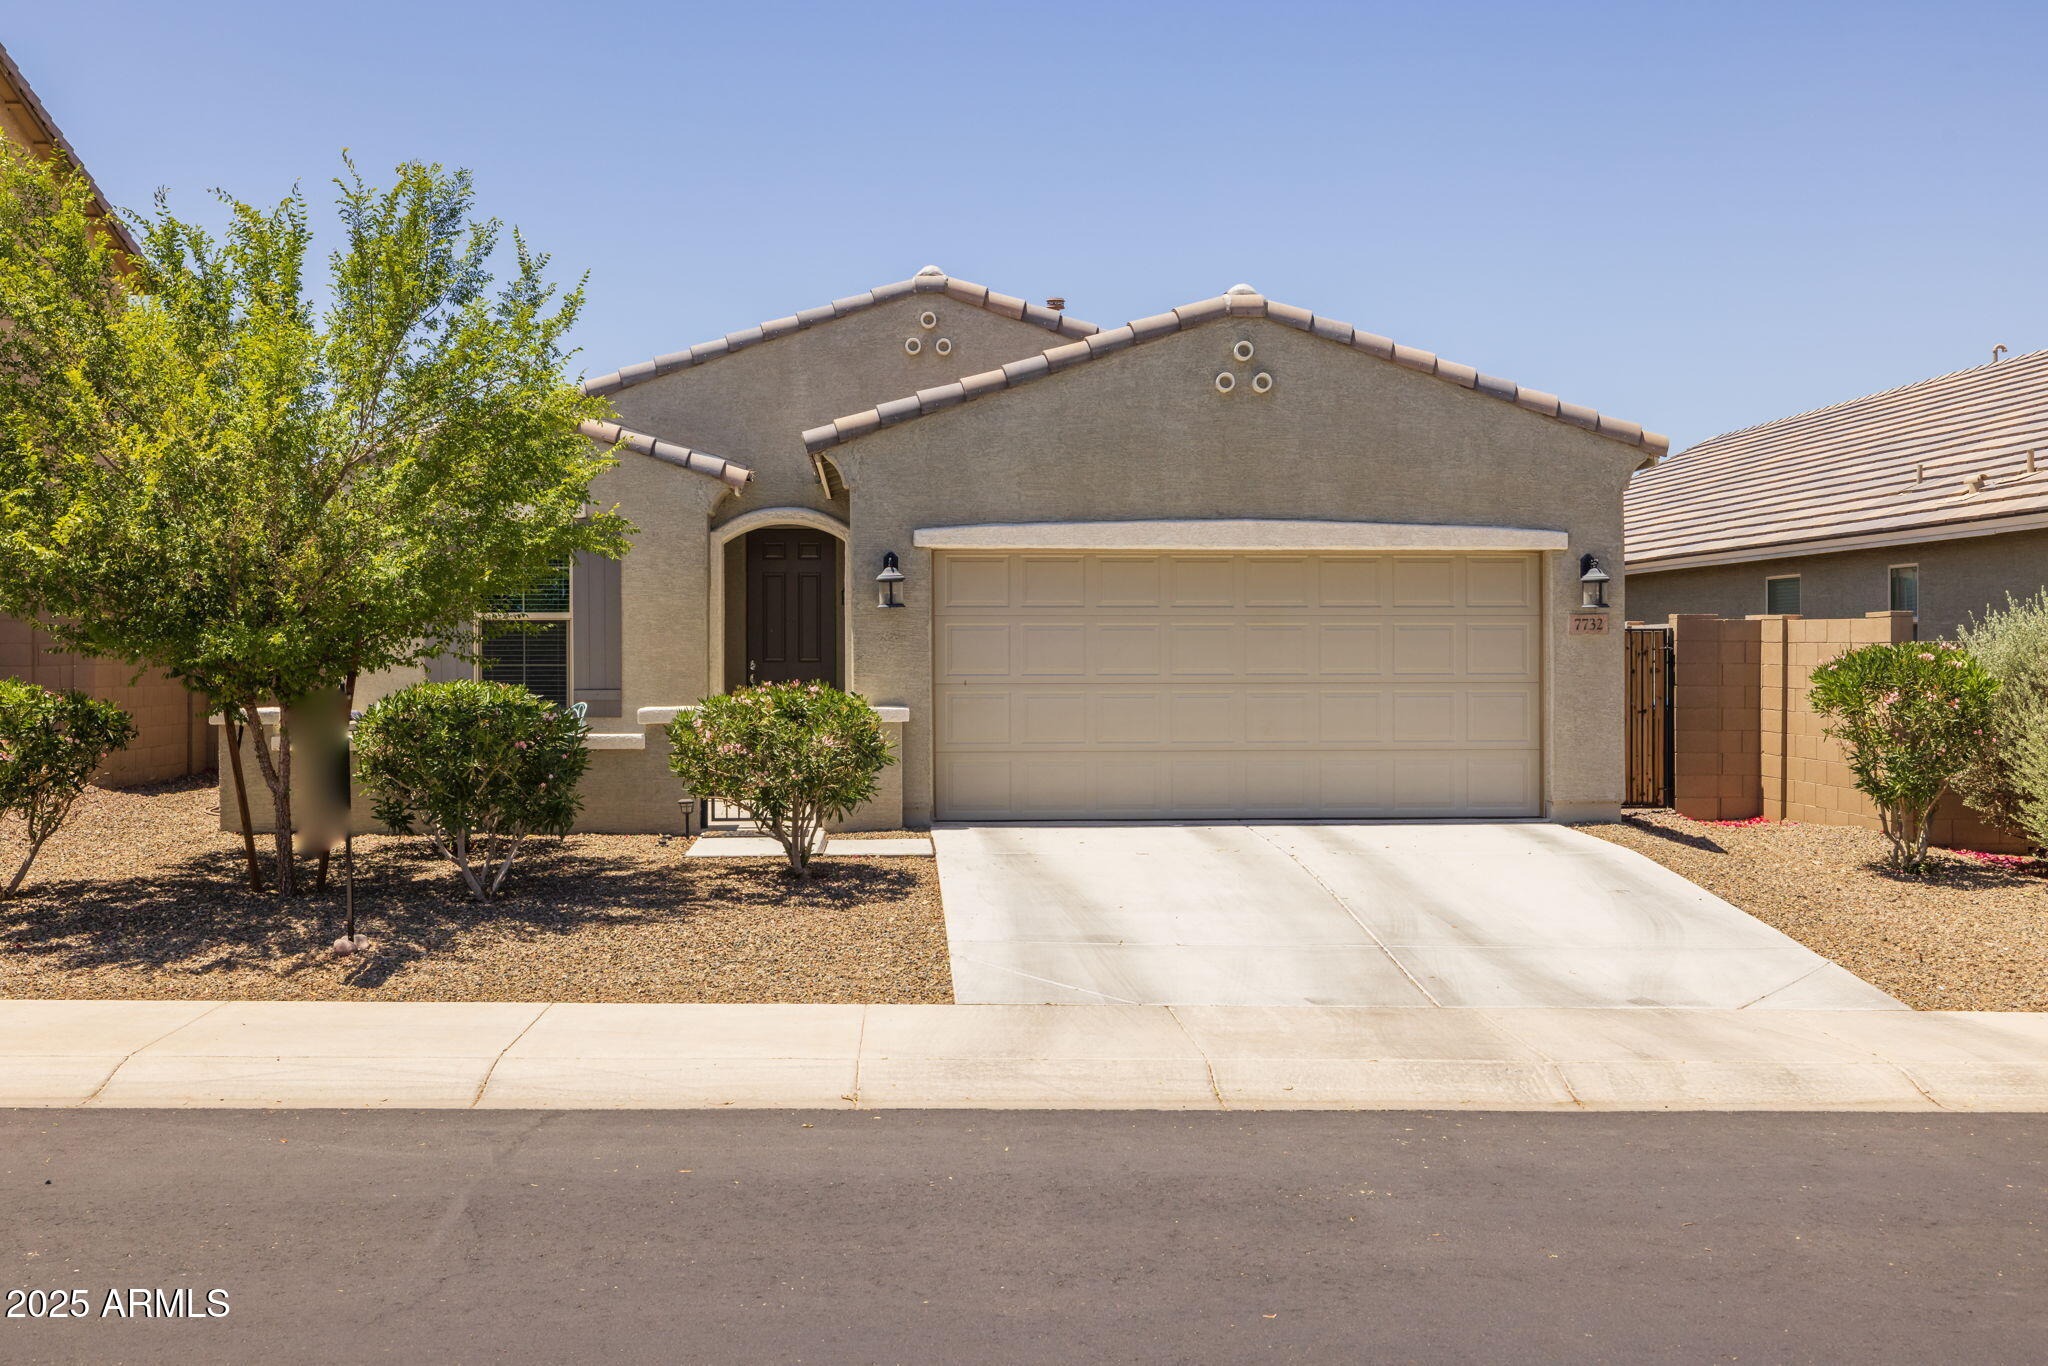
$525,000
3
bds
|
2
ba
|
1,714
sqft
|
built
2018
7732 S 23rd Ln, Phoenix, AZ 85041
$-1,192
Cash flow
-11.8%
Cash-on-Cash Return
3.0%
Cap rate
0.5%
Rent to Value Ratio
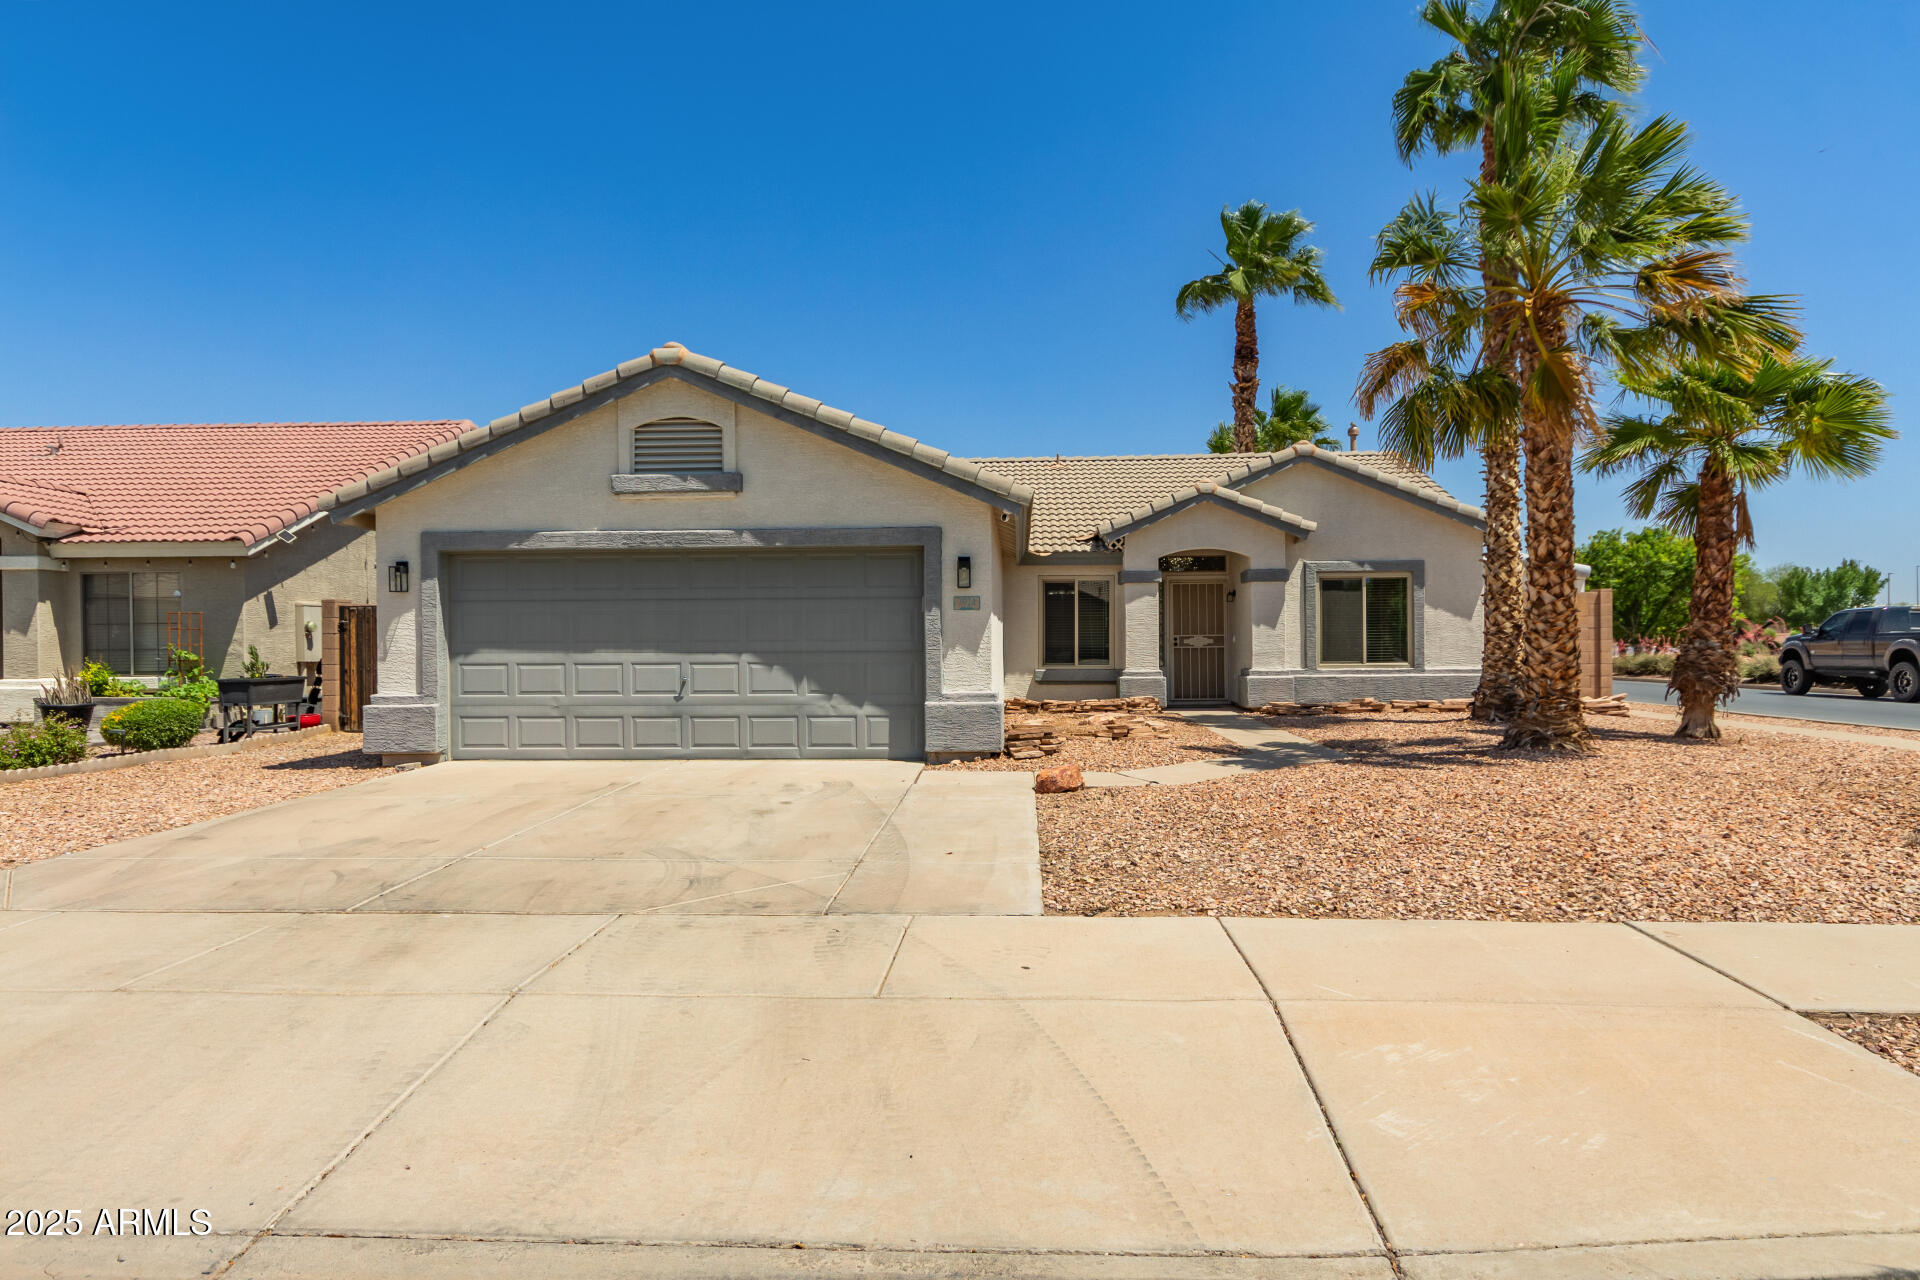
$285,000
3
bds
|
3
ba
|
2,139
sqft
|
built
2003
2831 W Margy Ct, Phoenix, AZ 85017
$-199
Cash flow
-3.6%
Cash-on-Cash Return
4.8%
Cap rate
0.7%
Rent to Value Ratio
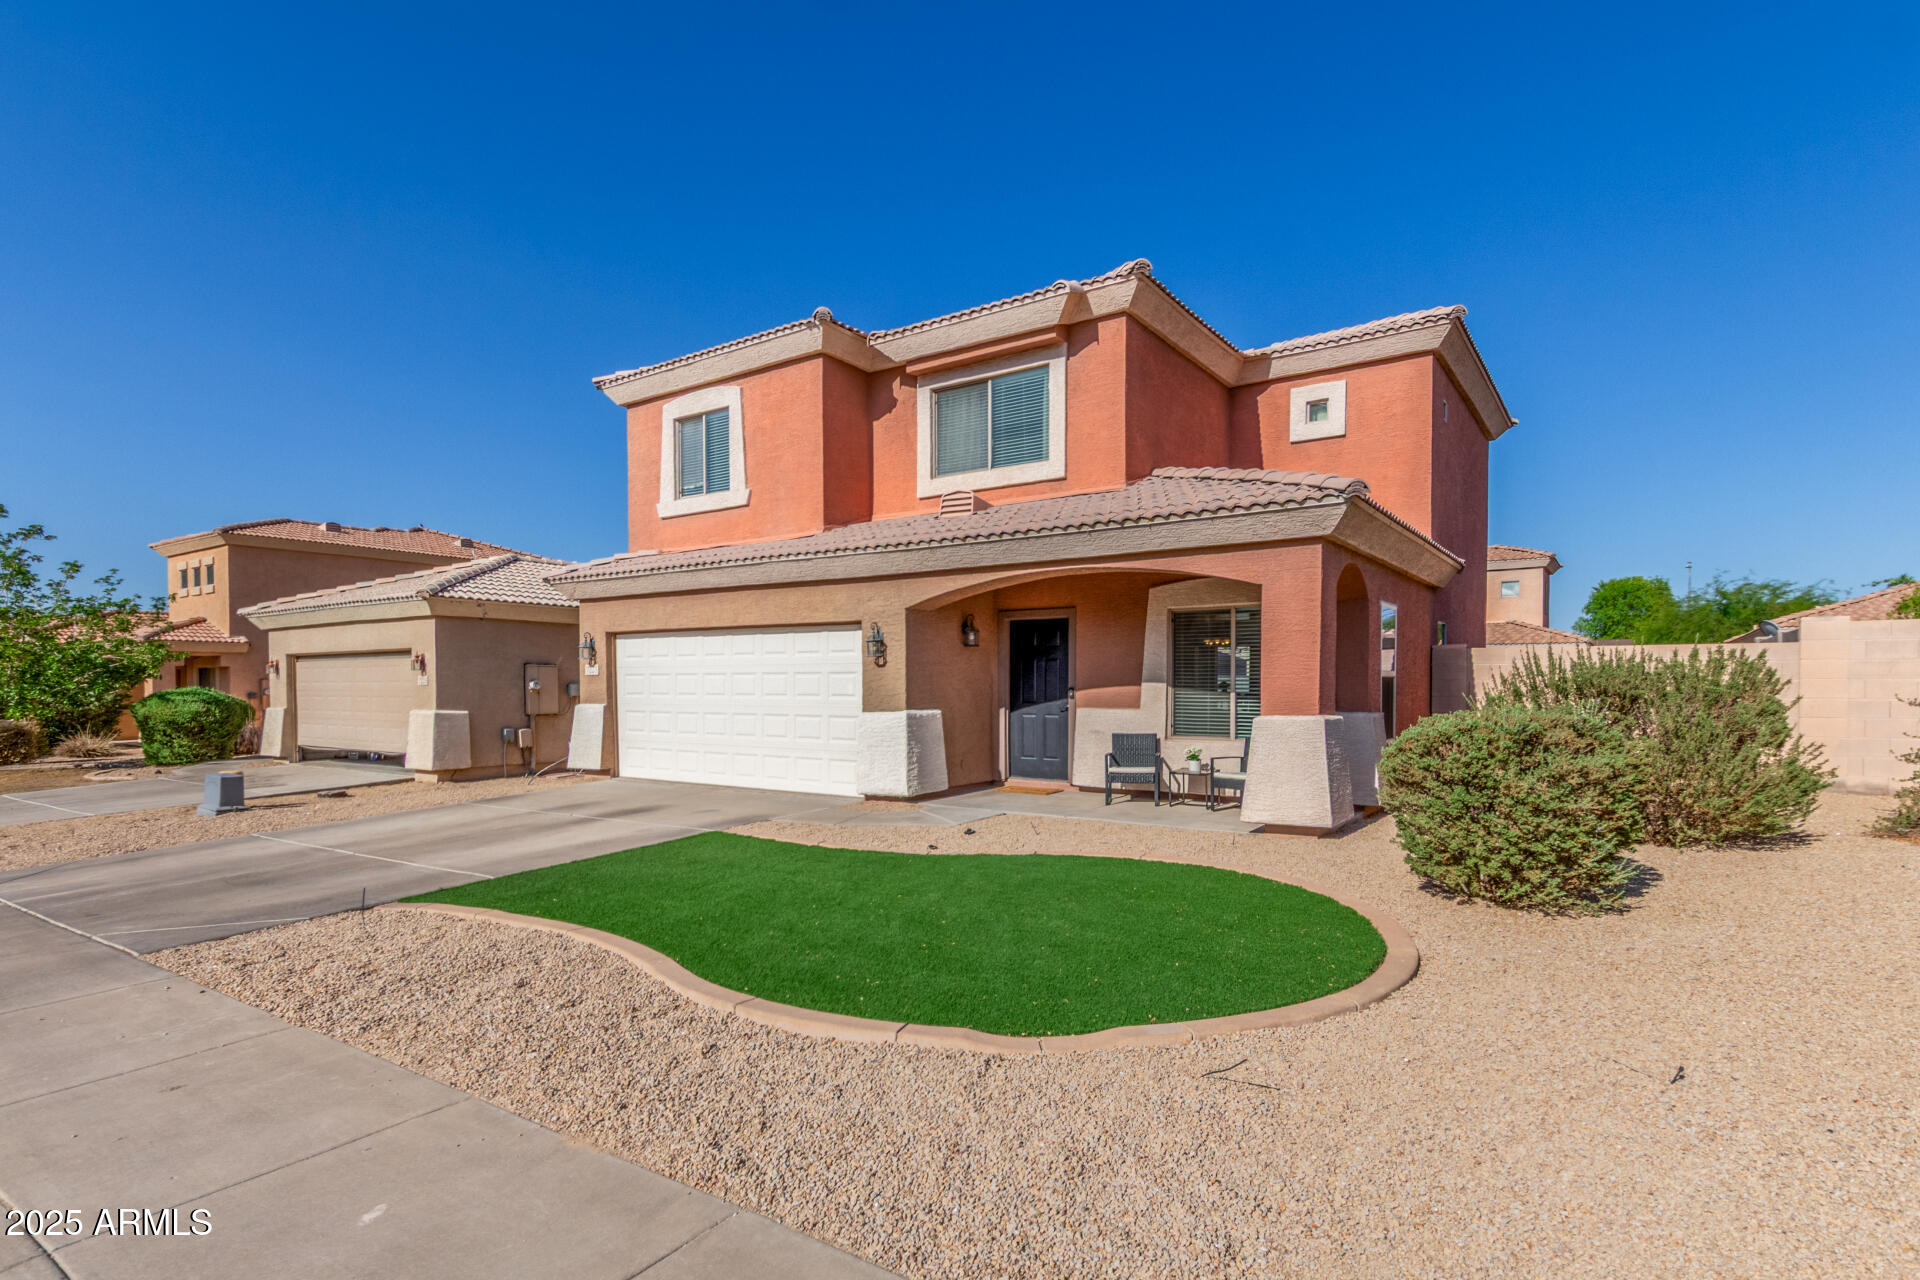
$439,000
4
bds
|
2
ba
|
1,656
sqft
|
built
2001
719 W Milada Dr, Phoenix, AZ 85041
$-605
Cash flow
-7.2%
Cash-on-Cash Return
4.0%
Cap rate
0.6%
Rent to Value Ratio
$2,500,000
5
bds
|
6
ba
|
3,704
sqft
|
built
2023
7851 N Central Ave, Phoenix, AZ 85020
$-9,322
Cash flow
-19.5%
Cash-on-Cash Return
1.2%
Cap rate
0.2%
Rent to Value Ratio
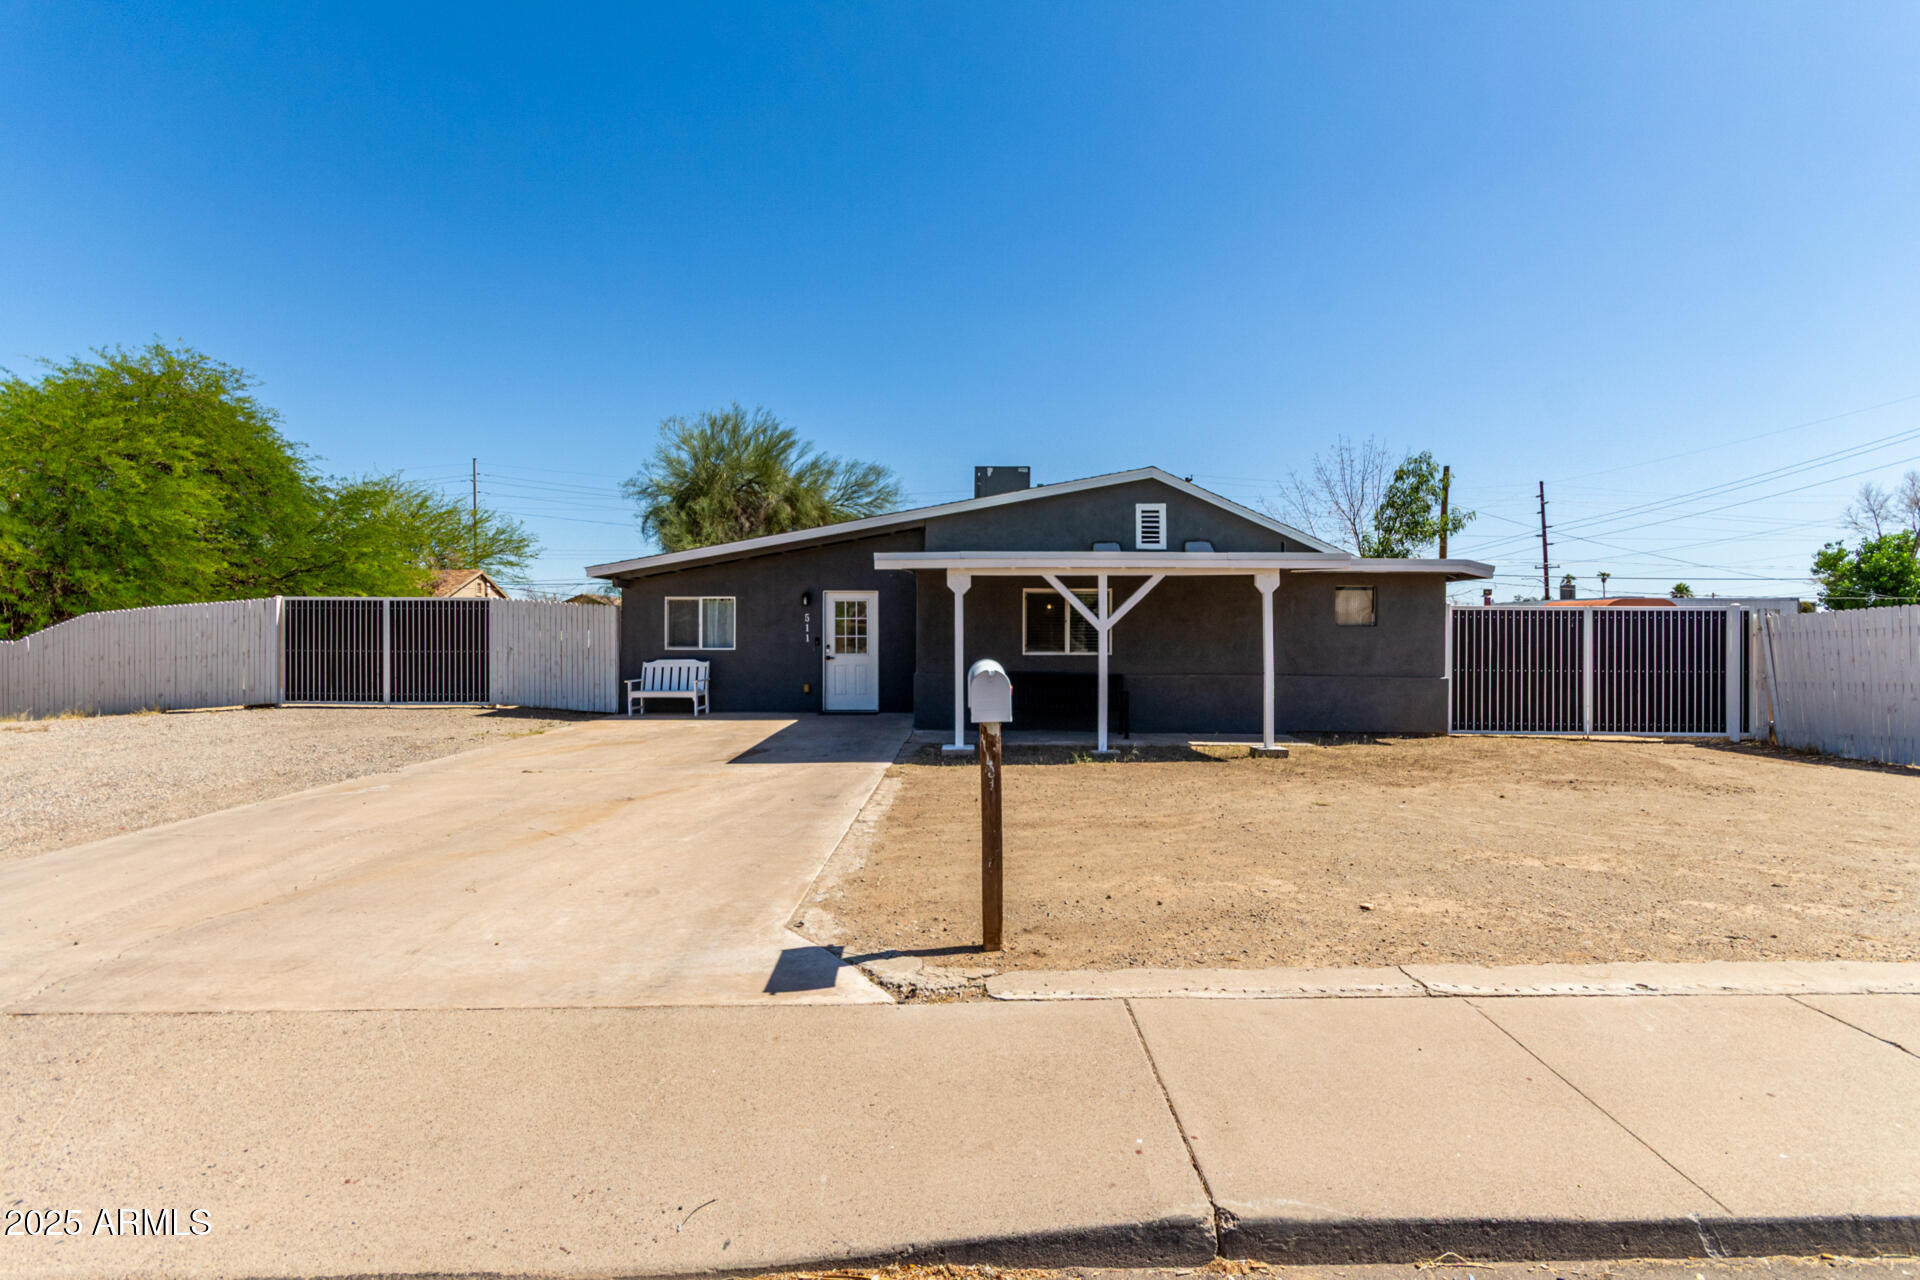
$375,000
3
bds
|
2
ba
|
1,186
sqft
|
built
1945
511 E Purdue Ave, Phoenix, AZ 85020
$-650
Cash flow
-9.0%
Cash-on-Cash Return
3.6%
Cap rate
0.5%
Rent to Value Ratio
$289,000
2
bds
|
1
ba
|
874
sqft
|
built
1950
2562 E Wier Ave, Phoenix, AZ 85040
$-307
Cash flow
-5.5%
Cash-on-Cash Return
4.4%
Cap rate
0.6%
Rent to Value Ratio
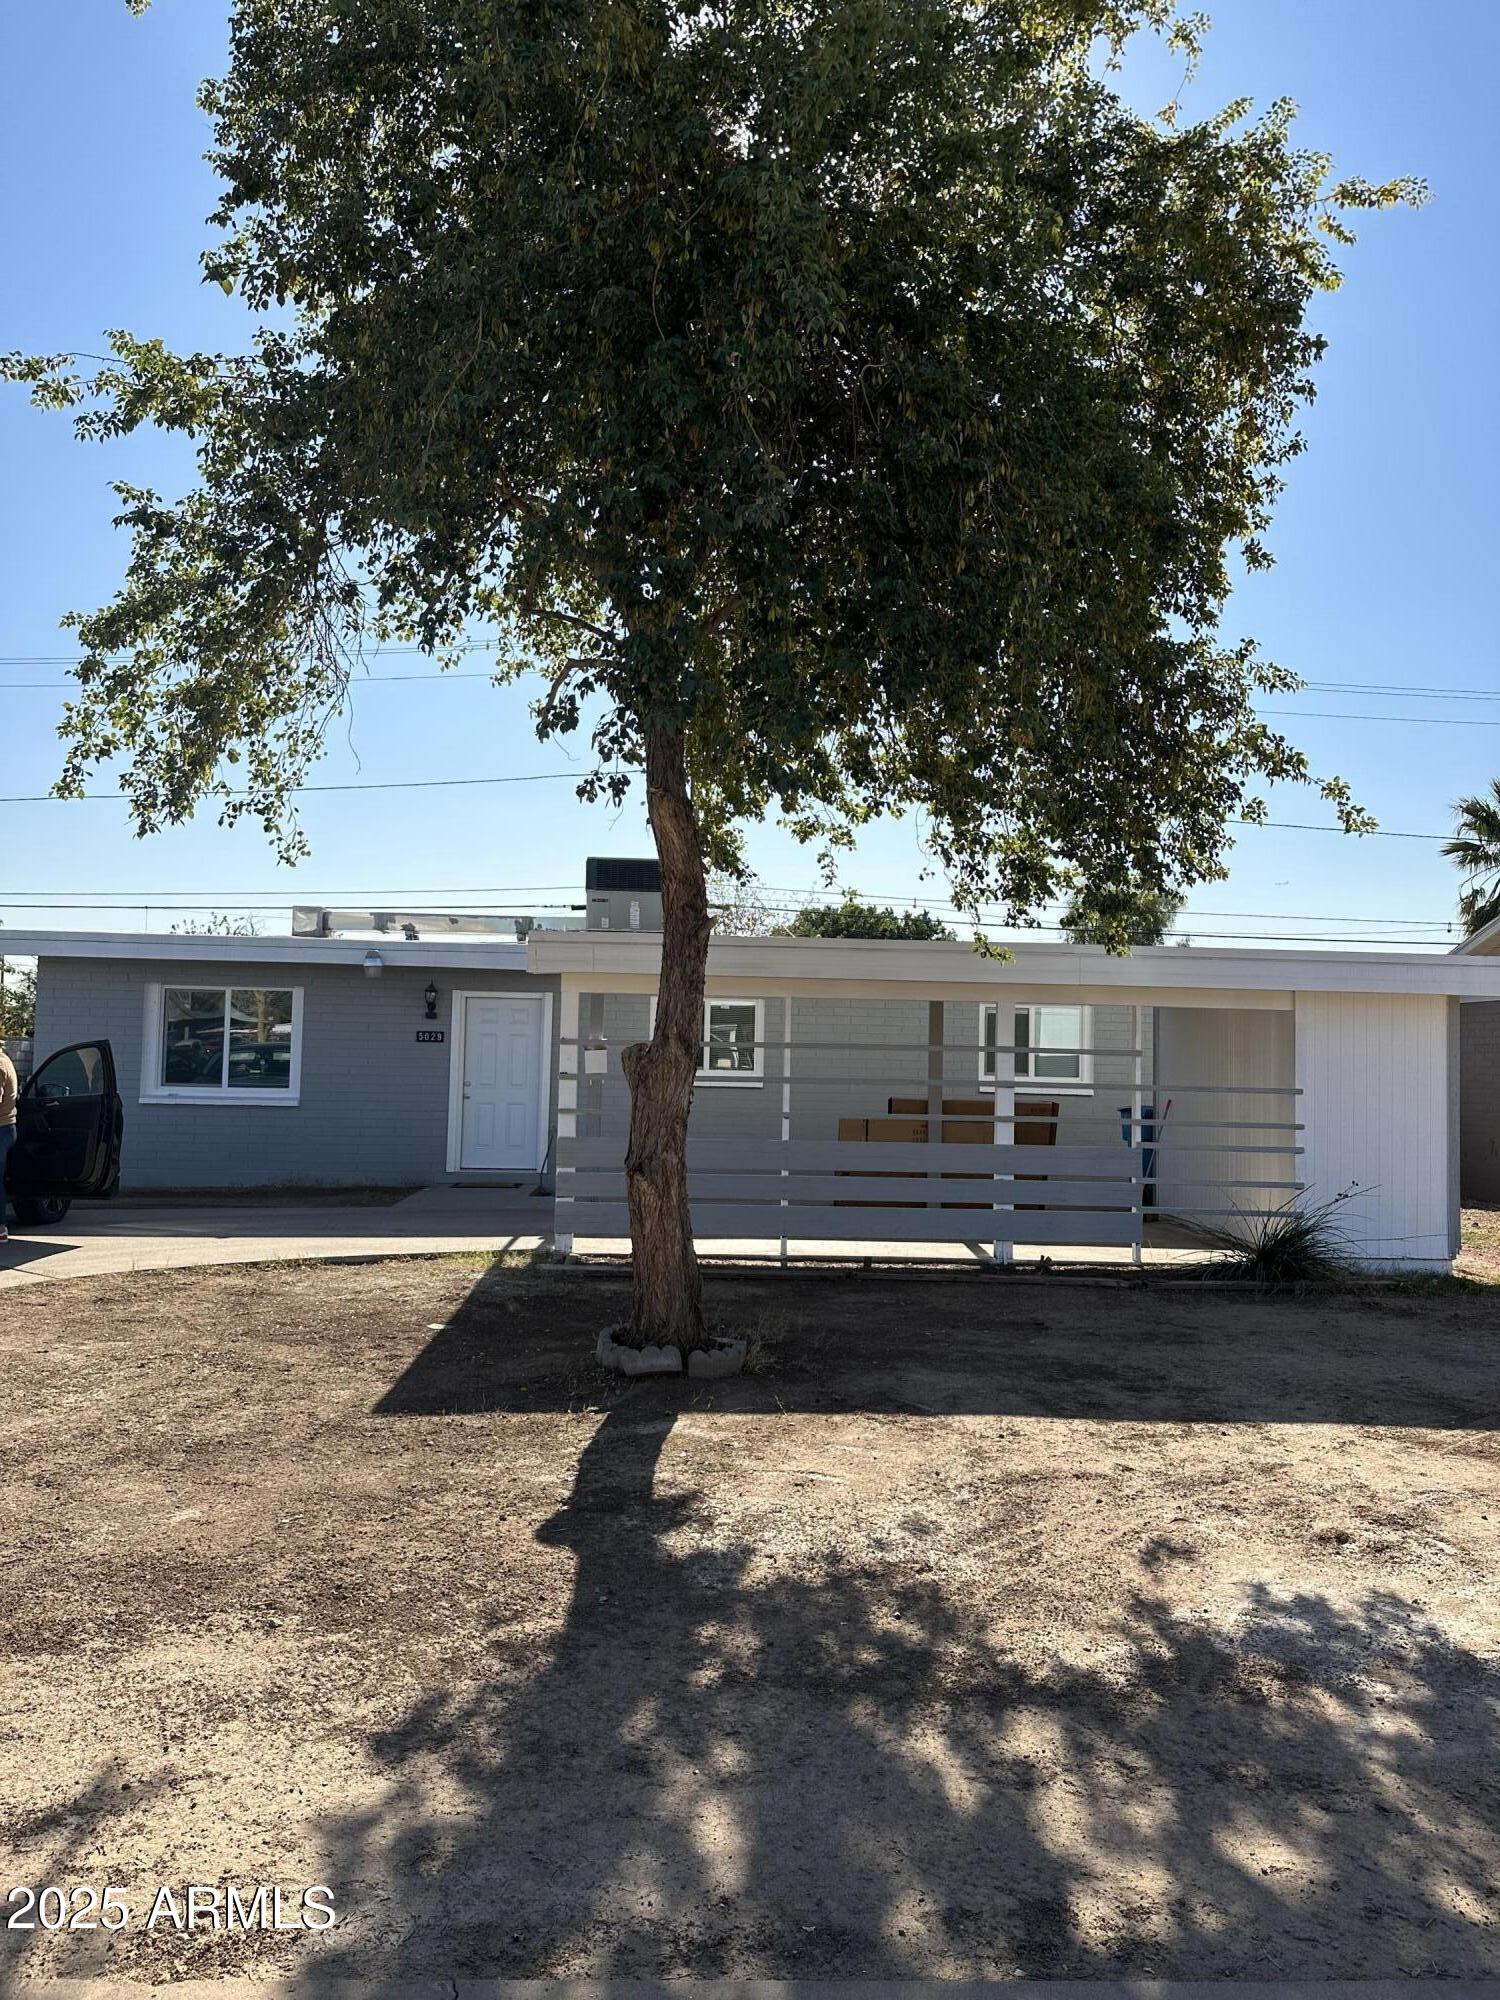
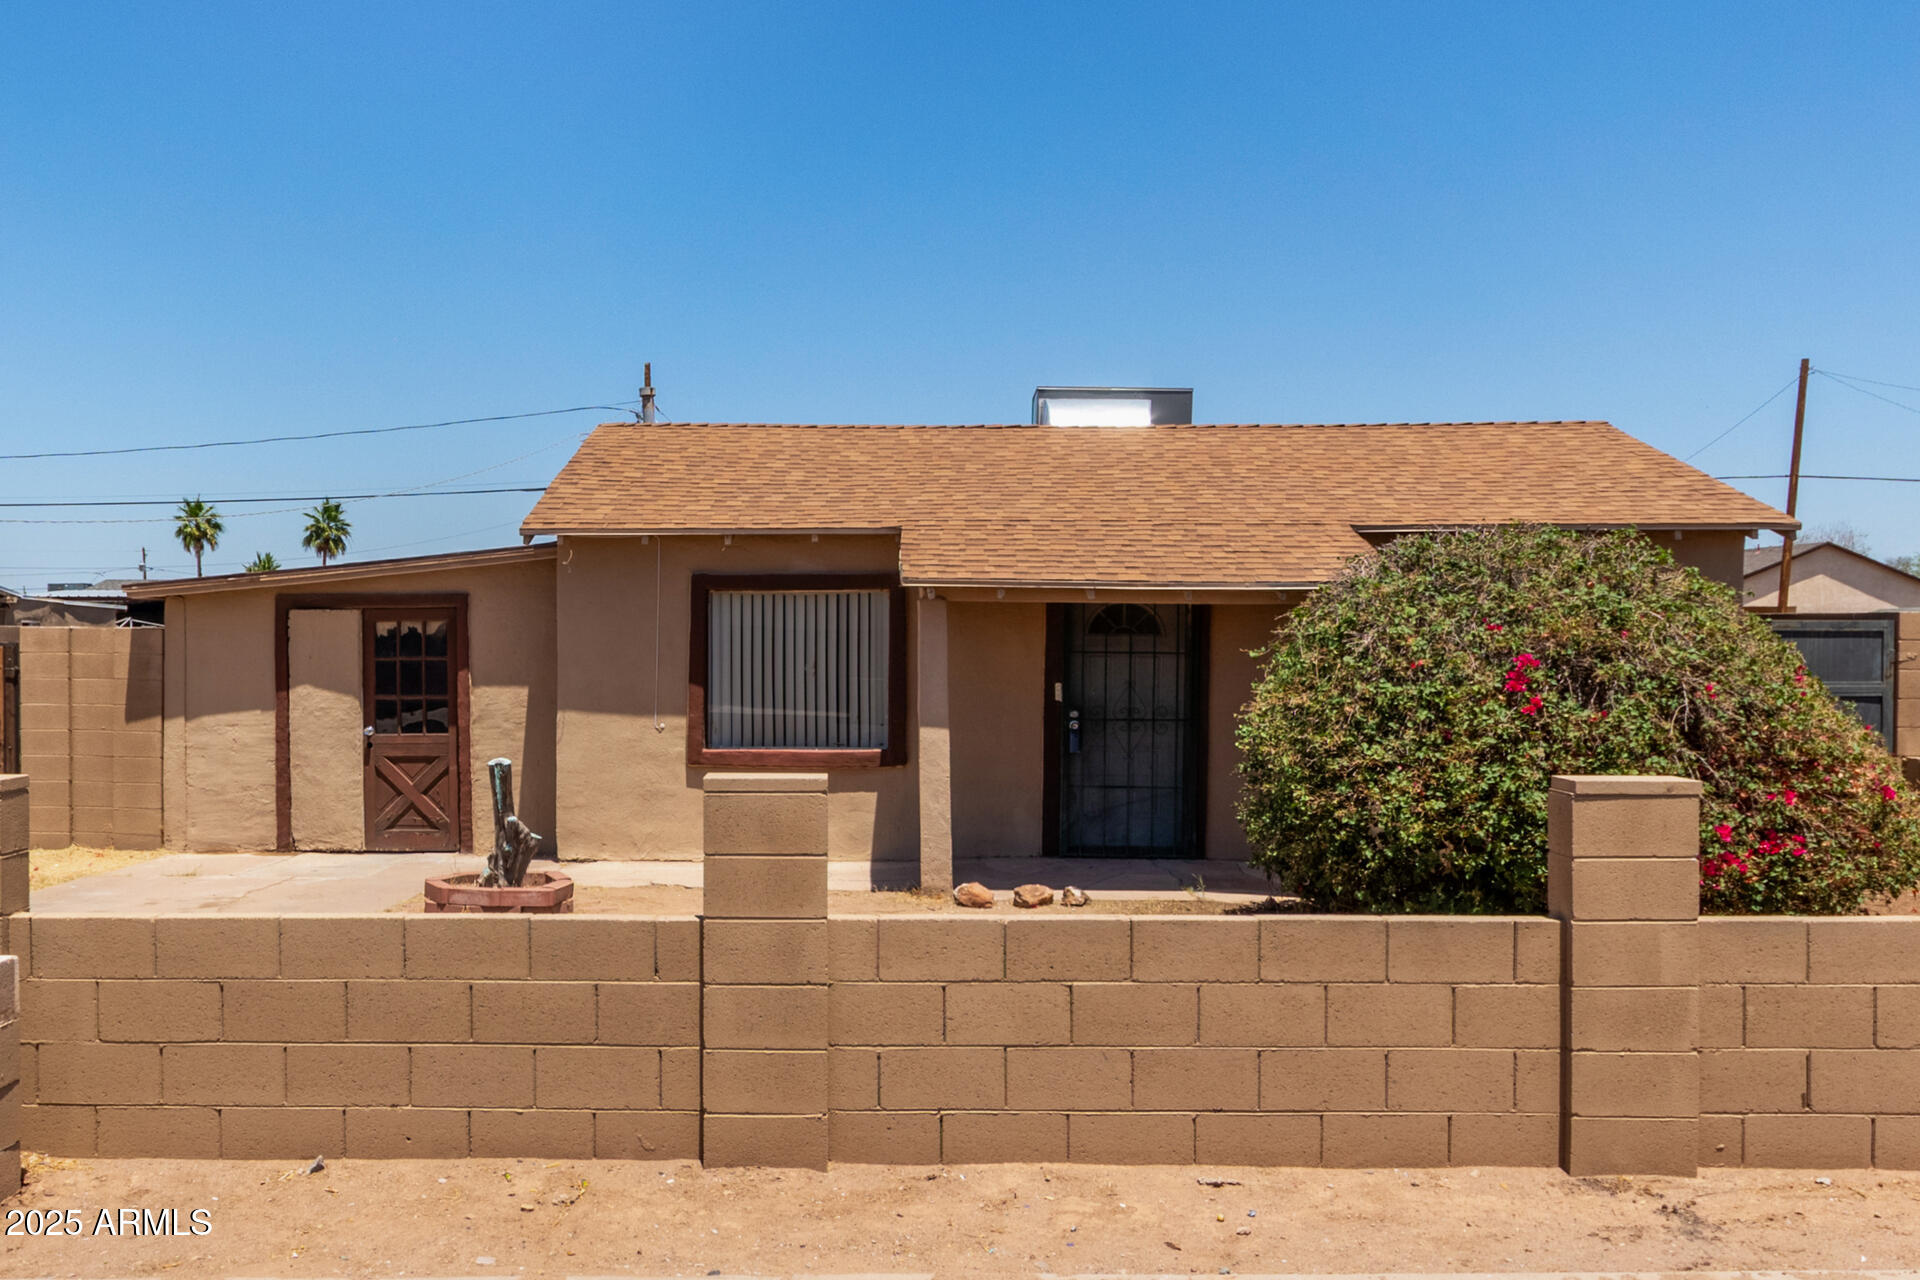
$375,000
3
bds
|
2
ba
|
1,320
sqft
|
built
1958
5029 W Osborn Rd, Phoenix, AZ 85031
$-734
Cash flow
-10.2%
Cash-on-Cash Return
3.3%
Cap rate
0.4%
Rent to Value Ratio

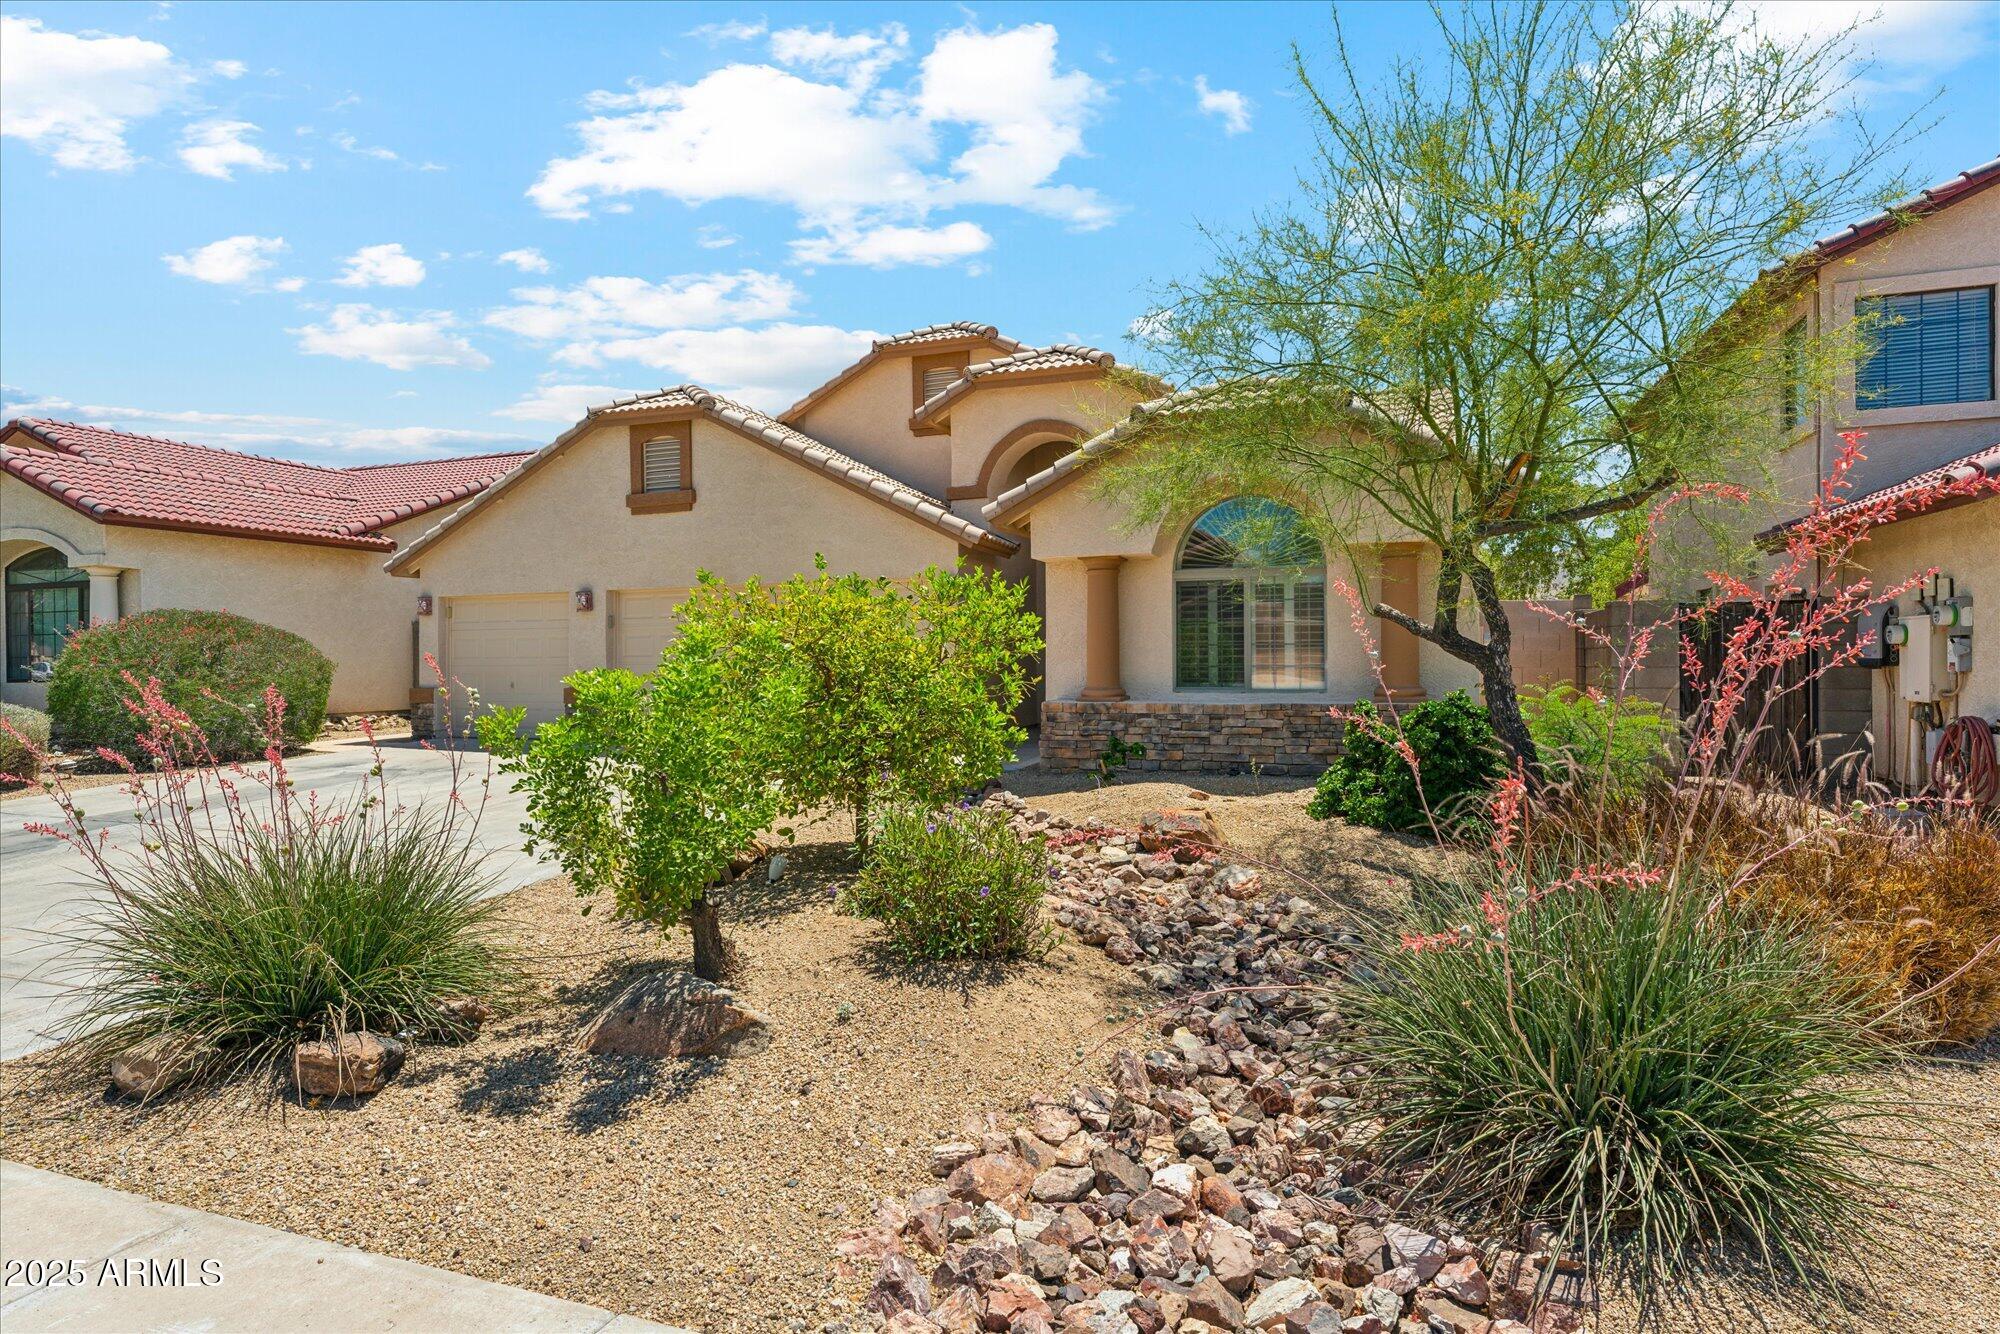
$865,000
5
bds
|
3
ba
|
2,900
sqft
|
built
1991
1667 E Saltsage Dr, Phoenix, AZ 85048
$-2,038
Cash flow
-12.3%
Cash-on-Cash Return
2.9%
Cap rate
0.4%
Rent to Value Ratio
$394,900
3
bds
|
2
ba
|
1,458
sqft
|
built
1969
3536 W Cholla St, Phoenix, AZ 85029
$-572
Cash flow
-7.6%
Cash-on-Cash Return
3.9%
Cap rate
0.5%
Rent to Value Ratio
$440,000
4
bds
|
2
ba
|
1,709
sqft
|
built
2018
802 W Buist Ave, Phoenix, AZ 85041
$-705
Cash flow
-8.4%
Cash-on-Cash Return
3.8%
Cap rate
0.5%
Rent to Value Ratio
$575,000
3
bds
|
2
ba
|
1,944
sqft
|
built
1979
2847 E Acoma Dr, Phoenix, AZ 85032
$-1,012
Cash flow
-9.2%
Cash-on-Cash Return
3.6%
Cap rate
0.5%
Rent to Value Ratio
$897,000
5
bds
|
4
ba
|
3,613
sqft
|
built
2006
6619 W Cordia Ln, Phoenix, AZ 85083
$-2,243
Cash flow
-13.0%
Cash-on-Cash Return
2.7%
Cap rate
0.4%
Rent to Value Ratio

$389,000
4
bds
|
2
ba
|
1,900
sqft
|
built
1960
3002 W Mandalay Ln, Phoenix, AZ 85053
$-849
Cash flow
-11.4%
Cash-on-Cash Return
3.1%
Cap rate
0.4%
Rent to Value Ratio

$469,999
4
bds
|
2
ba
|
1,930
sqft
|
built
2023
2335 W Sunland Ave, Phoenix, AZ 85041
$-945
Cash flow
-10.5%
Cash-on-Cash Return
3.3%
Cap rate
0.5%
Rent to Value Ratio
$10,995,000
7
bds
|
9
ba
|
8,302
sqft
|
built
2023
4763 N 53rd St, Phoenix, AZ 85018
$-46,884
Cash flow
-22.2%
Cash-on-Cash Return
0.6%
Cap rate
0.1%
Rent to Value Ratio
$525,000
3
bds
|
3
ba
|
1,663
sqft
|
built
1994
3222 E Cortez St, Phoenix, AZ 85028
$-1,060
Cash flow
-10.5%
Cash-on-Cash Return
3.3%
Cap rate
0.5%
Rent to Value Ratio
$409,000
2
bds
|
2
ba
|
953
sqft
|
built
2005
114 W Adams St, Phoenix, AZ 85003
$-1,609
Cash flow
-20.5%
Cash-on-Cash Return
1.0%
Cap rate
0.5%
Rent to Value Ratio
$399,000
3
bds
|
3
ba
|
1,532
sqft
|
built
2006
2331 E Sunland Ave, Phoenix, AZ 85040
$-882
Cash flow
-11.5%
Cash-on-Cash Return
3.0%
Cap rate
0.5%
Rent to Value Ratio
$695,000
4
bds
|
2
ba
|
2,334
sqft
|
built
1980
11822 S Coconino St, Phoenix, AZ 85044
$-1,746
Cash flow
-13.1%
Cash-on-Cash Return
2.7%
Cap rate
0.4%
Rent to Value Ratio
$485,000
2
bds
|
2
ba
|
1,277
sqft
|
built
1990
5104 N 32nd St, Phoenix, AZ 85018
$-1,413
Cash flow
-15.2%
Cash-on-Cash Return
2.2%
Cap rate
0.5%
Rent to Value Ratio
$1,195,000
4
bds
|
3
ba
|
1,558
sqft
|
built
1949
20 W Pasadena Ave, Phoenix, AZ 85013
$-2,828
Cash flow
-12.3%
Cash-on-Cash Return
2.8%
Cap rate
0.4%
Rent to Value Ratio
$678,000
4
bds
|
3
ba
|
2,590
sqft
|
built
2015
2543 W Rabjohn Rd, Phoenix, AZ 85085
$-1,250
Cash flow
-9.6%
Cash-on-Cash Return
3.5%
Cap rate
0.5%
Rent to Value Ratio

$1,499,900
4
bds
|
4
ba
|
3,785
sqft
|
built
2005
22317 N 39th Run, Phoenix, AZ 85050
$-2,128
Cash flow
-7.4%
Cash-on-Cash Return
4.0%
Cap rate
0.5%
Rent to Value Ratio
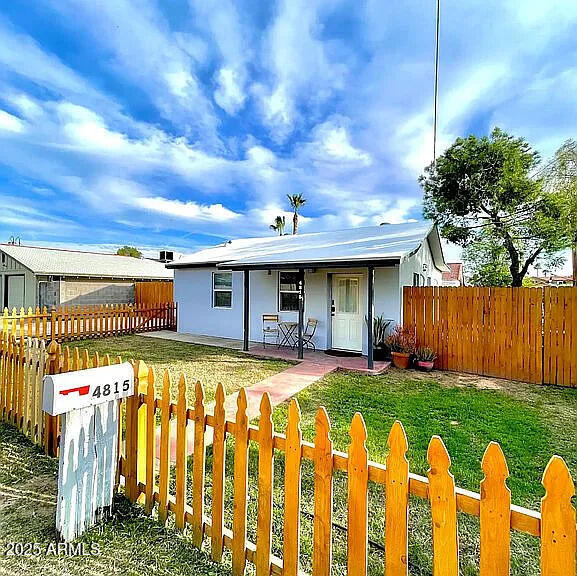
$495,000
2
bds
|
3
ba
|
1,000
sqft
|
built
1945
4815 E Windsor Ave, Phoenix, AZ 85008
$-1,476
Cash flow
-15.6%
Cash-on-Cash Return
2.1%
Cap rate
0.3%
Rent to Value Ratio
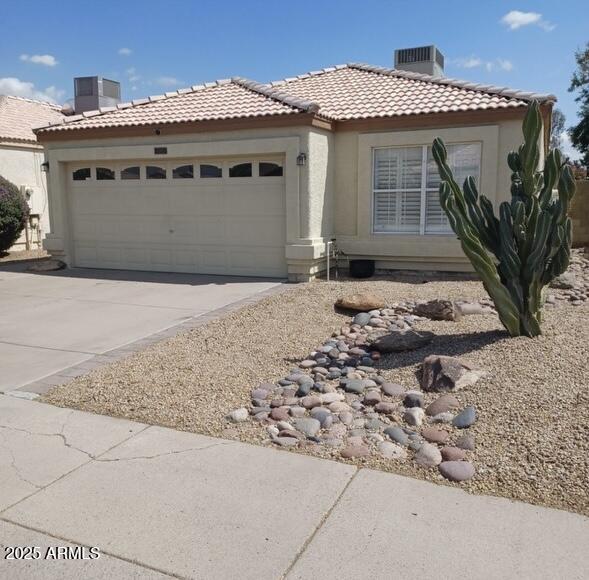
$539,900
3
bds
|
2
ba
|
1,409
sqft
|
built
1995
4765 E Charleston Ave, Phoenix, AZ 85032
$-1,055
Cash flow
-10.2%
Cash-on-Cash Return
3.3%
Cap rate
0.5%
Rent to Value Ratio
$340,000
3
bds
|
2
ba
|
1,395
sqft
|
built
1959
2908 N 53rd Ln, Phoenix, AZ 85031
$-299
Cash flow
-4.6%
Cash-on-Cash Return
4.6%
Cap rate
0.6%
Rent to Value Ratio

$925,000
3
bds
|
3
ba
|
2,552
sqft
|
built
2005
1535 W Winter Dr, Phoenix, AZ 85021
$-2,476
Cash flow
-14.0%
Cash-on-Cash Return
2.5%
Cap rate
0.4%
Rent to Value Ratio

$525,000
3
bds
|
2
ba
|
1,304
sqft
|
built
1979
828 E Le Marche Ave, Phoenix, AZ 85022
$-1,116
Cash flow
-11.1%
Cash-on-Cash Return
3.1%
Cap rate
0.4%
Rent to Value Ratio